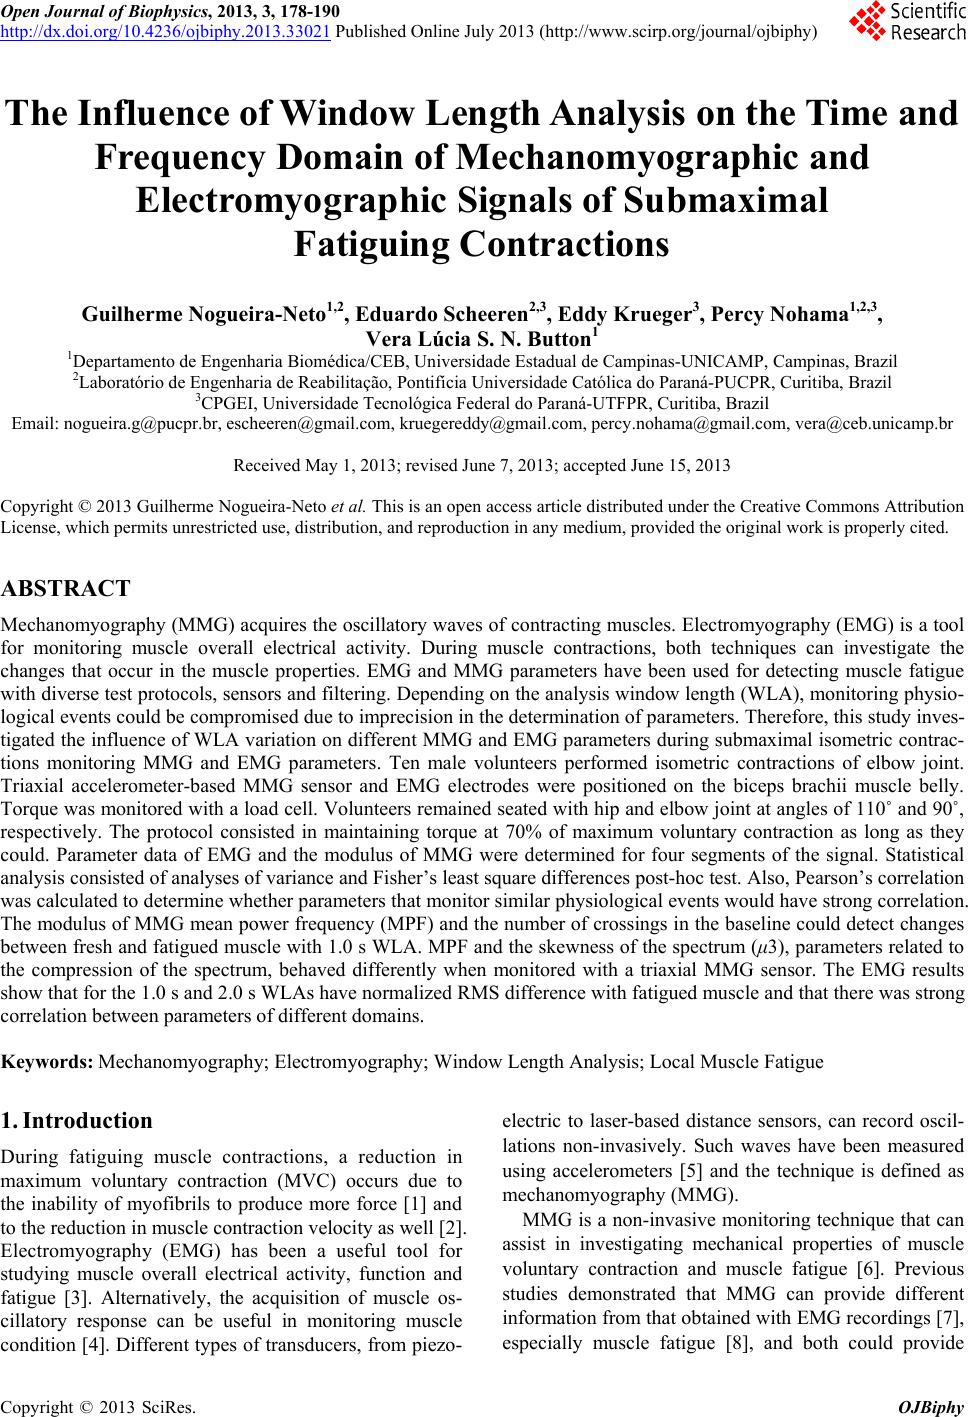
 Open Journal of Biophysics, 2013, 3, 178-190 http://dx.doi.org/10.4236/ojbiphy.2013.33021 Published Online July 2013 (http://www.scirp.org/journal/ojbiphy) The Influence of Window Length Analysis on the Time and Frequency Domain of Mechanomyographic and Electromyographic Signals of Submaximal Fatiguing Contractions Guilherme Nogueira-Neto1,2, Eduardo Scheeren2,3, Eddy Krueger3, Percy Nohama1,2,3, Vera Lúcia S. N. Button1 1Departamento de Engenharia Biomédica/CEB, Universidade Estadual de Campinas-UNICAMP, Campinas, Brazil 2Laboratório de Engenharia de Reabilitação, Pontifícia Universidade Católica do Paraná-PUCPR, Curitiba, Brazil 3CPGEI, Universidade Tecnológica Federal do Paraná-UTFPR, Curitiba, Brazil Email: nogueira.g@pucpr.br, escheeren@gmail.com, kruegereddy@gmail.com, percy.nohama@gmail.com, vera@ceb.unicamp.br Received May 1, 2013; revised June 7, 2013; accepted June 15, 2013 Copyright © 2013 Guilherme Nogueira-Neto et al. This is an open access article distributed under the Creative Commons Attribution License, which permits unrestricted use, distribution, and reproduction in any medium, provided the original work is properly cited. ABSTRACT Mechanomyography (MMG) acquires the oscillatory waves of contracting muscles. Electromyography (EMG) is a tool for monitoring muscle overall electrical activity. During muscle contractions, both techniques can investigate the changes that occur in the muscle properties. EMG and MMG parameters have been used for detecting muscle fatigue with diverse test protocols, sensors and filtering. Depending on the analysis window length (WLA), monitoring physio- logical events could be compromised due to imprecision in the determination of parameters. Therefore, this study inves- tigated the influence of WLA variation on different MMG and EMG parameters during submaximal isometric contrac- tions monitoring MMG and EMG parameters. Ten male volunteers performed isometric contractions of elbow joint. Triaxial accelerometer-based MMG sensor and EMG electrodes were positioned on the biceps brachii muscle belly. Torque was monitored with a load cell. Volunteers remained seated with hip and elbow joint at angles of 110˚ and 90˚, respectively. The protocol consisted in maintaining torque at 70% of maximum voluntary contraction as long as they could. Parameter data of EMG and the modulus of MMG were determined for four segments of the signal. Statistical analysis consisted of analyses of variance and Fisher’s least square differences post-hoc test. Also, Pearson’s correlation was calculated to determine whether parameters that monitor similar physiological events would have strong correlation. The modulus of MMG mean power frequency (MPF) and the number of crossings in the baseline could detect changes between fresh and fatigued muscle with 1.0 s WLA. MPF and the skewness of the spectrum (μ3), parameters related to the compression of the spectrum, behaved differently when monitored with a triaxial MMG sensor. The EMG results show that for the 1.0 s and 2.0 s WLAs have normalized RMS difference with fatigued muscle and that there was strong correlation between parameters of different domains. Keywords: Mechanomyography; Electromyography; Window Length Analysis; Local Muscle Fatigue 1. Introduction During fatiguing muscle contractions, a reduction in maximum voluntary contraction (MVC) occurs due to the inability of myofibrils to produce more force [1] and to the reduction in muscle contraction velocity as well [2]. Electromyography (EMG) has been a useful tool for studying muscle overall electrical activity, function and fatigue [3]. Alternatively, the acquisition of muscle os- cillatory response can be useful in monitoring muscle condition [4]. Different types of transducers, from piezo- electric to laser-based distance sensors, can record oscil- lations non-invasively. Such waves have been measured using accelerometers [5] and the technique is defined as mechanomyography (MMG). MMG is a non-invasive monitoring technique that can assist in investigating mechanical properties of muscle voluntary contraction and muscle fatigue [6]. Previous studies demonstrated that MMG can provide different information from that obtained with EMG recordings [7], especially muscle fatigue [8], and both could provide C opyright © 2013 SciRes. OJBiphy 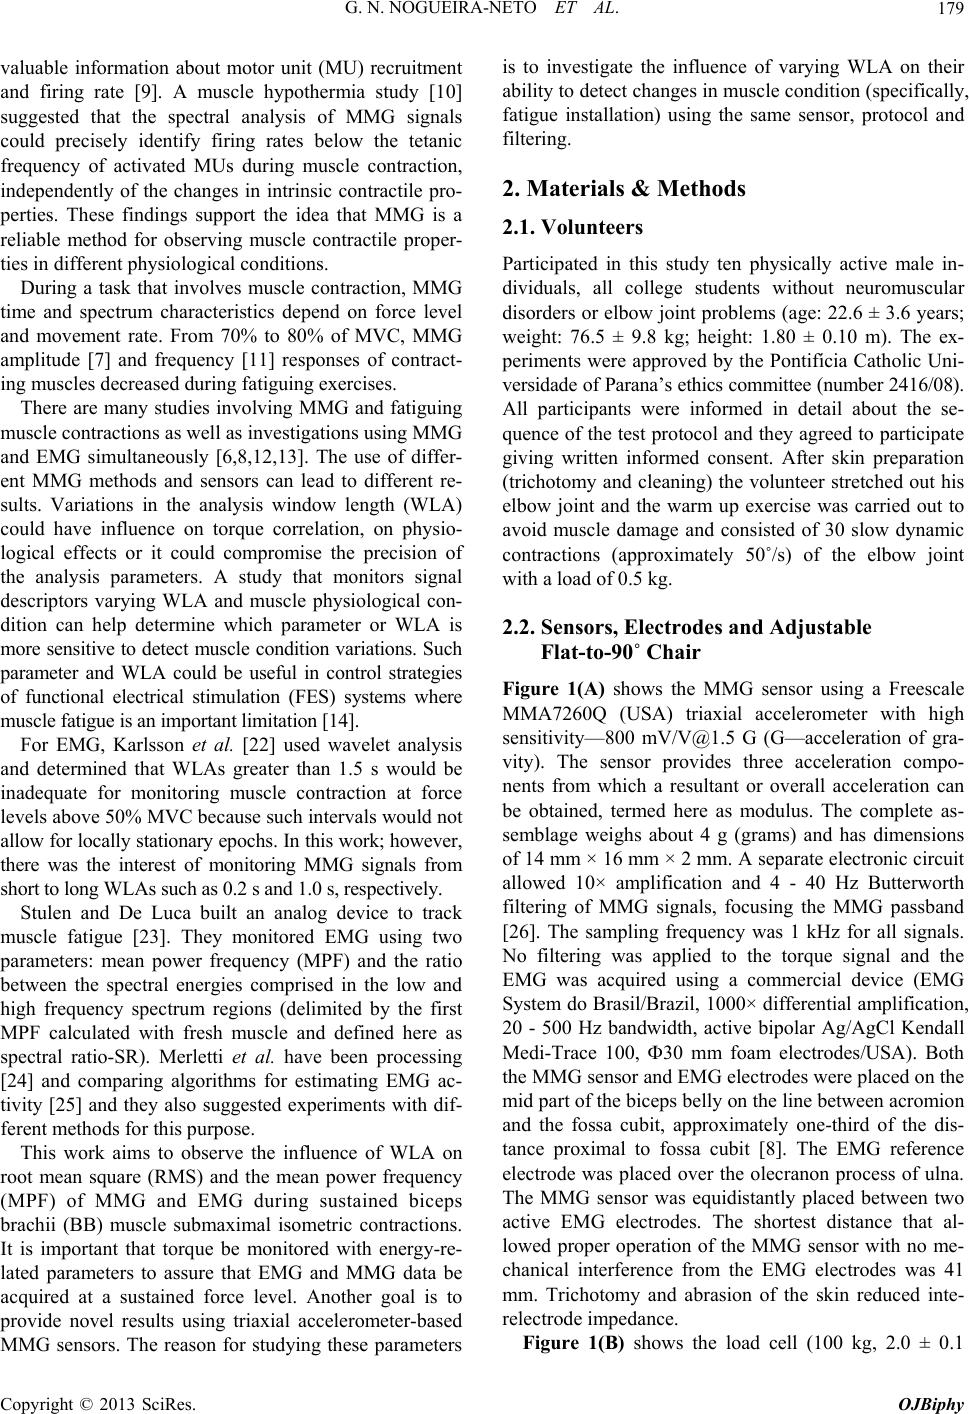 G. N. NOGUEIRA-NETO ET AL. 179 valuable information about motor unit (MU) recruitment and firing rate [9]. A muscle hypothermia study [10] suggested that the spectral analysis of MMG signals could precisely identify firing rates below the tetanic frequency of activated MUs during muscle contraction, independently of the changes in intrinsic contractile pro- perties. These findings support the idea that MMG is a reliable method for observing muscle contractile proper- ties in different physiological conditions. During a task that involves muscle contraction, MMG time and spectrum characteristics depend on force level and movement rate. From 70% to 80% of MVC, MMG amplitude [7] and frequency [11] responses of contract- ing muscles decreased during fatiguing exercises. There are many studies involving MMG and fatiguing muscle contractions as well as investigations using MMG and EMG simultaneously [6,8,12,13]. The use of differ- ent MMG methods and sensors can lead to different re- sults. Variations in the analysis window length (WLA) could have influence on torque correlation, on physio- logical effects or it could compromise the precision of the analysis parameters. A study that monitors signal descriptors varying WLA and muscle physiological con- dition can help determine which parameter or WLA is more sensitive to detect muscle condition variations. Such parameter and WLA could be useful in control strategies of functional electrical stimulation (FES) systems where muscle fatigue is an important limitation [14]. For EMG, Karlsson et al. [22] used wavelet analysis and determined that WLAs greater than 1.5 s would be inadequate for monitoring muscle contraction at force levels above 50% MVC because such intervals would not allow for locally stationary epochs. In this work; however, there was the interest of monitoring MMG signals from short to long WLAs such as 0.2 s and 1.0 s, respectively. Stulen and De Luca built an analog device to track muscle fatigue [23]. They monitored EMG using two parameters: mean power frequency (MPF) and the ratio between the spectral energies comprised in the low and high frequency spectrum regions (delimited by the first MPF calculated with fresh muscle and defined here as spectral ratio-SR). Merletti et al. have been processing [24] and comparing algorithms for estimating EMG ac- tivity [25] and they also suggested experiments with dif- ferent methods for this purpose. This work aims to observe the influence of WLA on root mean square (RMS) and the mean power frequency (MPF) of MMG and EMG during sustained biceps brachii (BB) muscle submaximal isometric contractions. It is important that torque be monitored with energy-re- lated parameters to assure that EMG and MMG data be acquired at a sustained force level. Another goal is to provide novel results using triaxial accelerometer-based MMG sensors. The reason for studying these parameters is to investigate the influence of varying WLA on their ability to detect changes in muscle condition (specifically, fatigue installation) using the same sensor, protocol and filtering. 2. Materials & Methods 2.1. Volunteers Participated in this study ten physically active male in- dividuals, all college students without neuromuscular disorders or elbow joint problems (age: 22.6 ± 3.6 years; weight: 76.5 ± 9.8 kg; height: 1.80 ± 0.10 m). The ex- periments were approved by the Pontifícia Catholic Uni- versidade of Parana’s ethics committee (number 2416/08). All participants were informed in detail about the se- quence of the test protocol and they agreed to participate giving written informed consent. After skin preparation (trichotomy and cleaning) the volunteer stretched out his elbow joint and the warm up exercise was carried out to avoid muscle damage and consisted of 30 slow dynamic contractions (approximately 50˚/s) of the elbow joint with a load of 0.5 kg. 2.2. Sensors, Electrodes and Adjustable Flat-to-90˚ Chair Figure 1(A) shows the MMG sensor using a Freescale MMA7260Q (USA) triaxial accelerometer with high sensitivity—800 mV/V@1.5 G (G—acceleration of gra- vity). The sensor provides three acceleration compo- nents from which a resultant or overall acceleration can be obtained, termed here as modulus. The complete as- semblage weighs about 4 g (grams) and has dimensions of 14 mm × 16 mm × 2 mm. A separate electronic circuit allowed 10× amplification and 4 - 40 Hz Butterworth filtering of MMG signals, focusing the MMG passband [26]. The sampling frequency was 1 kHz for all signals. No filtering was applied to the torque signal and the EMG was acquired using a commercial device (EMG System do Brasil/Brazil, 1000× differential amplification, 20 - 500 Hz bandwidth, active bipolar Ag/AgCl Kendall Medi-Trace 100, 30 mm foam electrodes/USA). Both the MMG sensor and EMG electrodes were placed on the mid part of the biceps belly on the line between acromion and the fossa cubit, approximately one-third of the dis- tance proximal to fossa cubit [8]. The EMG reference electrode was placed over the olecranon process of ulna. The MMG sensor was equidistantly placed between two active EMG electrodes. The shortest distance that al- lowed proper operation of the MMG sensor with no me- chanical interference from the EMG electrodes was 41 mm. Trichotomy and abrasion of the skin reduced inte- relectrode impedance. Figure 1(B) shows the load cell (100 kg, 2.0 ± 0.1 Copyright © 2013 SciRes. OJBiphy 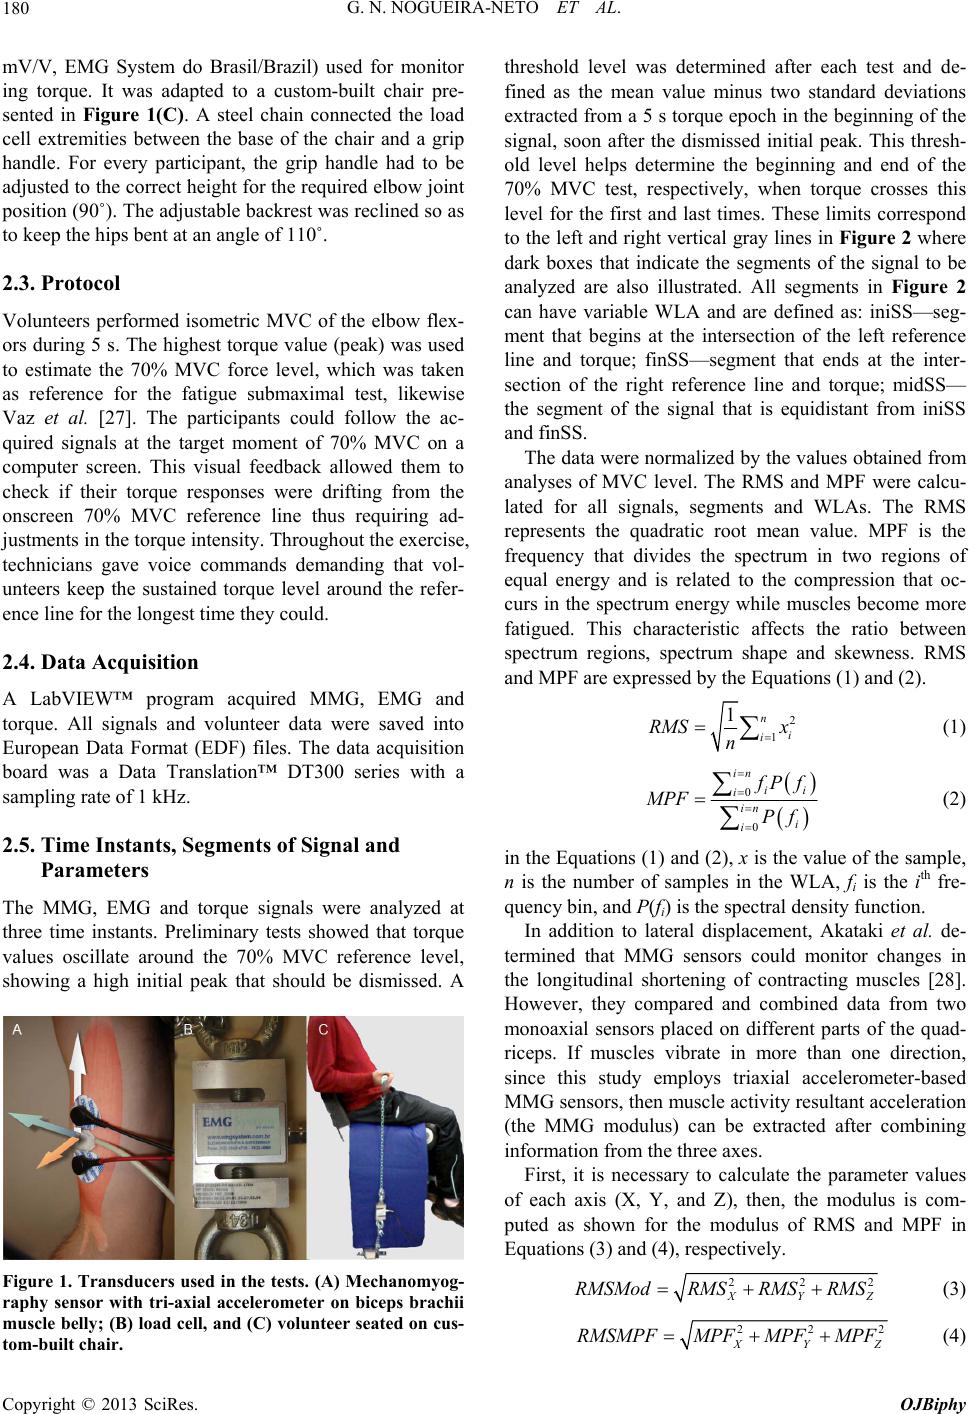 G. N. NOGUEIRA-NETO ET AL. 180 mV/V, EMG System do Brasil/Brazil) used for monitor ing torque. It was adapted to a custom-built chair pre- sented in Figure 1(C). A steel chain connected the load cell extremities between the base of the chair and a grip handle. For every participant, the grip handle had to be adjusted to the correct height for the required elbow joint position (90˚). The adjustable backrest was reclined so as to keep the hips bent at an angle of 110˚. 2.3. Protocol Volunteers performed isometric MVC of the elbow flex- ors during 5 s. The highest torque value (peak) was used to estimate the 70% MVC force level, which was taken as reference for the fatigue submaximal test, likewise Vaz et al. [27]. The participants could follow the ac- quired signals at the target moment of 70% MVC on a computer screen. This visual feedback allowed them to check if their torque responses were drifting from the onscreen 70% MVC reference line thus requiring ad- justments in the torque intensity. Throughout the exercise, technicians gave voice commands demanding that vol- unteers keep the sustained torque level around the refer- ence line for the longest time they could. 2.4. Data Acquisition A LabVIEW™ program acquired MMG, EMG and torque. All signals and volunteer data were saved into European Data Format (EDF) files. The data acquisition board was a Data Translation™ DT300 series with a sampling rate of 1 kHz. 2.5. Time Instants, Segments of Signal and Parameters The MMG, EMG and torque signals were analyzed at three time instants. Preliminary tests showed that torque values oscillate around the 70% MVC reference level, showing a high initial peak that should be dismissed. A Figure 1. Transducers used in the tests. (A) Mechanomyog- raphy sensor with tri-axial accelerometer on biceps brachii muscle belly; (B) load cell, and (C) volunteer seated on cus- tom-built chair. threshold level was determined after each test and de- fined as the mean value minus two standard deviations extracted from a 5 s torque epoch in the beginning of the signal, soon after the dismissed initial peak. This thresh- old level helps determine the beginning and end of the 70% MVC test, respectively, when torque crosses this level for the first and last times. These limits correspond to the left and right vertical gray lines in Figure 2 where dark boxes that indicate the segments of the signal to be analyzed are also illustrated. All segments in Figure 2 can have variable WLA and are defined as: iniSS—seg- ment that begins at the intersection of the left reference line and torque; finSS—segment that ends at the inter- section of the right reference line and torque; midSS— the segment of the signal that is equidistant from iniSS and finSS. The data were normalized by the values obtained from analyses of MVC level. The RMS and MPF were calcu- lated for all signals, segments and WLAs. The RMS represents the quadratic root mean value. MPF is the frequency that divides the spectrum in two regions of equal energy and is related to the compression that oc- curs in the spectrum energy while muscles become more fatigued. This characteristic affects the ratio between spectrum regions, spectrum shape and skewness. RMS and MPF are expressed by the Equations (1) and (2). 2 1 1n i i RMS x n (1) 0 0 in ii i in i i Pf MPF Pf (2) in the Equations (1) and (2), x is the value of the sample, n is the number of samples in the WLA, fi is the ith fre- quency bin, and P(fi) is the spectral density function. In addition to lateral displacement, Akataki et al. de- termined that MMG sensors could monitor changes in the longitudinal shortening of contracting muscles [28]. However, they compared and combined data from two monoaxial sensors placed on different parts of the quad- riceps. If muscles vibrate in more than one direction, since this study employs triaxial accelerometer-based MMG sensors, then muscle activity resultant acceleration (the MMG modulus) can be extracted after combining information from the three axes. First, it is necessary to calculate the parameter values of each axis (X, Y, and Z), then, the modulus is com- puted as shown for the modulus of RMS and MPF in Equations (3) and (4), respectively. 22 XY RMSModRMSRMS RMS 2 Z (3) 22 XY RMSMPFMPF MPF MPF 2 Z (4) Copyright © 2013 SciRes. OJBiphy  G. N. NOGUEIRA-NETO ET AL. Copyright © 2013 SciRes. OJBiphy 181 Figure 2. Example of the torque output (gray curve) and mechanomyography (MMG) sensor Z axis (blue curve) for a same subject. Both signals were simultaneously recorded for biceps brachii muscle during sustained submaximal isetric elbow an ± standard deviation. Sta- med using SPSSTM for Win- uration of the tests was 46 ± 16 s. All data antly drawn from a normally distributed investigated in the analysis of torque level the results are shown in Table 1. Table 1 iniSS, midSS and finSS. Differences between segments were only found related to aftSS. This implies that vol- ed. Table 3 summarizes mean ± stan- owed statistical differences LAs. Each pair of symbols om flexion. iniSS, midSS, finSS and aftSS (initial, middle, final, and after signal segments, respectively) appear in the picture with brighter colors. Above the signals are the indication of the analysis window lengths (2.0 s, 1.0 s, 0.5 s, 0.3 s, and 0.2 s WLAs) and the threshold is indicated by a red line. 2.6. Statistical Analysis All data are presented as me tistical analyses were perfor dows version 11.0. One-way analysis of variance (ANOVA) with Fisher's least square differences (LSD) post hoc test was used to confirm differences between data groups. The first analysis investigated differences between the signal segments (iniSS, midSS and finSS) in every WLA. The second analysis tried to observe statis- tical differences between WLAs in every signal segment. Since some parameters were supposed to behave simi- larly, there was the interest in determining whether they would present linear correlation coefficients. Therefore, Pearson’s correlation coefficients were calculated. All tests adopted a significance level of p < 0.05. 3. Results The average d were signific population according to Shapiro-Wilk tests. The follow- ing sections describe the results of ANOVA, Fisher’s LSD post hoc and Pearson’s correlation tests. 3.1. Torque The parameter was RMS and shows that no statistical differences were found between unteers performed the protocol correctly regarding the sustainability of the 70% MVC torque level from iniSS to finSS. Concerning differences between WLAs, 2.0 s WLA was different from the others in finSS and aftSS. This can be explained in terms of wide torque oscilla- tions during a 2 s segment. As initially expected, RMS response behaved similarly to AbsInt. From the inspec- tion of aftSS data, it is noticeable that mean/standard deviation values increase/decrease. This response is in accordance with what can be seen in Figure 2, once big- ger WLAs encompass a larger part of the ramp down in the torque signal. 3.2. Mechanomyography Regarding the analyses of MMG signals, only moduli data were consider dard deviation of data that sh between either segments or W (†, x) represents data that were different in a comparison between two WLAs. These symbols must be interpreted by looking at a specific segment and parameter (e.g. MPF modulus at finSS). Table 2 indicates that few WLAs presented differences, mainly for µ3 modulus in aftSS. Few differences were observed between large and short WLAs, specifically with MPF and SR in finSS and µ3 in midSS. 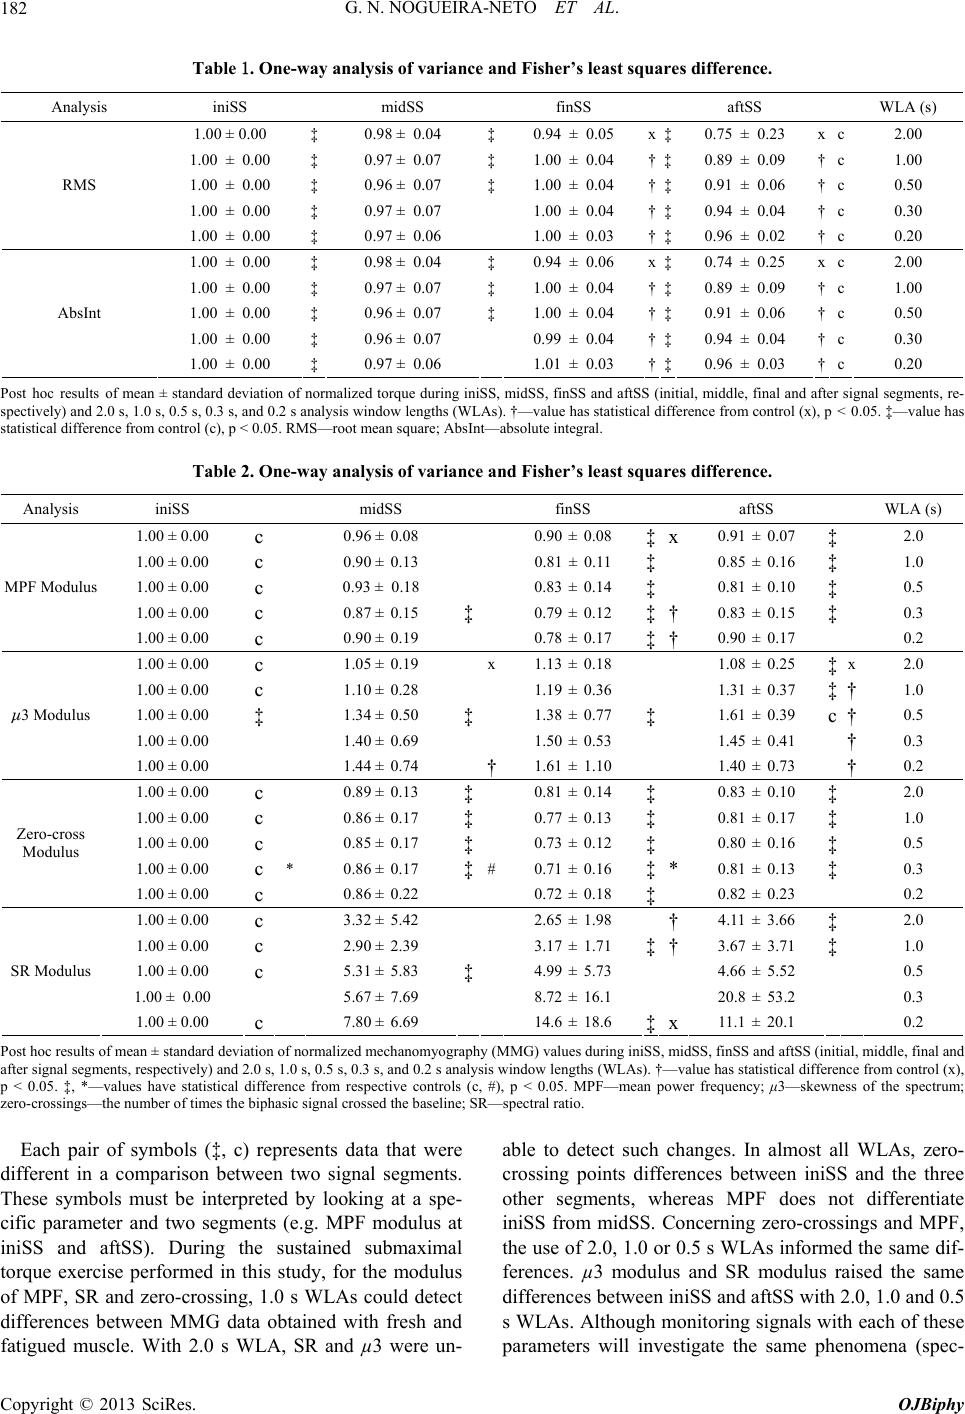 G. N. NOGUEIRA-NETO ET AL. 182 Table 1. One-way analysis of variance Fisher’s leas Analysis iniSS midSS at squares difference. finSS aftSS WLA (s) nd 1.00 ± 0.00 ‡ 0.98 ± 0.04 ‡0.94 ± 0.05 x‡0.75 ± 0.23 x c 2.00 1.00 ± 0.00 ‡ 0.97 ± 0.07 ‡1.00 ± 0.04 †‡0.89 ± 0.09 † c 1.00 1.0 0. 1.0 ‡ 0.906 † 0 ± 0.00 ‡ 96 ± 0.07 ‡0 ± 0.04 †1 ± 0.c 0.50 1.00 ± 0.00 ‡ 0.97 ± 0.07 1.00 ± 0.04 †‡0.94 ± 0.04 † c 0.30 RMS 1.00 ± 0.00 ‡ 0.97 ± 0.06 1.00 ± 0.03 †‡0.96 ± 0.02 † c 0.20 1.00 ± 0.00 ‡ 0.98 ± 0.04 ‡0.94 ± 0.06 x‡0.74 ± 0.25 x c 2.00 1.00 ± 0.00 ‡ 0.97 ± 0.07 ‡ ‡ AbsInt 1.00 ± 0.04 †‡0.89 ± 0.09 † c 1.00 1.00 ± 0.00 ‡ 0.96 ± 0.07 1.00 ± 0.04 †‡0.91 ± 0.06 † c 0.50 1.00 ± 0.00 ‡ 0.96 ± 0.07 0.99 ± 0.04 †‡0.94 ± 0.04 † c 0.30 1.00 ± 0.00 ‡ 0.97 ± 0.06 1.01 ± 0.03 †‡0.96 ± 0.03 † c 0.20 Post hocmean ± staalizeg iniS midftStial,d agnal sets, re- spectively) and 2.0 s, 1.0 s, 0.52 s aysis w(WLAs). †—ticaeren(x0.05. ‡e has statistical difference from cont RMroot bsInt—absol aftSS WLA (s) results of ndard deviation of normd torque durinS,SS, finSS and aS (ini middle, final anfter sigmen s, 0.3 s, and 0.nalindow lengths value has statisl diffce from control ), p < —valu rol (c), p < 0.05.S—mean square; Aute integral. Table 2. One-way analysis of variance and Fisher’s least squares difference. Analysis iniSS midSS finSS 1.00 ± 0.‡ 2.0 00 c 0.96 ± 0.08 0.90 ± 0.08 ‡x0.91 ± 0.07 1.00 ± 0.00 c 0.90 ± 0.13 0.81 ± 0.11 ‡0.85 ± 0.16 ‡ 1.0 1.0 0. 0.8‡0.8 ‡ Ms † x 0 ± 0.00 c 93 ± 0.18 3 ± 0.14 1 ± 0.10 ‡ 0.5 1.00 ± 0.00 c ‡† ‡ PF Modulu 1.00 ± 0.00 c 0.87 ± 0.15 0.79 ± 0.12 0.83 ± 0.15 0.3 ‡ 0.90 ± 0.19 0.78 ± 0.17 0.90 ± 0.17 0.2 1.00 ± 0.00 c ‡ x 1.05 ± 0.19 1.13 ± 0.18 1.08 ± 0.25 2.0 1.00 ± 0.00 c ‡ † 1.10 ± 0.28 1.19 ± 0.36 1.31 ± 0.37 1.0 1.00 ± 0.00 ‡ 1.34 ± 0.50 ‡ μ3 Modulus † ‡c † 1.38 ± 0.77 1.61 ± 0.39 0.5 1.00 ± 0.00 † 1.40 ± 0.69 1.50 ± 0.53 1.45 ± 0.41 0.3 1.00 ± 0.00 † 1.44 ± 0.74 1.61 ± 1.10 1.40 ± 0.73 0.2 1.00 ± 0.00 c 0.89 ± 0.13 ‡ ‡ ‡ 0.81 ± 0.14 0.83 ± 0.10 2.0 1.00 ± 0.00 c 0.86 ± 0.17 ‡ ‡ ‡ ‡ #* Zero-cross Modulus ‡ 0.77 ± 0.13 0.81 ± 0.17 1.0 1.00 ± 0.00 c ‡ 0.85 ± 0.17 0.73 ± 0.12 0.80 ± 0.16 0.5 1.00 ± 0.00 c * 0.86 ± 0.17 ‡‡‡ 0.71 ± 0.16 0.81 ± 0.13 0.3 1.00 ± 0.00 c ‡ 0.86 ± 0.22 0.72 ± 0.18 0.82 ± 0.23 0.2 1.00 ± 0.00 c †‡ 3.32 ± 5.42 2.65 ± 1.98 4.11 ± 3.66 2.0 1.00 ± 0.00 c ‡† ‡ 2.90 ± 2.39 3.17 ± 1.71 3.67 ± 3.71 1.0 1.00 ± 0.00 c 5.31 ± 5.83 ‡ SR Modulus 4.99 ± 5.73 4.66 ± 5.52 0.5 1.00 ± 0.00 5.67 ± 7.69 8.72 ± 16.1 20.8 ± 53.2 0.3 1.00 ± 0.00 c ‡x 7.80 ± 6.69 14.6 ± 18.6 11.1 ± 20.1 0.2 Pmeviaormaliyogray (MMG iniSS, midSS, (inamiddlel and after signal segments,nd 2. 1.s, 0.5 nalysis windAs). †—value iffe from cl (x), p < 0.05. ‡, *—valuical dree froms (c, #), p <eaer frekewtrum; zero-crossings—the ns the biphas signal seline; SR—spec hese symbols must be interpreted by looking at a spe- ci ints differences between iniSS and the three other segments, whereas MPF does not differentiate ost hoc results of an ± standard detion of nzed mechanomph) values duringfinSS and aftSSitil, , fina respectively) a0 s,0 s, 0.3 s, and 0.2 s aow lengths (WLhas statistical drenceontro quency; μ3—ses have statist umber of time iffe nc ic respective control crossed the ba 0.05. MPF—m tral ratio. n powness of the spec Each pair of symbols (‡, c) represents data that were different in a comparison between two signal segments. able to detect such changes. In almost all WLAs, zero- crossing po T fic parameter and two segments (e.g. MPF modulus at iniSS and aftSS). During the sustained submaximal torque exercise performed in this study, for the modulus of MPF, SR and zero-crossing, 1.0 s WLAs could detect differences between MMG data obtained with fresh and fatigued muscle. With 2.0 s WLA, SR and µ3 were un- iniSS from midSS. Concerning zero-crossings and MPF, the use of 2.0, 1.0 or 0.5 s WLAs informed the same dif- ferences. µ3 modulus and SR modulus raised the same differences between iniSS and aftSS with 2.0, 1.0 and 0.5 s WLAs. Although monitoring signals with each of these parameters will investigate the same phenomena (spec- Copyright © 2013 SciRes. OJBiphy 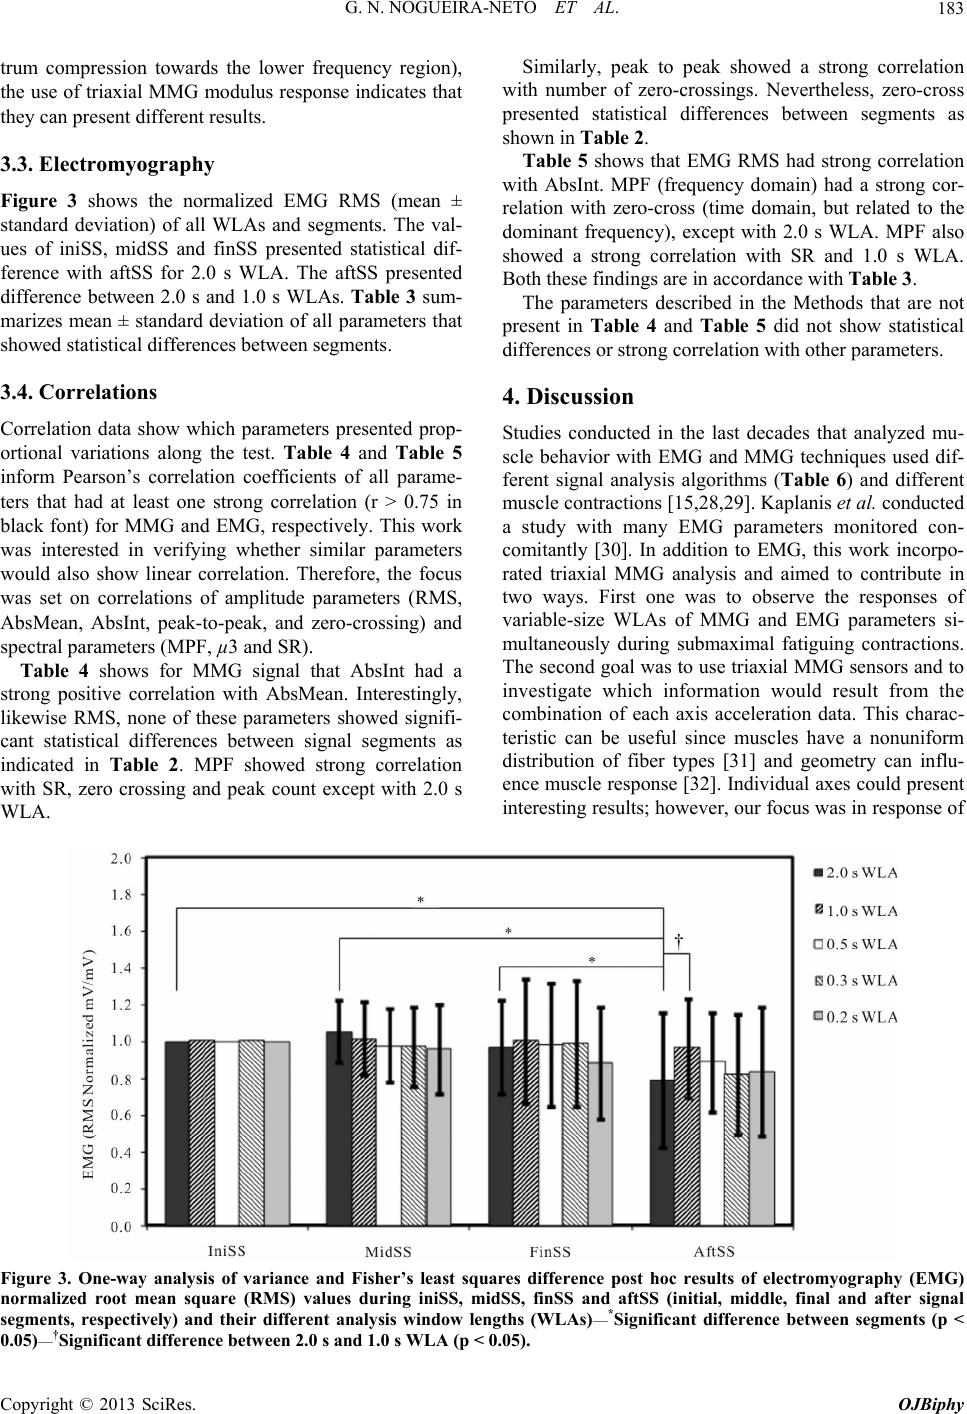 G. N. NOGUEIRA-NETO ET AL. 183 trum compression towards the lower frequency region), the use of triaxial MMG modulus response indicates that they can present different results. 3.3. Electromyography Figure 3 shows the normalized EMG RMS (mean ± standard deviation) of all WLAs and segments. The val- ues of iniSS, midSS and finSS presented statistical dif- ference with aftSS for 2.0 s WLA. The aftSS presented d 1.0 s WLAs. Table 3 sum- viation of all parameters that 0.75 in and EMG, respectively. This work rifying whether similar parameters except with 2.0 s d statistical differences between segments as sh ross (time domain, but related to the do s. - EMG and MMG techniques used dif- ysis algorithms (Table 6) and different difference between 2.0 s an marizes mean ± standard de showed statistical differences between segments. 3.4. Correlations Correlation data show which parameters presented prop- ortional variations along the test. Table 4 and Table 5 inform Pearson’s correlation coefficients of all parame- ters that had at least one strong correlation (r > black font) for MMG was interested in ve would also show linear correlation. Therefore, the focus was set on correlations of amplitude parameters (RMS, AbsMean, AbsInt, peak-to-peak, and zero-crossing) and spectral parameters (MPF, µ3 and SR). Table 4 shows for MMG signal that AbsInt had a strong positive correlation with AbsMean. Interestingly, likewise RMS, none of these parameters showed signifi- cant statistical differences between signal segments as indicated in Table 2. MPF showed strong correlation with SR, zero crossing and peak count WLA. Similarly, peak to peak showed a strong correlation with number of zero-crossings. Nevertheless, zero-cross presente own in Table 2. Table 5 shows that EMG RMS had strong correlation with AbsInt. MPF (frequency domain) had a strong cor- relation with zero-c minant frequency), except with 2.0 s WLA. MPF also showed a strong correlation with SR and 1.0 s WLA. Both these findings are in accordance with Table 3. The parameters described in the Methods that are not present in Table 4 and Table 5 did not show statistical differences or strong correlation with other parameter 4. Discussion Studies conducted in the last decades that analyzed mu scle behavior with ferent signal anal muscle contractions [15,28,29]. Kaplanis et al. conducted a study with many EMG parameters monitored con- comitantly [30]. In addition to EMG, this work incorpo- rated triaxial MMG analysis and aimed to contribute in two ways. First one was to observe the responses of variable-size WLAs of MMG and EMG parameters si- multaneously during submaximal fatiguing contractions. The second goal was to use triaxial MMG sensors and to investigate which information would result from the combination of each axis acceleration data. This charac- teristic can be useful since muscles have a nonuniform distribution of fiber types [31] and geometry can influ- ence muscle response [32]. Individual axes could present interesting results; however, our focus was in response of Figure 3. One-way analysis of variance and Fisher’s least squares difference post hoc results of electromyography (EMG) normalized root mean square (RMS) values during iniSS, midSS, finSS and aftSS (initial, middle, final and after signal segments, respectively) and their different analysis window lengths (WLAs)—*Significant difference between segments (p < 0.05)—†Significant difference between 2.0 s and 1.0 s WLA (p < 0.05). Copyright © 2013 SciRes. OJBiphy 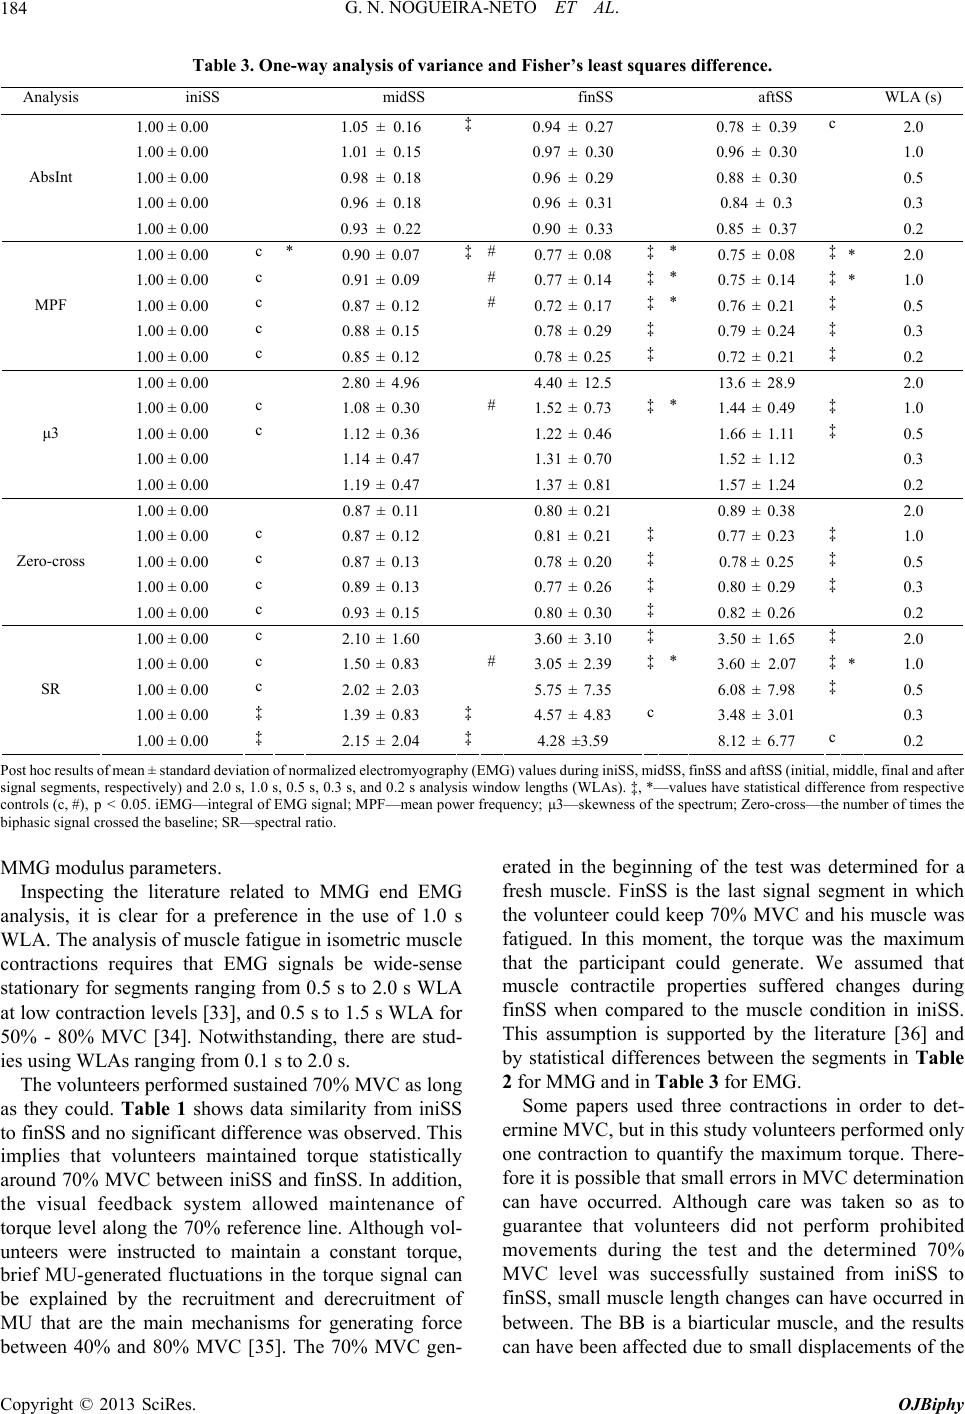 G. N. NOGUEIRA-NETO ET AL. 184 Table 3. One-way analysis of variance and Fisher’s least squares difference. Analysis iniSS midSS finSS aftSS WLA (s) 1.00 ± 0.00 1.05 ± 0.16 ‡0.94 ± 0.27 0.78 ± 0.39 c 2.0 1.00 ± 0.30 1.0 1.00 ± 0.98 0.96 ±0.88 ‡# ‡* 00 1.01 ± 0.15 0.97 ± 0.30 0.96 ± 0. 0.00 ± 0.18 0.29 ± 0.30 0.5 1.00 ± 0.00 AbsInt 1.00 ± 0.00 0.96 ± 0.18 0.96 ± 0.31 0.84 ± 0.3 0.3 0.93 ± 0.22 0.90 ± 0.33 0.85 ± 0.37 0.2 1.00 ± 0.00 c * ‡ * 0.90 ± 0.07 0.77 ± 0.08 0.75 ± 0.08 2.0 1.00 ± 0.00 c 0.91 ± 0.09 #‡* #‡* MPF ‡ * 0.77 ± 0.14 0.75 ± 0.14 1.0 1.00 ± 0.00 c ‡ 0.87 ± 0.12 0.72 ± 0.17 0.76 ± 0.21 0.5 1.00 ± 0.00 c ‡‡ 0.88 ± 0.15 0.78 ± 0.29 0.79 ± 0.24 0.3 1.00 ± 0.00 c ‡‡ 0.85 ± 0.12 0.78 ± 0.25 0.72 ± 0.21 0.2 1.00 ± 0.00 2.80 ± 4.96 4.40 ± 12.5 13.6 ± 28.9 2.0 1.00 ± 0.00 c 1.08 ± 0.30 #* μ3 ‡‡ 1.52 ± 0.73 1.44 ± 0.49 1.0 1.00 ± 0.00 c ‡ 1.12 ± 0.36 1.22 ± 0.46 1.66 ± 1.11 0.5 1.00 ± 0.00 1.14 ± 0.47 1.31 ± 0.70 1.52 ± 1.12 0.3 1.00 ± 0.00 1.19 ± 0.47 1.37 ± 0.81 1.57 ± 1.24 0.2 1.00 ± 0.00 0.87 ± 0.11 0.80 ± 0.21 0.89 ± 0.38 2.0 1.00 ± 0.00 c 0.87 ± 0.12 0.81 ± 0.21 ‡ ‡ ‡ Zero-cross ‡ 0.77 ± 0.23 1.0 1.00 ± 0.00 c ‡ 0.87 ± 0.13 0.78 ± 0.20 0.78 ± 0.25 0.5 1.00 ± 0.00 c ‡ 0.89 ± 0.13 0.77 ± 0.26 0.80 ± 0.29 0.3 1.00 ± 0.00 c ‡ 0.93 ± 0.15 0.80 ± 0.30 0.82 ± 0.26 0.2 1.00 ± 0.00 c ‡‡ 2.10 ± 1.60 3.60 ± 3.10 3.50 ± 1.65 2.0 1.00 ± 0.00 c 1.50 ± 0.83 #* ‡ SR ‡ ‡‡ * 3.05 ± 2.39 3.60 ± 2.07 1.0 1.00 ± 0.00 c ‡ 2.02 ± 2.03 5.75 ± 7.35 6.08 ± 7.98 0.5 1.00 ± 0.00 ‡ c 1.39 ± 0.83 4.57 ± 4.83 3.48 ± 3.01 0.3 1.00 ± 0.00 ‡ c 2.15 ± 2.04 4.28 ±3.59 8.12 ± 6.77 0.2 Post hlts of meviatofrmalizraphy (EMG) va midSS, finStiaile, fina after signal sents, respe.0 s, s, 5 s, 0.3alysindow le ‡,lues hiff fromive controls (c, #), p < 0.tegraE signa powquencss of the spectr—thber os the biphasic signal crosse SR—l ratio. e use of 1.0 s e fatigue in isometric muscle the volunteer could keep 70% MVC and his muscle was oc resu gme an ± standard deion noed electromyoglues during iniSS,S and aftSS (inil, m ddl and ctively) and 2 05. iEMG—in 1.0 l of 0. MG s, and 0.2 s an l; MPF—mean is w er fre ngths (WLAs). y; μ3—skewne *—vaave statistical d um; Zero-cross eren e num ce respect f time d the baseline;spectra MMG modulus parameters. Inspecting the literature related to MMG end EMG analysis, it is clear for a preference in th erated in the beginning of the test was determined for a fresh muscle. FinSS is the last signal segment in which WLA. The analysis of muscl contractions requires that EMG signals be wide-sense stationary for segments ranging from 0.5 s to 2.0 s WLA at low contraction levels [33], and 0.5 s to 1.5 s WLA for 50% - 80% MVC [34]. Notwithstanding, there are stud- ies using WLAs ranging from 0.1 s to 2.0 s. The volunteers performed sustained 70% MVC as long as they could. Table 1 shows data similarity from iniSS to finSS and no significant difference was observed. This implies that volunteers maintained torque statistically around 70% MVC between iniSS and finSS. In addition, the visual feedback system allowed maintenance of torque level along the 70% reference line. Although vol- unteers were instructed to maintain a constant torque, brief MU-generated fluctuations in the torque signal can be explained by the recruitment and derecruitment of MU that are the main mechanisms for generating force between 40% and 80% MVC [35]. The 70% MVC gen- fatigued. In this moment, the torque was the maximum that the participant could generate. We assumed that muscle contractile properties suffered changes during finSS when compared to the muscle condition in iniSS. This assumption is supported by the literature [36] and by statistical differences between the segments in Table 2 for MMG and in Table 3 for EMG. Some papers used three contractions in order to det- ermine MVC, but in this study volunteers performed only one contraction to quantify the maximum torque. There- fore it is possible that small errors in MVC determination can have occurred. Although care was taken so as to guarantee that volunteers did not perform prohibited movements during the test and the determined 70% MVC level was successfully sustained from iniSS to finSS, small muscle length changes can have occurred in between. The BB is a biarticular muscle, and the results can have been affected due to small displacements of the Copyright © 2013 SciRes. OJBiphy 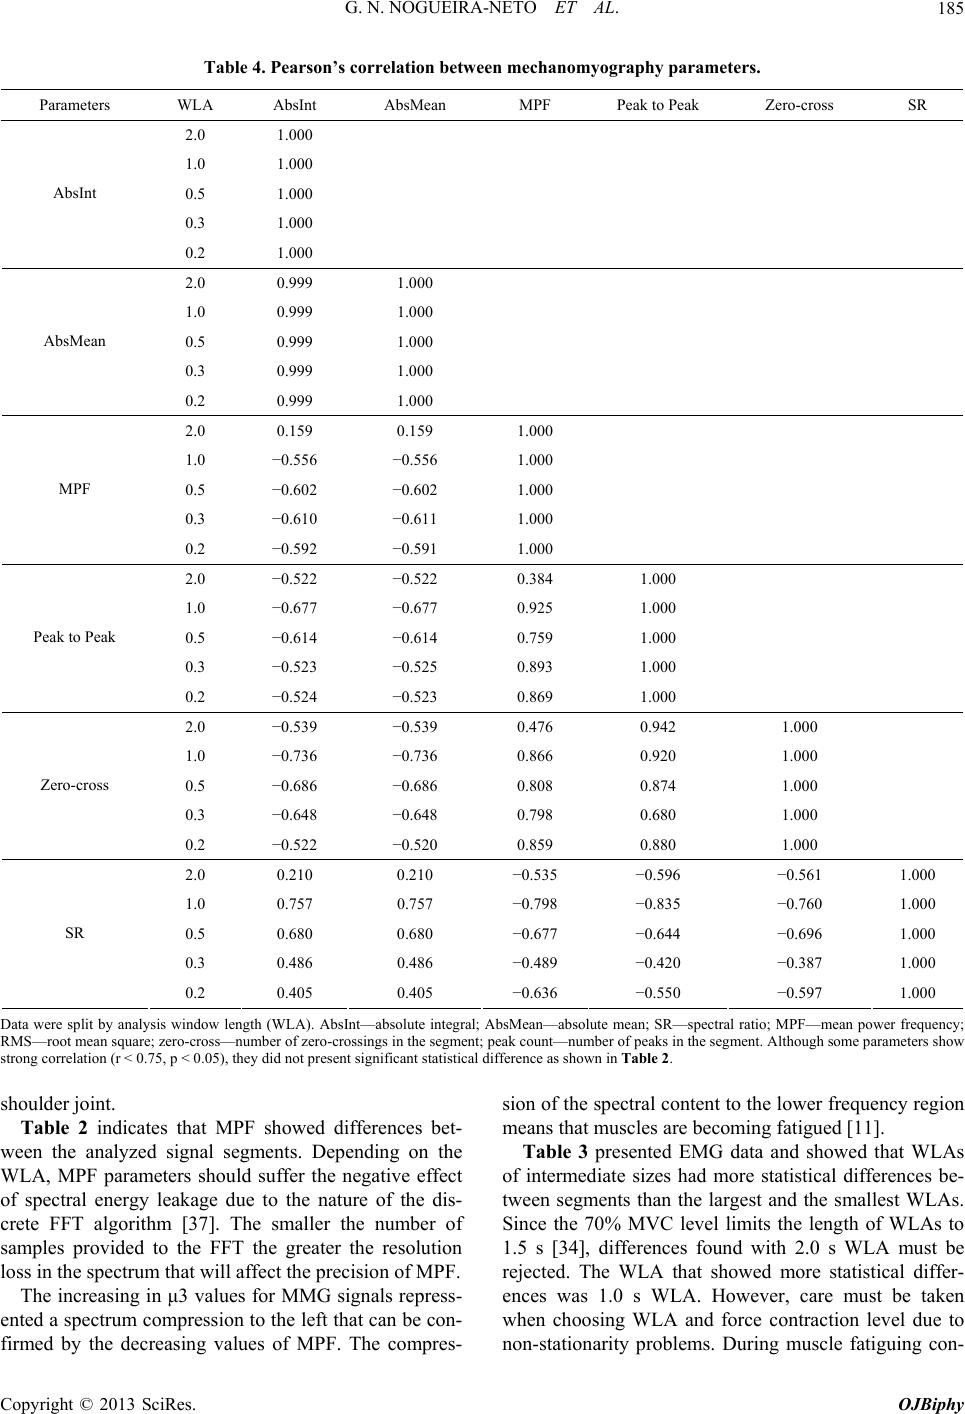 G. N. NOGUEIRA-NETO ET AL. 185 Table 4. Pearson’s correlation betw mechanomyography parameters. Parameters WLA AbsInt AbsMean MPF Peak to Peak Zero-cross SR een 2.0 1.000 1.0 1.000 0. AbsInt 1. 5 1.000 0.3 1.000 0.2 1.000 2.0 0.999 000 1.0 0.999 1. 1. 1. AbsMean 1. 000 0.5 0.999 000 0.3 0.999 000 0.2 0.999 1.000 2.0 0.159 0.159 000 1.0 −0.556 −0.556 1. 1. 1. MPF 1. 000 0.5 −0.602 −0.602 000 0.3 −0.610 −0.611 000 0.2 −0.592 −0.591 1.000 2.0 −0.522 −0.522 0.384 000 1.0 −0.677 −0.677 0.925 1. 1. 1. Peak to Peak 1. 000 0.5 −0.614 −0.614 0.759 000 0.3 −0.523 −0.525 0.893 000 0.2 −0.524 −0.523 0.869 1.000 2.0 −0.539 −0.539 0.476 0.942 000 1.0 −0.736 −0.736 0.866 0.920 1. 1. 1. Zero-cross 1. 000 0.5 −0.686 −0.686 0.808 0.874 000 0.3 −0.648 −0.648 0.798 0.680 000 0.2 −0.522 −0.520 0.859 0.880 1.000 2.0 0.210 0.210 −0.535 −0.596 −0.561 000 1.0 0.757 0.757 −0.798 −0.835 −0.760 1. 1. 1. SR 000 0.5 0.680 0.680 −0.677 −0.644 −0.696 000 0.3 0.486 0.486 −0.489 −0.420 −0.387 000 0.2 0.405 0.405 −0.636 −0.550 −0.597 1.000 Data were split by analysis w length (WLA). AbsInt—abtegral; Absute mespectral ratio; ean powercy; RMS—rooan square; zeronumbeo-crossings igment; peanumber of the segment. Aome paramow strong coron (r < 0.75, p ), they desent signifiical diffen in Ta shoulder joint. Table 2 indicates that MPF showed differences bet- f spectral energy leakage due to the nature of the dis- rithm [37]. The smaller the number of sa she specttent to therequencon means that muscles are becoming fatigued [11]. ad more statistical differences be- tween segments than the largest and the smallest WLAs. re indowsolute inMean—absolan; SR—MPF—m frequen t me relati -cross— < 0.05 r of zer id not pr n the se cant statist k count— rence as show peaks in ble 2. lthough seters sh ween the analyzed signal segments. Depending on the WLA, MPF parameters should suffer the negative effect Table 3 presented EMG data and showed that WLAs of intermediate sizes h o crete FFT algo mples provided to the FFT the greater the resolution loss in the spectrum that will affect the precision of MPF. The increasing in μ3 values for MMG signals repress- ented a spectrum compression to the left that can be con- firmed by the decreasing values of MPF. The compres- Since the 70% MVC level limits the length of WLAs to 1.5 s [34], differences found with 2.0 s WLA must be ion of tral con lower fy regi jected. The WLA that showed more statistical differ- ences was 1.0 s WLA. However, care must be taken when choosing WLA and force contraction level due to non-stationarity problems. During muscle fatiguing con- Copyright © 2013 SciRes. OJBiphy 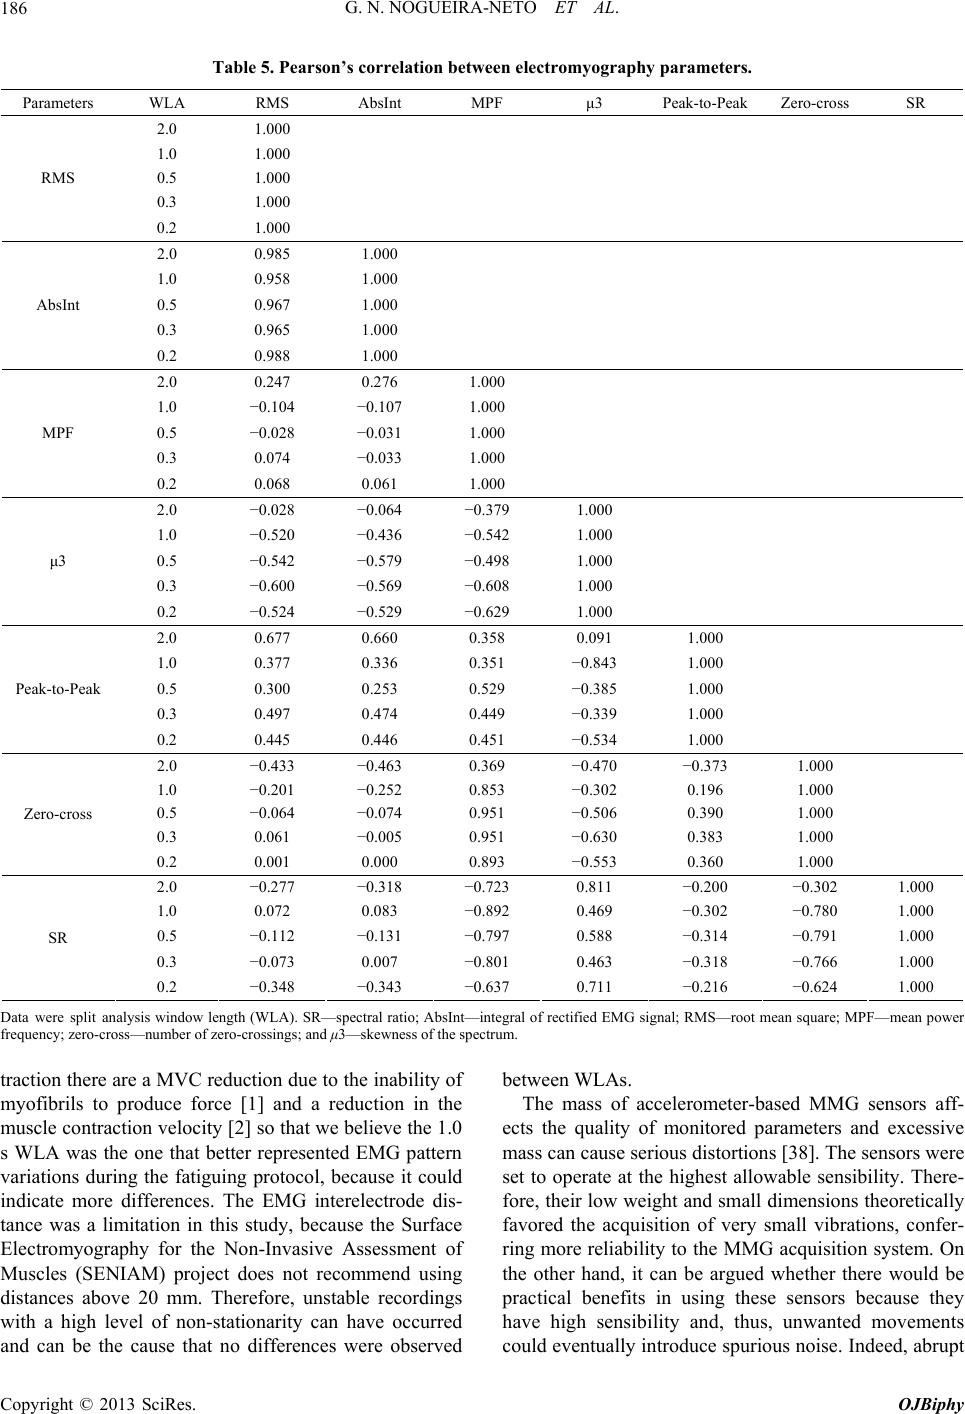 G. N. NOGUEIRA-NETO ET AL. 186 Table 5. Pearson’s correlation betwee PF n electromyography parameters. Parameters WLA RMS AbsInt M μ3 Peak-to-Peak Zero-cross SR 2.0 1.000 1.0 1.000 0.5 1.000 0.3 RMS 0.2 1.000 1.000 2.0 0.985 1.000 1.0 0.958 1. 1. 1. AbsInt 1. 000 0.5 0.967 000 0.3 0.965 000 0.2 0.988 000 2.0 0.247 0.276 1.000 1.0 −0.104 −0.107 1. − −000 −000 1. − 1. 000 0.5 0.028 0.031 1. 0.3 0. 0.2 074 0.068 0.033 1. 0.061 MPF 000 2.0 −0.028 −0.064 0.937000 1.0 −0.520 −0.436 −0.542 1. −000 −000 1. 1. 000 0.5 −0.542 − −0.579 0.498 1. 0.3 0.2 0.600 −0.524 −0.569 −0.529 0.608 1. −0.629 μ3 000 2.0 0.677 0.660 0.358 0.091 000 1.0 0.377 0.336 0.351 −0.843 1. −000 −000 Peak-to-Peak 1. − 1. 000 0.5 0.300 0.253 0.529 0.385 1. 0.3 0.2 0.497 0. 0.445 474 0. 0.446 449 0.451 0.339 1. −0.534 000 2.0 −0.433 −0.463 0.369 −0.470 0.337000 1.0 −0.201 −0.252 0.853 −0.302 0.196 1. 1. 1. Zero-cross 1. −0.2 1. 000 0.5 −0.064 −0.074 0.951 −0.506 0.390 000 0.3 0.061 −0.005 0.951 −0.630 0.383 000 0.2 0.001 0.000 0.893 −0.553 0.360 000 2.0 −0.277 −0.318 −0.723 0.811 −0.200 30000 1.0 0.072 0.083 −0.892 0.469 −0.302 −0.780 1. 1. 1. SR 1. 000 0.5 −0.112 −0.131 −0.797 0.588 −0.314 −0.791 000 0.3 −0.073 0.007 −0.801 0.463 −0.318 −0.766 000 0.2 −0.348 −0.343 −0.637 0.711 −0.216 −0.624 000 Data were split analysis window length (WLA). SR—speAbsInt—il of rectifiel; Rt meaner frequency; zero-cross—nr of zero-cand μ3—s of the tractiere are aC reduce to thf myofibrils to produce force [ a reduin the muscle contractioncity [2we bhe 1.0 dicate more differences. The EMG interelectrode dis- tweens. The mf accelr-based MMG senff- ts the y of md paraand eve to operate at the highest allowable sensibility. There- fore, their low weight and small dimensions theoretically ctral ratio; skewnes ntegra spectrum. d EMG signaMS—roo square; MPF—mean pow umberossings; on th MVtion due inability o be 1] andction velo] so that elieve t ec s WLA was the one that better represented EMG pattern variations during the fatiguing protocol, because it could mass can cause serious distortions [38]. The sensors were set in tance was a limitation in this study, because the Surface Electromyography for the Non-Invasive Assessment of Muscles (SENIAM) project does not recommend using distances above 20 mm. Therefore, unstable recordings with a high level of non-stationarity can have occurred and can be the cause that no differences were observed favored the acquisition of very small vibrations, confer- ring more reliability to the MMG acquisition system. On the other hand, it can be argued whether there would be practical benefits in using these sensors because they have high sensibility and, thus, unwanted movements could eventually introduce spurious noise. Indeed, abrupt WLA ass oerometesors a qualitonitoremeters xcessi Copyright © 2013 SciRes. OJBiphy 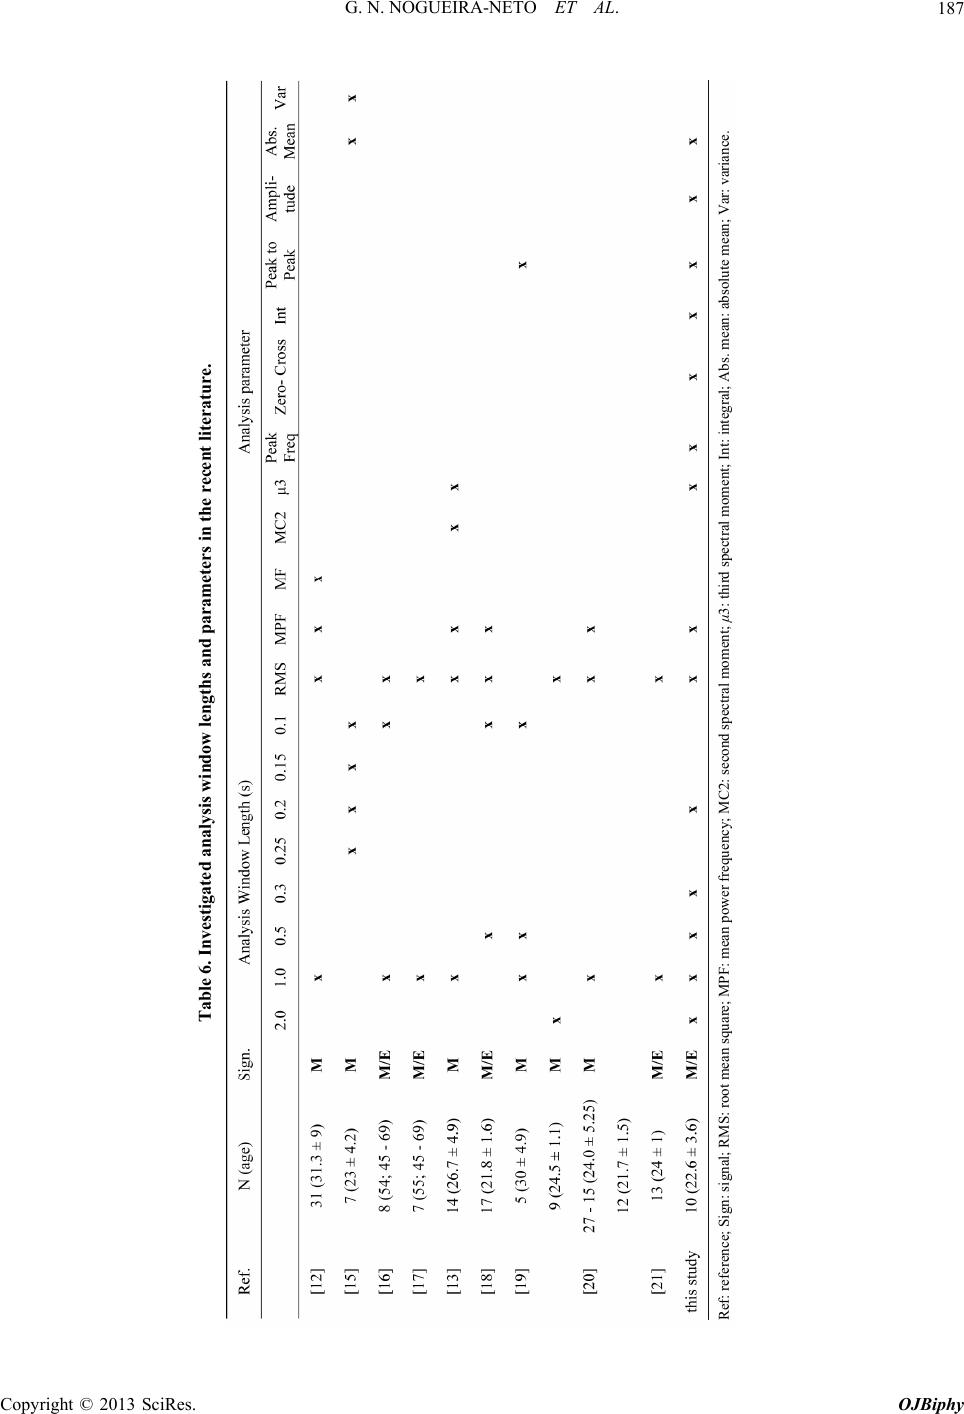 G. N. NOGUEIRA-NETO ET AL. Copyright © 2013 SciRes. OJBiphy 187 Ref: reference; Sign: signal Table 6. Investigated analysis window lengths and parameters in the recent literature. nt; Int: integral; Abs. mean: absolute mean; Var: variance. ; RMS: root mean square; MPF: mean power frequency; MC2: second spectral moment; μ3: third spectral mome  G. N. NOGUEIRA-NETO ET AL. 188 movement artifacts add unwanted noise to the signals and this can be observed even in monoaxial accelerome- ter-based sensors. Triaxial accelerometers register this abrupt noise in all axes; therefore it can be identified and processed. The contractions measured in this investigation were under voluntary control. So, some noise has been ac- cepted due to the activity of other muscles involved in the task in addition to BB. This study investigated many MMG and EMG par- ameters simultaneously during fatiguing isometric con- tractions and can help determine useful parameters for neuroprosthesis control strategies. For example, Table 3 shows that MPF presented more differences than SR and µ3. Zero-crossing analyses identified differences be- tween iniSS and midSS, except for 0.2 s WLA. In neuro- prosthesis control it is important to preview forthcoming losses in torque performance. Zero-crossing and MPF could be used for FES control strategies. In a sustained 70% MVC isometric contraction of the BB, first differ- ences could be observed with zero-crossing. Then, when MPF started showing differences between the computed parameters and iniSS, it could be appropriate to start a new FES profile for avoiding most severe effects caused by muscle fatigue in the muscle performance. Apparently, the larger WLAs presented more differences than the smaller ones giving the impression that they are better for monitoring muscle physiological conditions along time or for FES control. However, large WLAs could raise usability problems for real time strategies because deci- sion making based on events that have occurred more than 1 s before can be impractical or catastrophic. Be- cause of the serious implications, it is recommended that future studies address these problems. The influence of variations in WLA has been studied for EMG and MMG using temporal and spectral para- meters. Regarding MMG, the 1.0 s WLA had the best tradeoff between WLA and the identification of varia- tions in muscle condition along time. Observing more than one parameter simultaneously can be useful for monitoring muscle fatigue, because they can indicate variations in muscle condition that begin to be observed in different segments and following this response pattern can help detect the installation of severe muscle fatigue. In spite of MPF, µ3 and SR be related in meaning, MPF and zero-crossing were able to identify more consistent differences between iniSS and the other segments, in spite of variations in WLA. Therefore, they were consid- ered more useful for monitoring changes in muscle con- dition. Concerning EMG, the conclusion is that for the aftSS the 1.0 s and 2.0 s WLAs have normalized RMS differ- ence. There was strong correlation between different domain parameters (MPF and zero-crossing). A future step is the investigation of the same para- meters and WLAs with different muscles. Because of the amount of data, however, future studies investigating different levels of contraction will concentrate only on few parameters and WLAs. 5. Acknowledgements G. N. N. N., E. M. S., E. K. and P. N. would like to thank CNPq and CAPES for the financial support and grants received. Authors would also like to thank FINEP, SETI, and Fundação Araucária. REFERENCES [1] K. A. Edman and F. Lou, “Myofibrillar Fatigue versus Failure of Activation during Repetitive Stimulation of Frog Muscle Fibres,” Journal of Physiology (London), Vol. 457, 1992, pp. 655-673. [2] N. A. Curtin and K. A. Edman, “Force-Velocity Relation for Frog Muscle Fibres: Effects of Moderate Fatigue and of Intracellular Acidification,” Journal of Physiology (London), Vol. 475, No. 3, 1994, pp. 483-494. [3] A. Adam and C. J. De Luca, “Recruitment Order of Mo- tor Units in Human Vastus Lateralis Muscle is Main- tained during Fatiguing Contractions,” Journal of Neu- rophysiology, Vol. 90, No. 5, 2003, pp. 2919-2927. doi:10.1152/jn.00179.2003 [4] F. V. Brozovich and G. H. Pollack, “Muscle Contraction Generates Discrete Sound Bursts,” Biophysical Journal, Vol. 41, No. 1, 1983, pp. 35-40. doi:10.1016/S0006-3495(83)84403-8 [5] C. Orizio, R. Perini and A. Veicsteinas, “Muscular Sound and Force Relationship during Isometric Contraction in Man,” European Journal of Applied Physiology, Vol. 58, No. 5, 1989, pp. 528-533. doi:10.1007/BF02330708 [6] M. Gobbo, E. Cè, B. Diemont, F. Esposito and C. Orizio, “Torque and Surface Mechanomyogram Parallel Reduc- tion during Fatiguing Stimulation in Human Muscles,” European Journal of Applied Physiology, Vol. 97, No. 1, 2006, pp. 9-15. doi:10.1007/s00421-006-0134-8 [7] C. Orizio, R. Perini and A. Veicsteinas, “Changes of Muscular Sound during Sustained Isometric Contraction up to Exhaustion,” Journal of Applied Physiology, Vol. 66, No. 4, 1989, pp. 1593-1598. [8] K. Søgaard, A. K. Blangsted, L. V. Jørgensen, P. Made- leine and G. Sjøgaard, “Evidence of Long Term Muscle Fatigue Following Prolonged Intermittent Contractions Based on Mechano- and Electromyograms,” Journal of Electromyography and Kinesiology, Vol. 13, No. 5, 2003, pp. 441-450. doi:10.1016/S1050-6411(03)00075-0 [9] P. Madeleine, P. Bajaj, K. Søgaard and L. Arendt-Niel- sen, “Mechanomyography and Electromyography Force Relationships during Concentric, Isometric and Eccentric contractiOns,” Journal of Electromyography and Kinesi- ology, Vol. 11, No. 2, 2001, pp. 113-121. doi:10.1016/S1050-6411(00)00044-4 [10] T. Kimura, T. Hamada, M. Ueno and T. Moritani, L. Copyright © 2013 SciRes. OJBiphy  G. N. NOGUEIRA-NETO ET AL. 189 “Changes in Contractile Properties and Neuromuscular Propagation Evaluated by Simultaneous Mechanomy- ogram and Electromyogram during Experimentally In- duced Hypothermia,” Journal of Electromyography and Kinesiology, Vol. 13, No. 5, 2003, pp. 433-440. doi:10.1016/S1050-6411(03)00062-2 [11] C. Orizio, R. Perini, B. Diemont and A. Veicsteinas, “Muscle Sound and Electromyogram Spectrum Analysis during Exhausting Contractions in Man,” European Jour- nal of Applied Physiology, Vol. 65, No. 1, 1992, pp. 1-7. doi:10.1007/BF01466266 [12] E. Al-Zahrani, C. Gunasekaran, M. Callaghan, P. Gaydecki, D. Benitez and J. Oldham, “Within-Day and Between- Days Reliability of Quadriceps Isometric Muscle Fatigue Using Mechanomyography on Healthy Subjects,” Journal of Electromyography and Kinesiology, Vol. 19, No. 4, 2008, pp. 695-703. doi:10.1016/j.jelekin.2007.12.007 [13] P. Madeleine, H.-Y. Ge, A. Jaskólska, D. Farina, A. Jaskólski and L. Arendt-Nielsen, “Spectral Moments of Mechanomyographic Signals Recorded with Acceler- ometer and Microphone during Sustained Fatiguing Con- tractions,” Medical & Biological Engineering & Com- puting, Vol. 44, No. 4, 2006, pp. 290-297. doi:10.1007/s11517-006-0036-2 [14] T. Kesar, L.-W. Chou and S. A. Binder-Macleod, “Ef- fects of Stimulation Frequency versus Pulse Duration Modulation on Muscle Fatigue,” Journal of Electromyog- raphy and Kinesiology, Vol. 18, No. 4, 2008, pp. 662-671. doi:10.1016/j.jelekin.2007.01.001 [15] N. Alves and T. Chau, “Stationarity Distributions of Me- chanomyogram Signals from Isometric Contractions of Extrinsic Hand Muscles during Functional Grasping,” Journal of Electromyography and Kinesiology, Vol. 18, No. 3, 2008, pp. 509-515. doi:10.1016/j.jelekin.2006.11.010 [16] P. Vedsted, A. Blangsted, K. Søgaard, C. Orizio and G. Sjøgaard, “Muscle Tissue Oxygenation, Pressure, Elec- trical, and Mechanical Responses during Dynamic and Static Voluntary Contractions,” European Journal of Ap- plied Physiology, Vol. 96, No. 2, 2006, pp. 165-177. doi:10.1007/s00421-004-1216-0 [17] K. Søgaard, C. Orizio and G. Søgaard, “Surface Mech- anomyogram Amplitude is not Attenuated by Intramus- cular Pressure,” European Journal of Applied Physiology, Vol. 96, No. 2, 2006, pp. 178-184. doi:10.1007/s00421-004-1211-5 [18] K. T. Ebersole, K. M. O’Connor and A. P. Wier, “Mech- anomyographic and Electromyographic Responses to Re- peated Concentric Muscle Actions of the Quadriceps Femoris,” Journal of Electromyography and Kinesiology, Vol. 16, No. 2, 2006, pp. 149-157. doi:10.1016/j.jelekin.2005.05.005 [19] Y. Yoshitake, Y. Kawakami, H. Kanehisa and T. Fuku- naga, “Surface Mechanomyogram Reflects Length Changes in Fascicles of Human Skeletal Muscles,” International Journal of Sport and Health Science, Vol. 3, Special Is- sue, 2005, pp. 280-285. doi:10.5432/ijshs.3.280 [20] N. Miyamoto and S. Oda, “Effect of Joint Angle on Me- chanomyographic Amplitude during Unfused and Fused Journal of Applied Physiology, Vol. 95, No. 2 Tetani in the Human Biceps Brachii Muscle,” European -3, 2005, pp. 221-228. doi:10.1007/s00421-005-1359-7 [21] T. T. Matta, T. A. Perini, G. L. Oliveira, J. S. Ornellas, A. A. Louzada, J. Magalhães, L. A. Imbiriba and M. A. Gar- cia, “Interpretation of the Mechanisms Related to the Muscular Strength Gradation through Accelerometry,” Brazilian Journal of Sports Medicine, Vol. 11, No. 5, 2005, pp. 306-310. M. Akay, “Enhancement of [22] S. Karlsson, Y. Jun and Spectral Analysis of Myoelectric Signals during Static Contractions Using Wavelet Methods,” IEEE Transac- tions on Biomedical Engineering, Vol. 46, No. 6, 1999, pp. 670-684. doi:10.1109/10.764944 [23] F. B. Stulen and C. J. De Luca, “Muscle Fatigue Monitor: A Noninvasive Device for Observing Localized Muscular Fatigue,” IEEEdical Engineering, Vol. 29, No. 1 Transactions on Biome 2, 1982, pp. 760-768. doi:10.1109/TBME.1982.324871 [24] R. Merletti and L. R. Lo Conte, “Advances in Processing of Surface Myoelectric Signals: Part 1,” Medical & Bio- logical Engineering & Computing, Vol. 33, No. 3, 1995, pp. 362-372. doi:10.1007/BF02510518 [25] D. Farina and R. Merletti, “Comparison of Algorithms for Estimation of EMG Variables during Voluntary Isometric Contractions,” Journal of Electromyography and Kinesi- ology, Vol. 10, No. 5, 2000, pp. 337-349. doi:10.1016/S1050-6411(00)00025-0 [26] T. Zagar and D. Krizaj, “Validation of an Accelerometer for Determination of Muscle Belly Radial Displaceme Medical & Biological Engin nt,” eering & Computing, Vol. 43, No. 1, 2005, pp. 78-84. doi:10.1007/BF02345126 [27] M. A. Vaz, Y. T. Zhang, W. Herzog, A. C. Guimaraes and B. R. MacIntosh, “The Beha and Vastus Lateralis during Fatigue vior of Rectus Femoris and Recovery: An een Electromyographic and Vibromyographic Study,” Elec- tromyography and Clinical Neurophysiology, Vol. 36, No. 4, 1996, pp. 221-230. [28] K. Akataki, K. Mita and Y. Itoh, “Relationship betw Mechanomyogram and Force during Voluntary Contrac- tions Reinvestigated Using Spectral Decomposition,” Eu- ropean Journal of Applied Physiology, Vol. 80, No. 3, 1999, pp. 173-179. doi:10.1007/s004210050578 [29] M. J. Callaghan, C. J. McCarthy and J. A. Oldham, “The Reliability of Surface Electromyography to Assess Quad- riceps Fatigue during Multi Joint Tasks in Healthy and Painful Knees,” Journal of Electromyography and Kine- siology, Vol. 19, No. 1, 2009, pp. 172-180. doi:10.1016/j.jelekin.2007.05.004 [30] P. A. Kaplanis, C. S. Pattichis, L. J. Hadjileontiadis and V. C. Roberts, “Surface EMG Analysis on Normal Subjects Based on Isometric Voluntary Contraction,” Journal of Electromyography and Kinesiology, Vol. 19, No. 1, 2009, pp. 157-171. doi:10.1016/j.jelekin.2007.03.010 [31] M. A. Johnson, J. Polgar, D. Weightman and D. Appleton, “Data on the Distribution of Fibre Types in Thirty-Six Human Muscles An Autopsy Study,” Journal of the Neu- rological Sciences, Vol. 18, No. 1, 1973, pp. 111-129. doi:10.1016/0022-510X(73)90023-3 Copyright © 2013 SciRes. OJBiphy  G. N. NOGUEIRA-NETO ET AL. Copyright © 2013 SciRes. OJBiphy 190 nce of Muscle e, Aponeurosis and [32] C. J. Zuurbier and P. A. Huijing, “Influe Geometry on Shortening Speed of Fibr muscLe,” Journal of Biomechanics, Vol. 25, No. 9, 1992, pp. 1017-1026. doi:10.1016/0021-9290(92)90037-2 [33] D. Zazula, S. Karlsson and C. Doncarli, “Advanced Sig- nal Processing Techniques,” In: R. Merletti and P. Parker, Eds., Electromyography: Physiology, Engineering, and Noninvasive Applications, Wiley-IEEE Press, New Je 2004. rsey, [37] F. J. Harris, “On the Use of Windows for Harmonic Ana- lysis with the Discrete Fourier Transform,” Proceedings of the IEEE, Vol. 66, No. 1, 1978, pp. 51-84. [34] R. Merletti and M. Knaflitz, “Electrically Evoked Myo- electric Signals,” Critical Reviews in Biomedical Engi- neering, Vol. 19, No. 4, 1992, pp. 293-340. [35] C. J. De Luca, R. S. LeFever, M. P. McCue and A. P. Xenakis, “Behaviour of Hu man Motor Units in Different Muscles during Linearly Varying Contractions,” The Jour- nal of Physiology, Vol. 329, 1982, pp. 113-128. [36] B. Bigland-Ritchie, R. Johansson, O. C. Lippold and J. J. Woods, “Contractile Speed and EMG Changes during Fa- tigue of Sustained Maximal Voluntary Contractions,” Jour- nal of Neurophysiology, Vol. 50, No. 1, 1983, pp. 313- 324. doi:10.1109/PROC.1978.10837 [38] M. Watakabe, K. Mita, K. Akataki and K. Ito, “Reliability of the Mechanomyogram Detected with an Accelerometer during Voluntary Contractions,” Medical & Biological Engineering & Computing, Vol. 41, No. 2, 2003, pp. 198- 202. doi:10.1007/BF02344888
|