Paper Menu >>
Journal Menu >>
 International Journal of Geosciences, 2010, 1, 121-129 doi:10.4236/ijg.2010.13016 Published Online November 2010 (http://www.SciRP.org/journal/ijg) Copyright © 2010 SciRes. IJG Kernel Density Estimation of Tropical Cyclone Frequencies in the North Atlantic Basin Timothy A. Joyner, Robert V. Rohli Department of Geography and Anthropology, Louisiana State University, Baton Rouge, USA E-mail: tjoyne1@lsu.edu Received August 31, 2010; revised September 13, 2010; accepted Se pt em ber 30, 2010 Abstract Previous research has identified specific areas of frequent tropical cyclone activity in the North Atlantic ba- sin. This study examines long-term and decadal spatio-temporal patterns of Atlantic tropical cyclone fre- quencies from 1944 to 2009, and analyzes categorical and decadal centroid patterns using kernel density es- timation (KDE) and centrographic statistics. Results corroborate previous research which has suggested that the Bermuda-Azores anticyclone plays an integral role in the direction of tropical cyclone tracks. Other tele- connections such as the North Atlantic Oscillation (NAO) may also have an impact on tropical cyclone tracks, but at a different temporal resolution. Results expand on existing knowledge of the spatial trends of tropical cyclones based on storm category and time through the use of spatial statistics. Overall, location of peak frequency varies by tropical cyclone category, with stronger storms being more concentrated in narrow regions of the southern Caribbean Sea and Gulf of Mexico, while weaker storms occur in a much larger area that encompasses much of the Caribbean Sea, Gulf of Mexico, and Atlantic Ocean off of the east coast of the United States. Additionally, the decadal centroids of tropical cyclone tracks have oscillated over a large area of the Atlantic Ocean for much of recorded history. Data collected since 1944 can be analyzed confidently to reveal these patterns. Keywords: Atlantic Tropical Cyclone Frequencies, Decadal Centroid Patterns, Kernel Density Estimation (KDE), Centrographic Statistics, Bermuda-Azores Anticyclone, Teleconnections 1. Introduction Tropical cyclones are a major environmental hazard for the southeastern United States. Approximately 12 per- cent of the world’s tropical cyclones form in the north Atlantic/Caribbean/Gulf of Mexico basin, with about 23 percent of those striking the U.S.A. [1,2]. As coastal de- velopment continues to increase in the southeastern U.S.A. and elsewhere, it is increasingly important to im- prove our understanding of the spatial patterns and tem- poral trends of tropical cyclone tracks and landfalls to aid environmental planners and risk assessors in minimizing the loss of lives and property. This study has two main objectives: 1) to identify the spatial distribution of North Atlantic basin tropical cy- clones by category based on a kernel density estimation (KDE) approach that utilizes the Fotheringham et al. [3] smoothing algorithm; and 2) to identify th e inter-decadal movement of tropical cyclones through the period of record based on decadal centroids found through the use of centrographic statistics. 2. Background Keim et al. [4] found that the shortest return periods for tropical cyclones occurred in three specific areas of the U.S.A.: the north central Gulf of Mexico coast, the Flor- ida Atlantic coast, and the North Carolina coast around the Outer Banks. This and other research [5,6] suggests that multiple broad-scale controlling mechanisms dictate the spatio-temporal patterns of tropical cyclone tracks and landfalls at intra-seasonal to millennial time scales. While some studies [4,7-9] attribute variability in the spatial pattern of twentieth century return periods along the Gulf-Atlantic coast to the North Atlantic Oscillation (NAO), other research [8-10] suggests that the Ber- muda-Azores high alone plays a stronger role in regulat- ing Atlantic basin tropical cyclone tracks and landfalls at broader time scales. The NAO indirectly affects the spatial patterns of 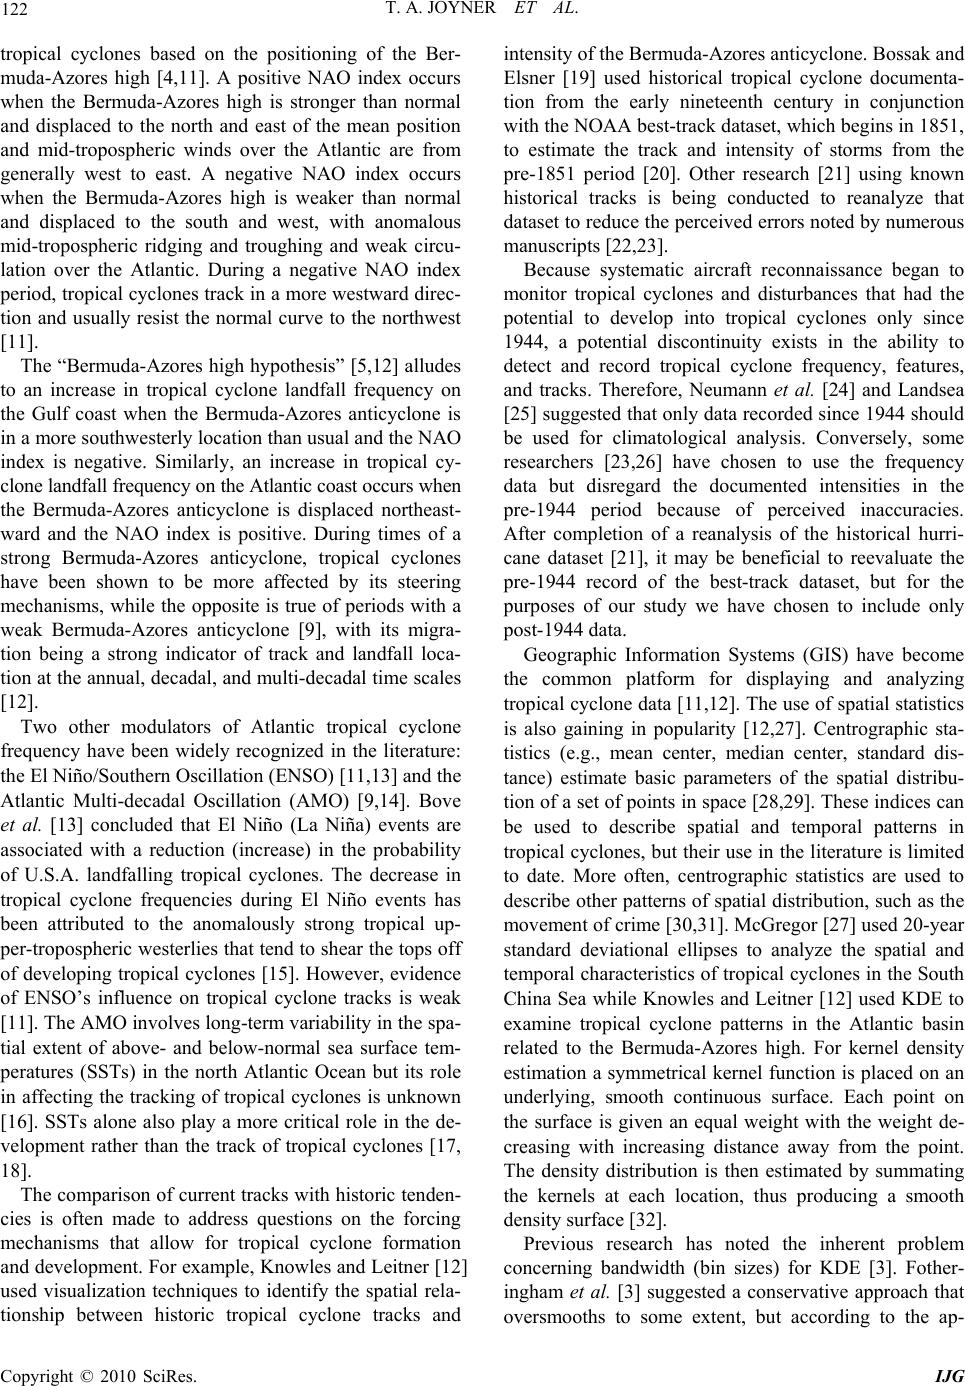 122 T. A. JOYNER ET AL. tropical cyclones based on the positioning of the Ber- muda-Azores high [4,11]. A positive NAO index occurs when the Bermuda-Azores high is stronger than normal and displaced to the north and east of the mean position and mid-tropospheric winds over the Atlantic are from generally west to east. A negative NAO index occurs when the Bermuda-Azores high is weaker than normal and displaced to the south and west, with anomalous mid-tropospheric ridging and troughing and weak circu- lation over the Atlantic. During a negative NAO index period, tropical cyclones track in a more westward direc- tion and usually resist the normal curve to the northwest [11]. The “Bermuda-Azores high hypothesis” [5,12] alludes to an increase in tropical cyclone landfall frequency on the Gulf coast when the Bermuda-Azores anticyclone is in a more southwesterly location than usual and the NAO index is negative. Similarly, an increase in tropical cy- clone landfall frequency on the Atlantic coast occurs when the Bermuda-Azores anticyclone is displaced northeast- ward and the NAO index is positive. During times of a strong Bermuda-Azores anticyclone, tropical cyclones have been shown to be more affected by its steering mechanisms, while the opposite is true of periods with a weak Bermuda-Azores anticyclone [9], with its migra- tion being a strong indicator of track and landfall loca- tion at the annual, decadal, and multi-decadal time scales [12]. Two other modulators of Atlantic tropical cyclone frequency have been widely recognized in the literature: the El Niño/Southern Oscillation (ENSO) [11,1 3] and the Atlantic Multi-decadal Oscillation (AMO) [9,14]. Bove et al. [13] concluded that El Niño (La Niña) events are associated with a reduction (increase) in the probability of U.S.A. landfalling tropical cyclones. The decrease in tropical cyclone frequencies during El Niño events has been attributed to the anomalously strong tropical up- per-tropospheric westerlies that tend to shear the top s off of developing tropical cyclones [15]. However, evidence of ENSO’s influence on tropical cyclone tracks is weak [11]. The AMO involves long-term variability in the spa- tial extent of above- and below-normal sea surface tem- peratures (SSTs) in the north Atlantic Ocean but its role in affecting the tracking of tropical cyclones is unknown [16]. SSTs alone also play a more critical role in the de- velopment rather than the track of tropical cyclones [17, 18]. The co mparison of cu rrent tracks with historic tenden- cies is often made to address questions on the forcing mechanisms that allow for tropical cyclone formation and development. For example, Knowles and Leitner [12] used visualization techniques to identify the spatial rela- tionship between historic tropical cyclone tracks and intensity of th e Bermuda -Azores anticyclone. Bossak and Elsner [19] used historical tropical cyclone documenta- tion from the early nineteenth century in conjunction with the NOAA best- track dataset, which begins in 1851, to estimate the track and intensity of storms from the pre-1851 period [20]. Other research [21] using known historical tracks is being conducted to reanalyze that dataset to reduce the perceived errors noted by numerous manuscripts [22,23]. Because systematic aircraft reconnaissance began to monitor tropical cyclones and disturbances that had the potential to develop into tropical cyclones only since 1944, a potential discontinuity exists in the ability to detect and record tropical cyclone frequency, features, and tracks. Therefore, Neumann et al. [24] and Landsea [25] suggested that only data recorded since 1944 should be used for climatological analysis. Conversely, some researchers [23,26] have chosen to use the frequency data but disregard the documented intensities in the pre-1944 period because of perceived inaccuracies. After completion of a reanalysis of the historical hurri- cane dataset [21], it may be beneficial to reevaluate the pre-1944 record of the best-track dataset, but for the purposes of our study we have chosen to include only post-1944 data. Geographic Information Systems (GIS) have become the common platform for displaying and analyzing tropical cyclone data [11,12]. Th e use of spatial statistics is also gaining in popularity [12,27]. Centrographic sta- tistics (e.g., mean center, median center, standard dis- tance) estimate basic parameters of the spatial distribu- tion of a set of points in space [28,29]. These indices can be used to describe spatial and temporal patterns in tropical cyclones, but their use in the literature is limited to date. More often, centrographic statistics are used to describe other patterns of spatial distribution, such as the movement of crime [30,31]. McGregor [27] used 20-year standard deviational ellipses to analyze the spatial and temporal characteristics of tropical cyclo nes in the South China Sea while Knowles and Leitner [12] used KDE to examine tropical cyclone patterns in the Atlantic basin related to the Bermuda-Azores high. For kernel density estimation a symmetrical kernel function is placed on an underlying, smooth continuous surface. Each point on the surface is given an equal weight with the weight de- creasing with increasing distance away from the point. The density distribution is then estimated by summating the kernels at each location, thus producing a smooth density surface [32]. Previous research has noted the inherent problem concerning bandwidth (bin sizes) for KDE [3]. Fother- ingham et al. [3] suggested a conservative approach that oversmooths to some extent, but according to the ap- Copyright © 2010 SciRes. IJG  T. A. JOYNER ET AL. 123 proach any maxima observed in the estimated density curves are more likely to be real rather than a product of undersmoothing. Knowles and Leitner [12] showed that KDE, when performed correctly, can be a useful tool for identifying areas of high tropical cyclone intensity and that KDE output is easily interpreted. 3. Data and Methods 3.1. Tropical Cyclone Data A spatial database was created based on tropical cyclone position records from 1851-2009 obtained from the Na- tional Oceanic and Atmospheric Administration (NOAA) Coastal Services Center [33]. The database contains the storm category, latitude, longitude, and wind speed for each six-hour interval that each tropical cyclone existed. From the original database containing records from 1851-2009, a second database was established for this study that excluded all pre-1944 data. Any storm below hurricane strength (following the Saffir-Simpson classi- fication – Table 1) was excluded; thereby minimizing the problems associated with uneven detection capabili- ties over the study period. The dataset presented two different types of shapefiles that could be used for spatial analysis: tropical cyclone tracks (line data) and tropical cyclone 6-hour interval locations (point data). Th e 6-hour interval locations (also recognized as observation points) were selected, so that a slower-moving tropical cyclone would receive a higher density because of the higher number of observation points recorded, and vice versa for a faster-moving sys- tem. This approach is reasonable because the duration of time that the forcing mechanisms favor the tropical cy- clone’s existence is proportional to the representation in the KDE analysis. 3.2. Methods of Spatial Analysis ArcMap 9.2 [34] was used to display tropical cyclone locations, centrographic statistics, and KDEs. Tropical cyclones were separated into five categories (as desig- nated by the Saffir-Simpson scale) using the symbology tool. Centrographic statistics and KDEs were calculated using CrimeStat III [32], but the output was also added to ArcMap for visual display purposes. Table 1. The Saffir Simpson Scale showing the wind speed related to each category of tropical cyclone. Classification Category 1 Category 2Category 3 Category 4Category 5 Wind Speeds (mph) 74-95 96-110 111-130 131-155155+ Wind Speeds (km/h) 119-153 154-177178-209 210-249250+ CrimeStat III was used to calculate the KDE of each category of tropical cyclone from 1944-2009. A square grid surface was created as a reference file for the area to be modeled, with the lower left bounding coordinates at (99.5°W, 7.5°N) and upper right bounding coordinates at (4.25°W, 62.5°N). A normal method of interpolation with a fixed interval bandwidth was selected. The band- width (interval) was created using the following equation described by Fotheringham et al. [3]: hopt = [2/3n]1/4 where hopt is the optimal bandwidth, n is the number of observations (or tropical cyclones), and is the standard distance deviation for each category (found from centro- graphic statistics computed earlier). The interval and area units were set to kilometers and the output units are re- ported in absolute densities. CrimeStat III was also used to compute the centro- graphic statistics, including mean center [30,35], median center [36,37], minimum distance [38,39], and standard deviational ellipse [31,40], for each decade from 1944- 2009. The mean center is the simplest descriptor of dis- tribution and describes the mean of the X and Y coordi- nates [41]. The median center is the intersection between the median of the X and Y coordinates. This creates mul- tiple points where lines intersect and thus produces an area of non-uniqueness in which any part of the area be- tween the lines could be considered the median center [32]. The minimum distance defines the point at which the sum of the distance to all other points in a distribu- tion is minimized [41]. The standard deviational ellipse describes dispersion in two dimensions by finding the standard deviations in the X and Y directions that define an ellipse [28]. The standard deviational ellipse shows where the majority of points exist as well as the direc- tional trend of those points. Standard distance deviation was also computed for each category of hurricane for calculating bandwidth for KDEs. Standard distance de- viation is the standard deviation of the actual distance of each point from the mean center and it provides a single summary statistic in kilometers [32]. 4. Results and Discussion A plot of the longitude and latitude coordinates of all tropical cyclone observation points in the dataset by Saf- fir-Simpson category reveals the more southerly loca- tions of major (Category 3 or greater) tropical cyclones (Figure 1). Major tropical cyclones tend to be located in a narrow part of the Atlantic Ocean east of the Bahamas and slightly north of Puerto Rico, in the Caribbean Sea, and in the central Gulf of Mexico. The KDEs of all tropical cyclones are illustrated in Figure 2(a). While tropical cyclones have struck the Copyright © 2010 SciRes. IJG 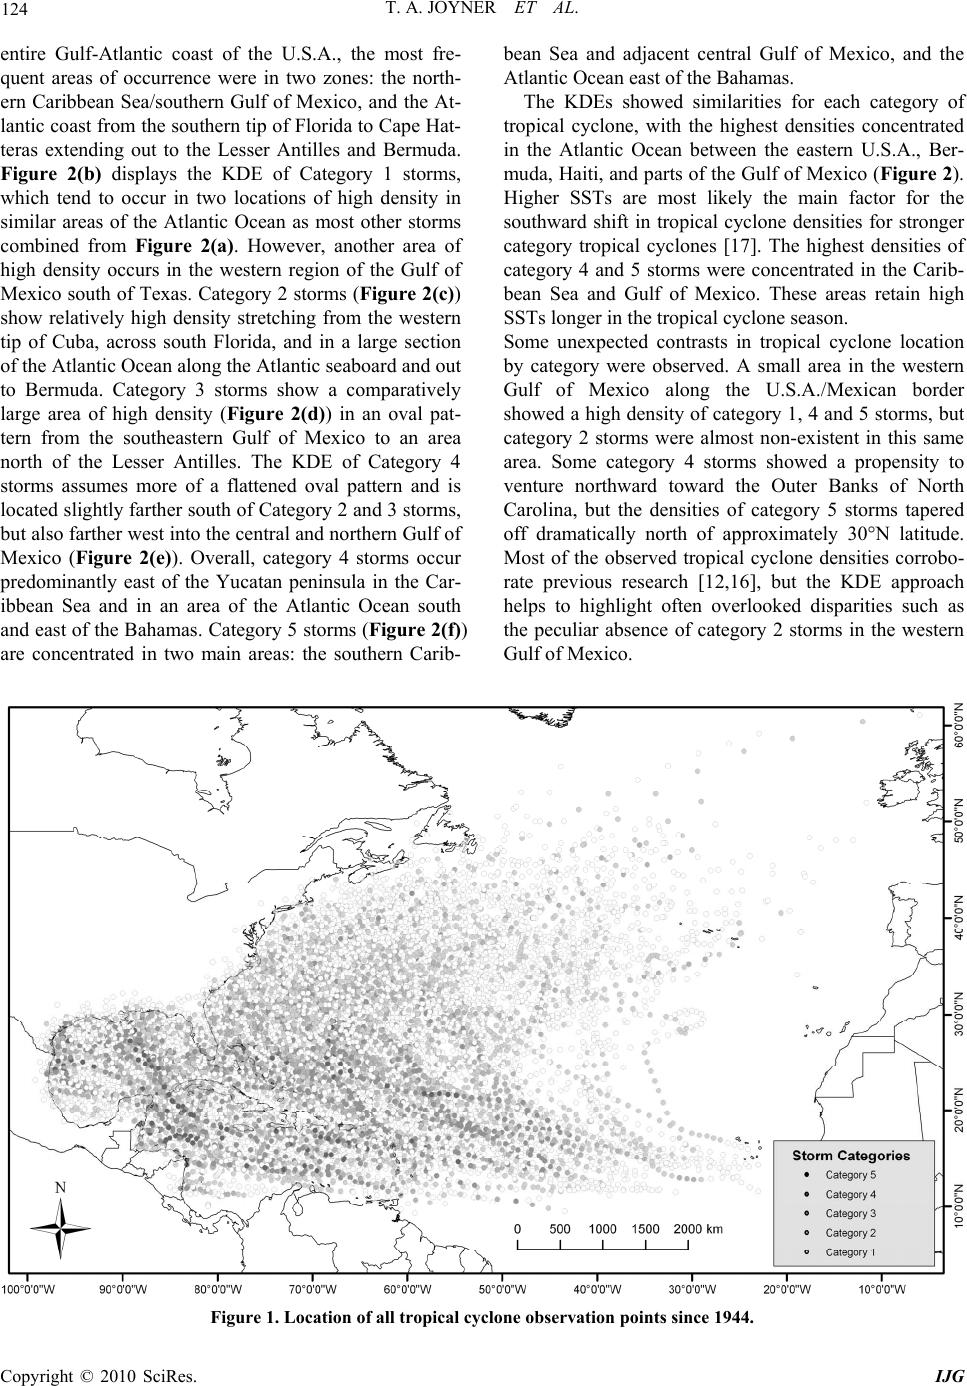 T. A. JOYNER ET AL. Copyright © 2010 SciRes. IJG 124 entire Gulf-Atlantic coast of the U.S.A., the most fre- quent areas of occurrence were in two zones: the north- ern Caribbean Sea/southern Gulf of Mexico, and the At- lantic coast from the sou thern tip of Florida to Cape Hat- teras extending out to the Lesser Antilles and Bermuda. Figure 2(b) displays the KDE of Category 1 storms, which tend to occur in two locations of high density in similar areas of the Atlantic Ocean as most other storms combined from Figure 2(a). However, another area of high density occurs in the western region of the Gulf of Mexico south of Texas. Category 2 storms (Figure 2(c)) show relatively high density stretching from the western tip of Cuba, across south Florida, and in a large section of the Atlantic Ocean along the Atlantic seaboard and out to Bermuda. Category 3 storms show a comparatively large area of high density (Figure 2(d)) in an oval pat- tern from the southeastern Gulf of Mexico to an area north of the Lesser Antilles. The KDE of Category 4 storms assumes more of a flattened oval pattern and is located slightly farther south of Category 2 and 3 storms, but also farther west into the central and northern Gulf of Mexico (Figure 2(e)). Overall, category 4 storms occur predominantly east of the Yucatan peninsula in the Car- ibbean Sea and in an area of the Atlantic Ocean south and east of the Bahamas. Category 5 storms (Figure 2(f)) are concentrated in two main areas: the southern Carib- bean Sea and adjacent central Gulf of Mexico, and the Atlantic Ocean east of the Bahamas. The KDEs showed similarities for each category of tropical cyclone, with the highest densities concentrated in the Atlantic Ocean between the eastern U.S.A., Ber- muda, Haiti, and parts of the Gulf of Mexico (Figure 2). Higher SSTs are most likely the main factor for the southward shift in tropical cyclone densities for stronger category tropical cyclones [17]. The highest densities of category 4 and 5 storms were concentrated in the Carib- bean Sea and Gulf of Mexico. These areas retain high SSTs longer in the tropical cyclone season. Some unexpected contrasts in tropical cyclone location by category were observed. A small area in the western Gulf of Mexico along the U.S.A./Mexican border showed a high density of category 1, 4 and 5 storms, but category 2 storms were almost non-existent in this same area. Some category 4 storms showed a propensity to venture northward toward the Outer Banks of North Carolina, but the densities of category 5 storms tapered off dramatically north of approximately 30°N latitude. Most of the observed tropical cyclone densities corrobo- rate previous research [12,16], but the KDE approach helps to highlight often overlooked disparities such as the peculiar absence of category 2 storms in the western Gulf of Mex i co. Figure 1. Location of all tropical cyclone observation points since 1944.  T. A. JOYNER ET AL. 125 Figure 2. KDE’s of all tropical cyclones (a), category 1 (b), category 2 (c), category 3 (d), category 4 (e), and category 5 (f). The ability to define a bandwidth for the KDE ap- proach aided greatly in accurately identifying density centers for each category of tropical cyclone and the method provided a reasonable measure of comparison across categories. Fotheringham et al. [3] described sev- eral methods of determining bandwidth for kernel den- sity procedures. The chosen formula created an optimum bandwidth that used the standard distance deviation for Copyright © 2010 SciRes. IJG 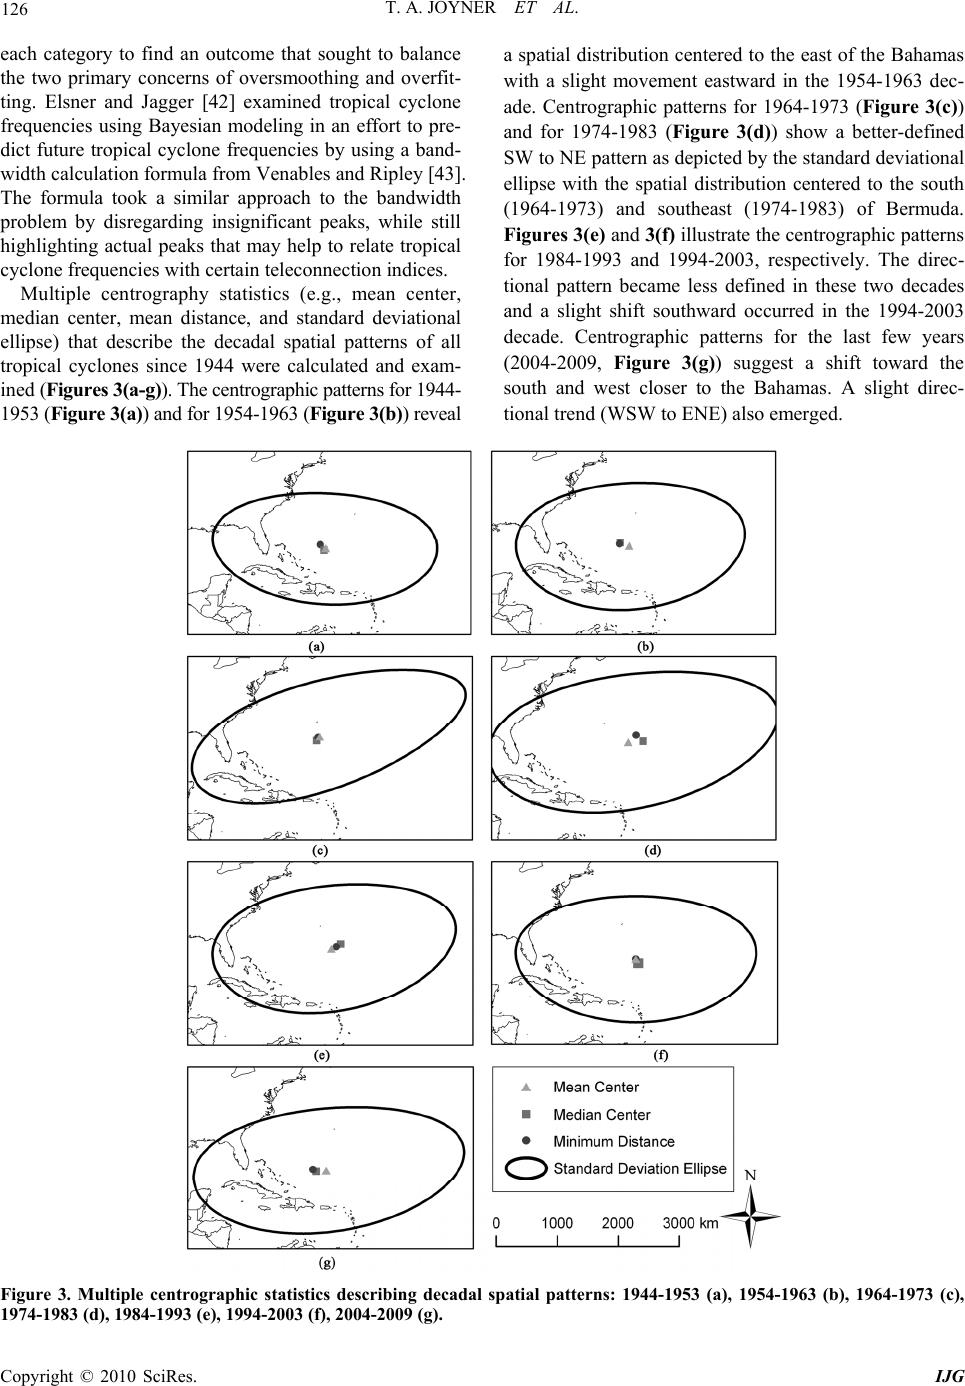 126 T. A. JOYNER ET AL. each category to find an outcome that sought to balance the two primary concerns of oversmoothing and overfit- ting. Elsner and Jagger [42] examined tropical cyclone frequencies using Bayesian modeling in an effort to pre- dict future tropical cyclone frequencies by using a band- width calculation formula from Venables and Ripley [43]. The formula took a similar approach to the bandwidth problem by disregarding insignificant peaks, while still highlighting actual peaks that may help to relate tropical cyclone frequencies with certain teleconnection indices. Multiple centrography statistics (e.g., mean center, median center, mean distance, and standard deviational ellipse) that describe the decadal spatial patterns of all tropical cyclones since 1944 were calculated and exam- ined (Figures 3(a-g)). The centrographic patterns for 1944- 1953 (Figure 3(a)) and for 1954-1963 (Figure 3(b)) reveal a spatial distribution cen tered to the east of the Bahamas with a slight movement eastward in the 1954-1963 dec- ade. Centrographic patterns for 1964-1973 (Figure 3(c)) and for 1974-1983 (Figure 3(d)) show a better-defined SW to NE pattern as depicted by the standard deviational ellipse with the spatial distribution centered to the south (1964-1973) and southeast (1974-1983) of Bermuda. Figures 3(e) and 3(f) illustrate the centrograp hic patterns for 1984-1993 and 1994-2003, respectively. The direc- tional pattern became less defined in these two decades and a slight shift southward occurred in the 1994-2003 decade. Centrographic patterns for the last few years (2004-2009, Figure 3(g)) suggest a shift toward the south and west closer to the Bahamas. A slight direc- tional trend (WSW to ENE) also emerged. Figure 3. Multiple centrographic statistics describing decadal spatial patterns: 1944-1953 (a), 1954-1963 (b), 1964-1973 (c), 1974-1983 (d), 1984-1993 (e), 1994-2003 (f), 2004-2009 (g). Copyright © 2010 SciRes. IJG  T. A. JOYNER ET AL. Copyright © 2010 SciRes. IJG 127 All of the centrographic statistics (mean center, me- dian center, and minimum distance) were concentrated in the same general area for each decade (Figure 3), thus increasing our confidence in analyzing the decadal cen- troid patterns of tropical cyclone tracks. Of the three measures of centrography, the mean center statistic was selected because it calculates the mean distribution, or central tendency, of all X and Y tropical cyclone coordi- nates occurring in each decade and is the most widely used centrographic statistic [30,35,44]. A temporal analysis of decadal mean centers (centroids) of tropical cyclones since the 1940s reveals a trend toward the east until the 1980s, when the pattern shifted back toward a more westward and southward displacement (Figure 4). Previous research has indicated that shifting tropical cyclone patterns are often the result of influential tele- connections – most specifically the NAO and Ber muda-Azores high [9,16]. The temporal trends of decadal centroids are likely representative of the location and strength of the Bermuda-Azores high. It could be in- ferred from Figure 4 that the Bermuda-Azores high, on average, shifted to the east in the 1940s, 1950s, 1960s, and 1970s, but then began to shift back to the west in the 1980s, 1990s, and 2000s. This oscillation trend can also often be seen by examining landfall frequencies over time [4]. More research is needed to examine the precise degree of influence of the Bermuda-Azores high on a seasonal/annual basis. This relationship may be unclear, however, because the frequency of tropical cyclones can be influenced by multiple factors. Further research should explore centroids created from different time pe- riods such as five-year periods or different end points such as ten-year periods that begin in 1949 instead of 1944. Such work may highlight inter-decadal trends and confirm that multi-annual spatial patterns may occur most likely in relationship to NAO and the Bermuda- Azores high [11]. Decadal centroids found in this study seem to contra- dict tropical cyclone landfall patterns identified by Elsner et al. [9], who found that more tropical cyclones made landfall on the Atlantic coast of the U.S.A. in the 1950s, 1980s, and 1990s, while an increased percentage of tropical cyclones made landfall on the Gulf coast of the U.S.A. in the 1960s and 1970s. This seems to suggest that the centroid for 1955-1964 (i.e., 1964 in Figure 4) and for 1965-19 74 (i.e., 1974 in Figure 4) should be the Figure 4. Decadal centroids of all tropical cyclones since 1944 with each labeled year representing the first year of the 10 year period (e.g., 1944 means 1944-1953, etc.). Note: centroid for 2004 only covers 6-year period (2004-2009).  T. A. JOYNER ET AL. Copyright © 2010 SciRes. IJG 128 westernmost centroids instead of two of the easternmost centroids. The contradiction is likely the result of multi- ple factors. The main factor is probably related to the longitude where the tropical cyclones formed each dec- ade [9]. Tropical cyclones that formed in the Caribbean Sea and Gulf of Mexico were probably less affected by the position of the Bermuda-Azores high whereas tropi- cal cyclones that formed in the central and eastern Atlan- tic were probably influenced more by the Bermuda- Azores high. A m ore sout h westerly Berm uda-Azo res hi g h may have also caused Gulf tropical cyclones to curve northward near the beginning of th eir life cycle resulting in a more easterly located decadal centroid. The uncer- tainty implies that more statistical methods must be em- ployed to confirm current spatial trends and hypotheses as well as to identify previously undetected spatial pat- terns. This study may lead to more novel applications of spatial statistics to reveal undiscovered tropical cyclone trends. 5. Summary and Conclusions Through the use of a smoothing bandwidth proposed by Fotheringham et al. [3], kernel d ensity estimation (KDE) identified areas of highest density of occurrence for each category of tropical cyclone in the north Atlantic basin from 1944 through 2009. Results confirmed previous hurricane density assessments, but also found nuances in location of densities for each storm category. Centro- graphic statistics provided a new perspective on multi- year spatial shifts of tropical cyclones, but the results should be examined more thoroughly in future research efforts to fully understand the reason(s) for these shifts. The principal findings of th is study are as follows: 1) The highest tropical cyclone densities occurred in the Atlantic Ocean between the eastern U.S.A., Bermuda, and Haiti and parts of the Gulf of Mexico with stronger storms (3+) concentrated in the Caribbean Sea, Gulf of Mexico, and southern Atlantic Ocean. 2) An area in the Gulf of Mexico near the U.S.A./ Mexico border exhibited high densities of most storm categories except category 2 storms. 3) The bandwidth calculations proposed by Fother- ingham et al. [3] were useful in highlighting hurricane densities. 4) Centrographic statistics identified decadal move- ments of the center of gravity of hurricane tracks as well as decadal changes in directional dispersion. 6. Acknowledgment The authors would like to thank the reviewers for their excellent editorial suggestions during the review of this manuscript. Dr. Andrew Curtis and Gerardo Boquin were helpful in the design and implementation of this study and Dr. Jason Blackburn assisted in reviewing and mak- ing suggestions for the geo-statistical components. 7. References [1] C. W. Landsea, “Climate Variability of Tropical Cy- Clones: Past, Present and Future,” In: R. A. Pielke and R. A. Pielke, Eds., Storms, Routledge, New York, 2000. [2] R. A. Pielke and C. W. Landsea, “La Niña, El Niño and Atlantic Hurricane Damages in the United States,” Bulle- tin of the American Meteorological Society, Vol. 80, No. 10, 1999, pp. 2027-2033. [3] S. A. Fotheringham, C. Brunsdon and M. Charlton, “Quantitative Geography: Perspectives on Spatial Data Analysis,” Sage, London, 2000. [4] B. D. Keim, R. A. Muller and G. W. Stone, “Spa- tio-Temporal Patterns and Return Periods of Tropical Storm and Hurricane Strikes from Texas to Maine,” Journal of Climate, Vol. 20, No. 14, 2007, pp. 3498- 3509. [5] K.-B. Liu and M. L. Fearn, “Reconstruction of Prehistoric Landfall Frequencies of Catastrophic Hurricanes in Northwestern Florida from Lake Sediment Records,” Quaternary Research, Vol. 54, No. 2, 2000, pp. 238-245. [6] K.-B. Liu, “Paleotempestology: Principles, Methods and Examples from Gulf Coast Lake Sediments,” In: R. J. Murnane and K.-B. Liu, Eds., Hurricanes and Typhoons: Past, Present and Future, Columbia University Press, New York, 2004, pp. 13-57. [7] J. B. Elsner and B. Kocher, “Global Tropical Cyclone Activity: A Link to the North Atlantic Oscillation,” Geo- physical Research Letters, Vol. 27, No. 1, 2000, pp. 129-132. [8] J. W. Hurrell, Y. Kushnir, G. Ottersen and M. Visbeck, “An Overview of the North Atlantic Oscillation,” Geo- physical Monograph, Vol. 134, 2003, pp. 1-35. [9] J. B. Elsner, K.-b. Liu and B. Kocher, “Spatial Variations in Major U.S. Hurricane Activity: Statistics and a Physi- cal Mechanism,” Journal of Climate, Vol. 13, No. 13, 2000, pp. 2293-2305. [10] D. B. Scott, E. S. Collins, P. T. Gayes and E. Wright, “Records of Prehistoric Hurricanes on the South Carolina Coast Based on Micropaleontological and Sedimen- tological Evidence, with Comparison to Other Atlantic Coast Records,” Geological Bulletin of America Bulletin, Vol. 115, No. 9, 2003, pp. 1027-1039. [11] J. B. Elsner, B. H. Bossak and X. F. Niu, “Secular Changes to the ENSO–U.S. Hurricane Relationship,” Geophysical Research Letters, Vol. 28, No. 21, 2001, pp. 4123-4126. [12] J. T. Knowles and M. Leitner, “Visual Representations of the Spatial Relationship between Bermuda High Strengths and Hurricane Tracks,” Cartographic Perspec- tives, Vol. 56, 2007, pp. 16-30. [13] M. V. Bove, J. J. O’Brien, J. B. Elsner, C. W. Landsea, and X. Niu, “Effect of El Niño on US Landfalling Hurri-  T. A. JOYNER ET AL. 129 canes, Revisited,” Bulletin of the American Meteorologi- cal Society, Vol. 79, No. 11, 1998, pp. 2477-2482. [14] J. R. Knight, C. K. Folland and A. A. Scaife, “Climate Impacts of the Atlantic Multidecadal Oscillation,” Geo- physical Research Letters, Vol. 33, No. 17, 2006, p. L17706. [15] R. Saravanan and P. Chang, “Interaction between Tropi- cal Atlantic Variability and El Niño–Southern Oscilla- tion,” Journal of Climate, Vol. 13, 2000, pp. 2177-2194. [16] J. B. Elsner and T. H. Jagger, “Prediction Models for Annual US Hurricane Counts,” Journal of Climate, Vol. 19, No. 12, 2006, pp. 2935-2952. [17] M. DeMaria and J. Kaplan, “Sea Surface Temperature and the Maximum Intensity of Atlantic Tropical Cy- Clones,” Journal of Climate, Vol. 7, No. 9, 1994, pp. 1324-1334. [18] E. Palmen, “On the Formation and Structure of Tropical Cyclones,” Geophysica, Vol. 3, 1948, pp. 26-38. [19] B. H. Bossak and J. B. Elsner, “Plotting Early Nine- teenth-Century Hurricane Information,” EOS, Transac- tions, American Geophysical Union, Vol. 85, No. 20, May 2004, pp. 1-5. [20] B. R. Jarvinen, C. J. Neumann and M. A. S. Davis, “A Tropical Cyclone Data Tape for the North Atlantic Basin, 1886-1983: Contents, Limitations and Uses,” NOAA Tech. Memo. NWS NHC-22, Coral Gables, FL, 1984. [21] C. W. Landsea, C. Anderson, N. Charles, G. Clark, J. Dunion, J. Fernandez-Partagas, P. Hungerford, C. Neu- mann and M. Zimmer, “T he Atlantic Hurricane Database Re-Analysis Project: Documentation for the 1851–1910 Alterations and Additions to the HURDAT Database,” In: R. J. Murnane and K.-B. Liu, Eds., Hurricanes and Ty- phoons: Past, Present and Future, Columbia University Press, New York, 2004, pp. 177-221. [22] C. W. Landsea, R. A. Pielke , A. M. Mestas-Nuñez and J. A. Knaff, “Atlantic Basin Hurricanes: Indices of Climatic Changes,” Climatic Change, Vol. 42, No. 1, 1999. pp. 89- 129. [23] G. J. Holland and P. J. Webster, “Heightened Tropical Cyclone Activity in the North Atlantic: Natural Variabil- ity or Climate Trend?” Philosophical Transactions of the Royal Socie ty, Vol. 365, No. 1860, 2007, pp. 2695-2716. [24] C. J. Neumann, B. R. Jarvinen, C. J. McAdie and J. D. Elms, “Tropical Cyclones of the North Atlantic Ocean, 1871-1992,” Prepared by the National Climatic Data Center, Asheville, NC, in cooperation with the NHC, Coral Gables, FL, 1993, p. 193. [25] C. W. Landsea, “A Climatology of Intense (or Major) Atlantic Hurricanes,” Monthly Weather Review, Vol. 121, No. 6, 1993, pp. 1703-1713. [26] M. Mann and K. Emanuel, “Atlantic Hurricane Trends Linked To Climate Change,” EOS, Transactions, Ameri- can Geophysical Union, Vol. 87, No. 24, 2006, pp. 233-244. [27] G. R. McGregor, “The Tropical Cyclone Hazard over the South China Sea 1970-1989: Annual Spatial and Tempo- ral Characteristics,” Applied Geography, Vol. 15, No. 1, 1995, pp. 35-52. [28] D. Ebdon, “Statistics in Geography,” 2nd Edition, Black- well Publishing, Oxford, 1988. [29] P. H. Furfey, “A Note on Lefever’s ‘Standard Deviational Ellipse’,” American Journal of Sociology, Vol. 33, No. 1, July 1927, pp. 94-98. [30] J. G. Cameron and M. Leitner, “Spatial Analysis Tools for Identifying Hot Spots,” In: Eck, et al. Eds., Mapping Crime: Understanding Hot Spots, National Institute of Justice, Washington, D.C., 2005, pp. 35-63. [31] J. Kent and M. Leitner, “Efficacy of Standard Deviational Ellipses in the Application of Criminal Geographic Pro- filing,” Journal of Investigative Psychology and Offender Profiling, Vol. 4, No. 3, 2007, pp. 147-165. [32] N. Levine, “CrimeStat: A Spatial Statistics Program for the Analysis of Crime Incident Locations (v 3.0),” Ned Levine & Associates, Houston, TX and The National In- stitute of Justice, Washington, DC, 2004. [33] National Oceanic and Atmospheric Administration, NOAA Coastal Services Center, 2010. http://csc-s-maps-q.csc. noaa.gov/hurricanes/download.js [34] Environmental Systems Research Institute (ESRI), Ar- cGIS (v 9.2), Redlands, CA, 2006. [35] M. Pereira and D. Figueiredo, “Affects of the Alquelva dam Reservoir on the Distribution of Steppe Birds,” Physical Geography, Vol. 30, No. 1, 2009, pp. 43-63. [36] C. Marven, R. Canessa and P. Keller, “Exploratory Spa- tial Data Analysis to Support Maritime Search and Res- cue Planning,” Geomatics Solutions for Disaster Man- agement, 2007, doi: 10.1007/978-3-540-72108-6_18. [37] B. Snook, M. Zito, C. Bennell and P. J. Taylor, “On the Complexity and Accuracy of Geographic Profiling Strate- gies,” Journal of Quantitative Criminology, Vol. 21, No. 1, 2005, pp. 1-26. [38] D. Paulson, “Human versus Machine: A Comparison of the Accuracy of Geographic Profiling Methods,” Journal of Investigative Psychology and Offender Profiling, Vol. 3, No. 2, 2006, pp. 77-89. [39] D. K. Rossmo, “Geographic Profiling,” CRC Press, Flor- ida, 2000. [40] A. Mamuse, A. Porwal, O. Kreuzer and S. Beresford, “A New Method for Spatial Centrographic Analysis of Min- eral Deposit Clusters,” Ore Geology Reviews, Vol. 36, No. 4, 2009, pp. 293-305. [41] J. E. Burt and G. M. Barber, “Elementary Statistics for Geographers,” Guilford Press, New York, 1996. [42] J. B. Elsner and T. H. Jagger, “A Hierarchical Bayesian Approach to Seasonal Hurricane Modeling,” Journal of Climate, Vol. 17, No. 14, 2004, pp. 2813-2827. [43] W. N. Venables and B. D. Ripley, “Modern Applied Statis- tics with S-PLUS,” Springer, New York, 1999, p. 501. [44] M. A. Bishop, “Point Pattern Analysis of Eruption Points for the Mount Gambier Volcanic Sub-Province: A Quan- titative Geographical Approach to the Understanding of Volcano Distribution,” Area, Vol. 39, No. 2, 2007, pp. 230-241. Copyright © 2010 SciRes. IJG |