J. E. FOX, J. LEE
Preece, 1999). However, young children with limited profi-
ciency in formal reading and writing often experience frustra-
tion trying to write in a journal. To sensitively respond to the
needs of young children, additional forms of representation
should be encouraged for recording their observations. For
example, an audio recording of the child’s description of the
observation, a photograph, or a drawing would all provide do-
cumentation of the experience. In this study, researchers util-
ized children’s drawings, the most frequently used representa-
tion tool in early childhood. Drawing is one of concrete and
effective ways for young children attempting to record their
observations (Kepler, 1998; Brooks, 2003).
Some educators might debate the use of drawings as a re-
cording tool of science observations since many children use
drawings to represent their thoughts and emotions instead of
factual observations. Though young children most often engage
in drawing as a creative activity or as a tool to express their
feelings/ideas, Kaatz (2008) claims that even at a young age,
children are able to understand the differences between scien-
tific and creative drawing. Based on her research, children are
easily able to distinguish scientific drawings from creative and
imaginative drawings.
When children are engaged in the drawing process to repre-
sent their observations, their observational and analytical skills
(Jolley, 2010), including spatial visualizations, orientations and
relation (Brooks, 2009), increase. In addition, children’s ability
to describe factual information based on their scientific obser-
vation increases (Fox, 2010). In the current study, a quasi-ex-
perimental model was applied to quantitatively investigate how
effective kindergarten children’s observational drawings were
as they attempted to recall and to describe the information they
observed.
Methods
Research Set ti n g and Partici p ants
This research was conducted in an urban school in a large
metropolitan area in the southwestern United States. Approxi-
mately 97% of the children attending this school qualify for
free and/or reduced-cost lunch. Participants in this study were
42 children enrolled in 8 different kindergarten classes at the
school (27 boys and 15 girls). All of the children were attending
kindergarten for the first time and had turned five years of age
on or before October 1 of the current school year. Regarding
ethnicity, 18 children identified as African-American, 21 as
Latino, one as Asian-American, and two as Anglo.
Data Collection and Analysis
Each child participating in this study conducted two observa-
tions of live animals. The children were randomly divided into
a drawing and a non-drawing group; children from each ability
group were evenly distributed across the drawing and non-
drawing groups. Interviews were conducted by the primary
researcher, an early childhood professor and former kindergar-
ten teacher, who had been volunteering in the kindergarten
classrooms weekly for seven months. Interview questions (see
Appendix) were developed collaboratively by the researchers
and the classroom teachers and were based on the role of ob-
servation in the science curriculum. For their first observation,
individual children were asked to join the researcher at a table
and be a scientist, making “a careful observation” of two zebra
finches in a bird cage. When the children indicated that they
had finished observing, each child in the non-drawing group
was asked a series of questions (Appendix) about what he or
she had seen, while each child in the drawing group was given
a sheet of paper and a set of markers and asked to draw what he
or she had seen. When the child had completed his/her drawing,
the same series of questions was asked by the researcher. For
both groups of children, the birds remained in full view on the
table so that the children could look again as needed. During
the following week, the same process was repeated with a re-
versal of the drawing and non-drawing groups and a different
animal for the children to observe (a box turtle in a terrarium).
An audio recording was made of each child’s responses to
the series of interview questions. The recordings were tran-
scribed each day after the interviews were concluded. The re-
searchers reviewed the transcripts daily and began to identify
patterns and categories in the children’s responses. The tran-
scripts were also reviewed by one of the classroom teachers and
a second early childhood professor to confirm the patterns and
categories identified by the researcher.
In reviewing the interview transcripts, each answer was
quantified using a three-point scale: 0 for an inaccurate or fan-
tasy answer irrelevant to the actual answer, .5 for a partially
accurate answer, and 1 for an accurate answer. Answers were
graded on seven major questions about descriptions of observa-
tion, location, action, color, size, shape, and sound. To compare
the mean score differences on each item between when children
drew and when children didn’t draw, a paired-t test was calcu-
lated.
Results
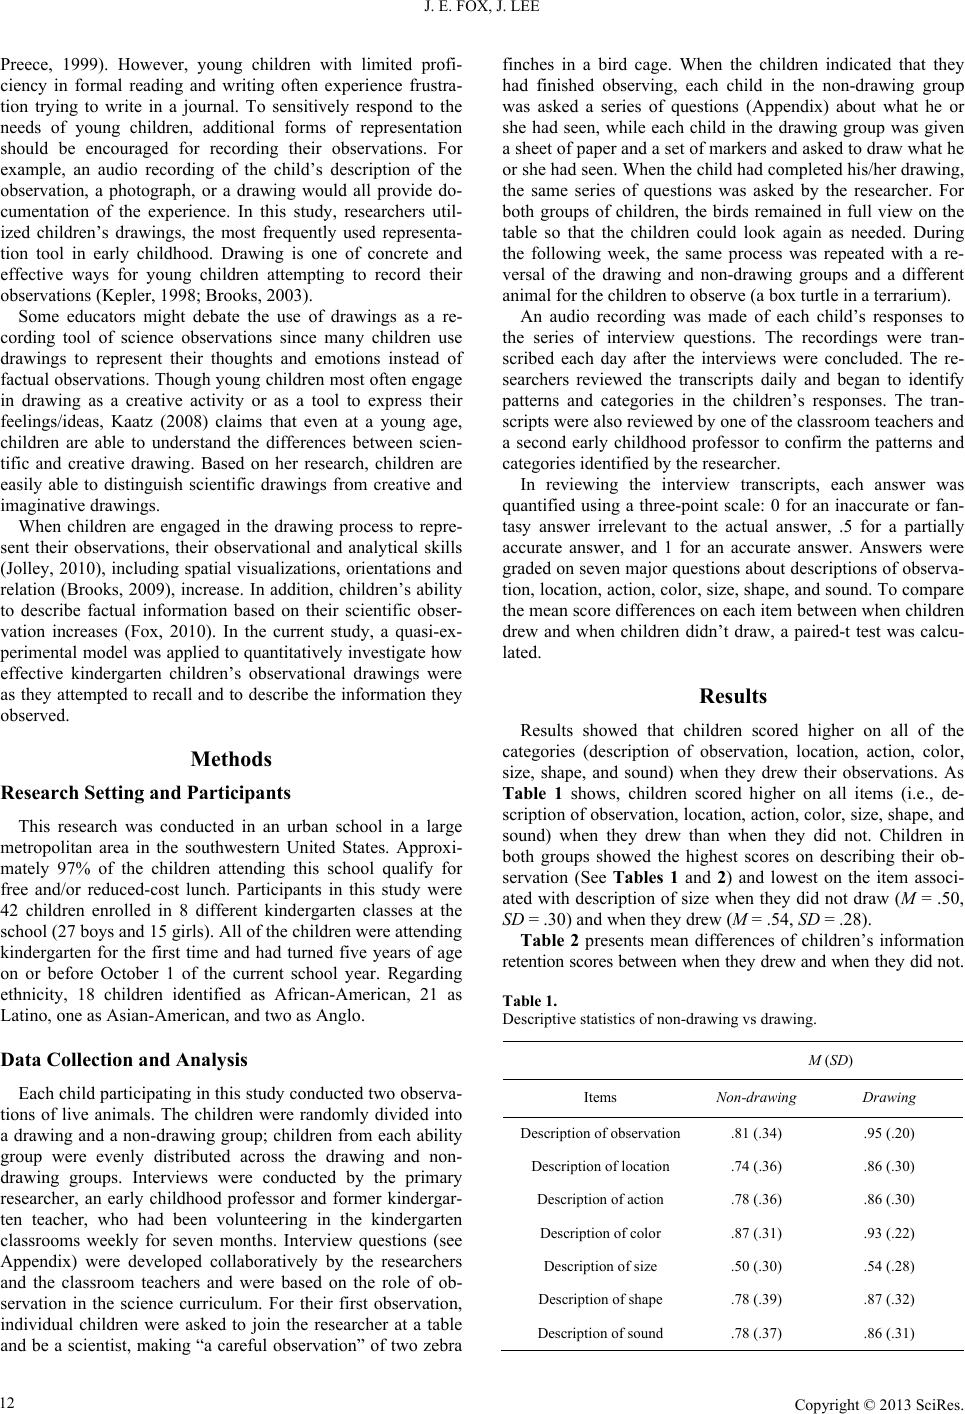
Results showed that children scored higher on all of the
categories (description of observation, location, action, color,
size, shape, and sound) when they drew their observations. As
Table 1 shows, children scored higher on all items (i.e., de-
scription of observation, location, action, color, size, shape, and
sound) when they drew than when they did not. Children in
both groups showed the highest scores on describing their ob-
servation (See Tables 1 and 2) and lowest on the item associ-
ated with description of size when they did not draw (M = .50,
SD = .30) and when they drew (M = .54, SD = .28).
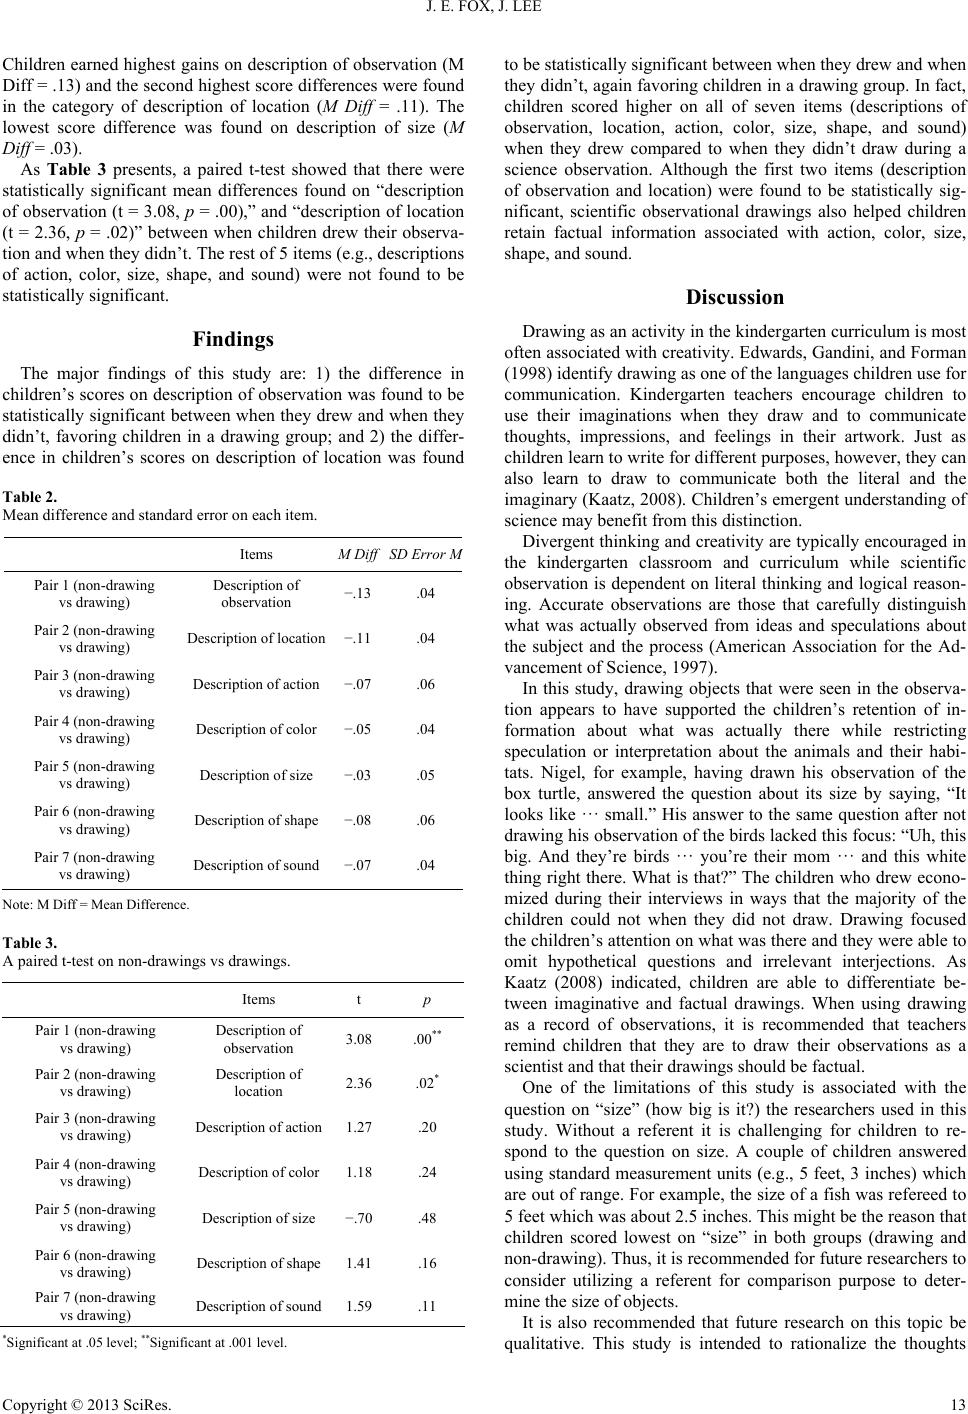
Table 2 presents mean differences of children’s information
retention scores between when they drew and when they did not.
Table 1.
Descriptive statistics of non-drawing vs drawing.
M (SD)
Items Non-drawing Drawing
Description of observation .81 (.34) .95 (.20)
Description of location .74 (.36) .86 (.30)
Description of action .78 (.36) .86 (.30)
Description of color .87 (.31) .93 (.22)
Description of size .50 (.30) .54 (.28)
Description of shape .78 (.39) .87 (.32)
Description of sound .78 (.37) .86 (.31)
Copyright © 2013 SciRes.
12