Paper Menu >>
Journal Menu >>
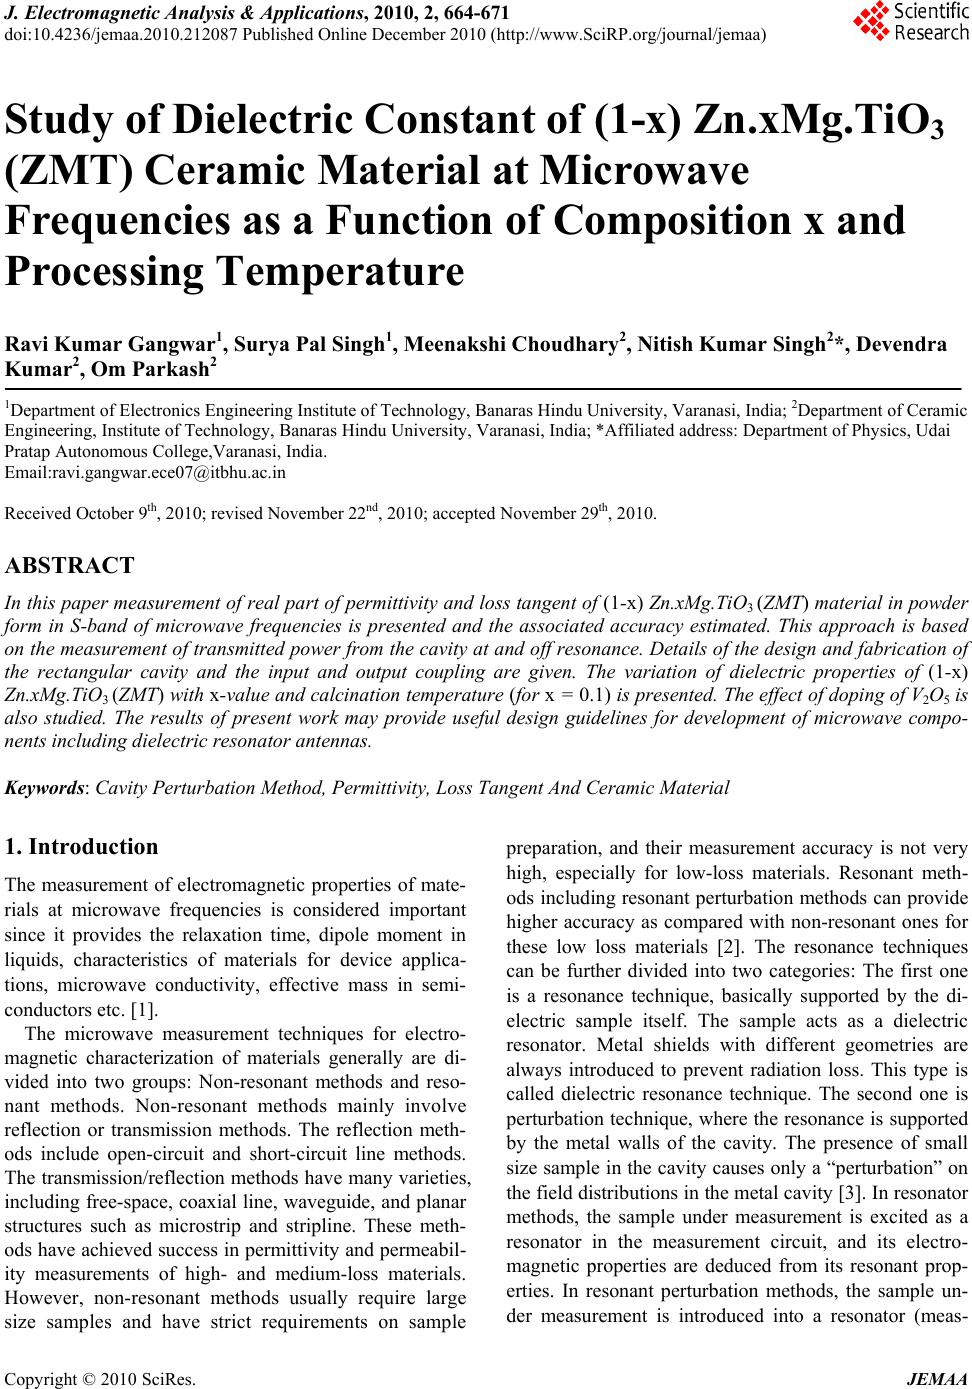 J. Electromagnetic Analysis & Applications, 2010, 2, 664-671 doi:10.4236/jemaa.2010.212087 Published Online December 2010 (http://www.SciRP.org/journal/jemaa) Copyright © 2010 SciRes. JEMAA Study of Dielectric Constant of (1-x) Zn.xMg.TiO3 (ZMT) Ceramic Material at Microwave Frequencies as a Function of Composition x and Processing Temperature Ravi Kumar Gangwar1, Surya Pal Singh1, Meenakshi Choudhary2, Nitish Kumar Singh2*, Devendra Kumar2, Om Parkash2 1Department of Electronics Engineering Institute of Technology, Banaras Hindu University, Varanasi, India; 2Department of Ceramic Engineering, Institute of Technology, Banaras Hindu University, Varanasi, India; *Affiliated address: Department of Physics, Udai Pratap Autonomous College,Varanasi, India. Email:ravi.gangwar.ece07@itbhu.ac.in Received October 9th, 2010; revised November 22nd, 2010; accepted November 29th, 2010. ABSTRACT In this paper measurement of real part of permittivity a nd loss tangent of (1-x) Zn.xMg.TiO3 (ZMT) material in powder form in S-band of microwave frequencies is presented and the associated accuracy estimated. This approach is based on the measurement of transmitted power from the cavity at and off resonance. Details of the design and fabrication of the rectangular cavity and the input and output coupling are given. The variation of dielectric properties of (1-x) Zn.xMg.TiO3 (ZMT) with x-value and calcination temperature (for x = 0.1) is presented. The effect of doping of V2O5 is also studied. The results of present work may provide useful design guidelines for development of microwave compo- nents including dielectric resonator antennas. Keywords: Cavity Perturbation Method, Permittivity, Loss Tangent And Ceramic Material 1. Introduction The measurement of electromagnetic properties of mate- rials at microwave frequencies is considered important since it provides the relaxation time, dipole moment in liquids, characteristics of materials for device applica- tions, microwave conductivity, effective mass in semi- conductors etc. [1]. The microwave measurement techniques for electro- magnetic characterization of materials generally are di- vided into two groups: Non-resonant methods and reso- nant methods. Non-resonant methods mainly involve reflection or transmission methods. The reflection meth- ods include open-circuit and short-circuit line methods. The transmission/reflection methods have many varieties, including free-space, coaxial line, waveguide, and planar structures such as microstrip and stripline. These meth- ods have achieved success in permittivity and permeabil- ity measurements of high- and medium-loss materials. However, non-resonant methods usually require large size samples and have strict requirements on sample preparation, and their measurement accuracy is not very high, especially for low-loss materials. Resonant meth- ods including resonant perturbation methods can provide higher accuracy as compared with non-resonant ones for these low loss materials [2]. The resonance techniques can be further divided into two categories: The first one is a resonance technique, basically supported by the di- electric sample itself. The sample acts as a dielectric resonator. Metal shields with different geometries are always introduced to prevent radiation loss. This type is called dielectric resonance technique. The second one is perturbation technique, where the resonance is supported by the metal walls of the cavity. The presence of small size sample in the cavity causes only a “perturbation” on the field distributions in the metal cavity [3]. In resonator methods, the sample under measurement is excited as a resonator in the measurement circuit, and its electro- magnetic properties are deduced from its resonant prop- erties. In resonant perturbation methods, the sample un- der measurement is introduced into a resonator (meas- 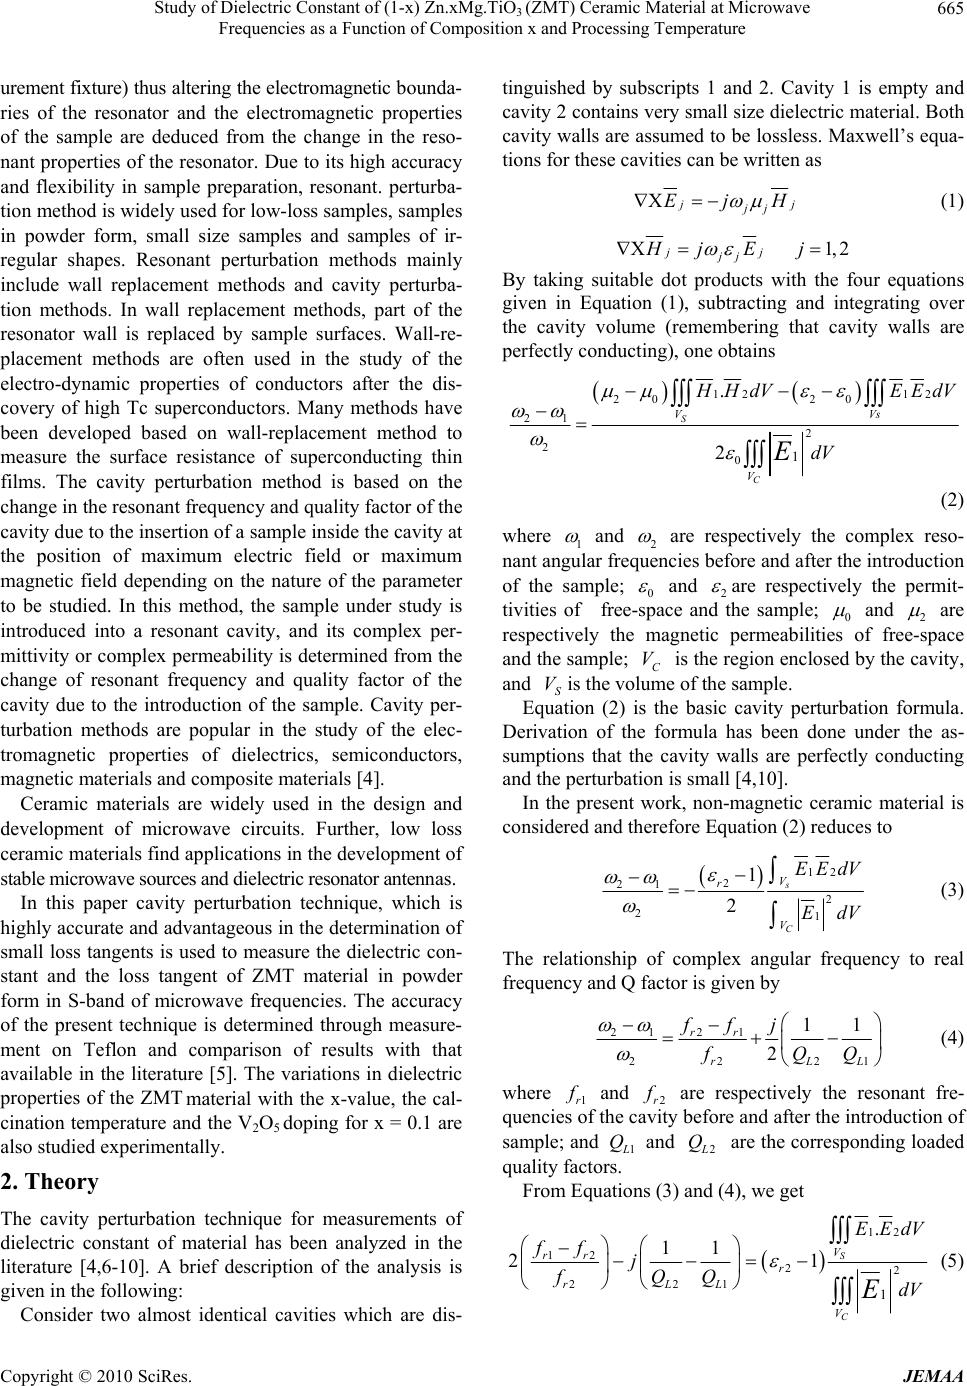 Study of Dielectric Constant of (1-x) Zn.xMg.TiO(ZMT) Ceramic Material at Microwave 665 3 Frequencies as a Function of Composition x and Processing Temperature urement fixture) thus altering the electromagnetic bounda- ries of the resonator and the electromagnetic properties of the sample are deduced from the change in the reso- nant properties of the resonator. Due to its high accuracy and flexibility in sample preparation, resonant. perturba- tion method is widely used for low-loss samples, samples in powder form, small size samples and samples of ir- regular shapes. Resonant perturbation methods mainly include wall replacement methods and cavity perturba- tion methods. In wall replacement methods, part of the resonator wall is replaced by sample surfaces. Wall-re- placement methods are often used in the study of the electro-dynamic properties of conductors after the dis- covery of high Tc superconductors. Many methods have been developed based on wall-replacement method to measure the surface resistance of superconducting thin films. The cavity perturbation method is based on the change in the resonant frequency and quality factor of the cavity due to the insertion of a sample inside the cavity at the position of maximum electric field or maximum magnetic field depending on the nature of the parameter to be studied. In this method, the sample under study is introduced into a resonant cavity, and its complex per- mittivity or complex permeability is determined from the change of resonant frequency and quality factor of the cavity due to the introduction of the sample. Cavity per- turbation methods are popular in the study of the elec- tromagnetic properties of dielectrics, semiconductors, magnetic materials and composite materials [4]. Ceramic materials are widely used in the design and development of microwave circuits. Further, low loss ceramic materials find applications in the development of stable microwave sources and dielectric resonator antennas. In this paper cavity perturbation technique, which is highly accurate and advantageous in the determination of small loss tangents is used to measure the dielectric con- stant and the loss tangent of ZMT material in powder form in S-band of microwave frequencies. The accuracy of the present technique is determined through measure- ment on Teflon and comparison of results with that available in the literature [5]. The variations in dielectric properties of the ZMT material with the x-value, the cal- cination temperature and the V2O5 doping for x = 0.1 are also studied experimentally. 2. Theory The cavity perturbation technique for measurements of dielectric constant of material has been analyzed in the literature [4,6-10]. A brief description of the analysis is given in the following: Consider two almost identical cavities which are dis- tinguished by subscripts 1 and 2. Cavity 1 is empty and cavity 2 contains very small size dielectric material. Both cavity walls are assumed to be lossless. Maxwell’s equa- tions for these cavities can be written as j j jj EjH (1) j j jj H jE 1, 2j By taking suitable dot products with the four equations given in Equation (1), subtracting and integrating over the cavity volume (remembering that cavity walls are perfectly conducting), one obtains 12 12 20 20 21 2 2 01 . 2 S C VV V s H HdV EEdV dV E (2) where 1 and 2 are respectively the complex reso- nant angular frequencies before and after the introduction of the sample; 0 and 2 are respectively the permit- tivities of free-space and the sample; 0 and 2 are respectively the magnetic permeabilities of free-space and the sample; C is the region enclosed by the cavity, and is the volume of the sample. V S Equation (2) is the basic cavity perturbation formula. Derivation of the formula has been done under the as- sumptions that the cavity walls are perfectly conducting and the perturbation is small [4,10]. V In the present work, non-magnetic ceramic material is considered and therefore Equation (2) reduces to 12 2 21 2 21 1 2 s C V r V EEdV EdV (3) The relationship of complex angular frequency to real frequency and Q factor is given by 212 1 22 2 11 2 rr rL ffj fQQ 1L (4) where 1r and 2r are respectively the resonant fre- quencies of the cavity before and after the introduction of sample; and 1 f f L Q and 2 L Q are the corresponding loaded quality factors. From Equations (3) and (4), we get 12 12 22 221 1 . 11 21 S C V rr r rLL V EEdV ff j fQQ dV E (5) Copyright © 2010 SciRes. JEMAA 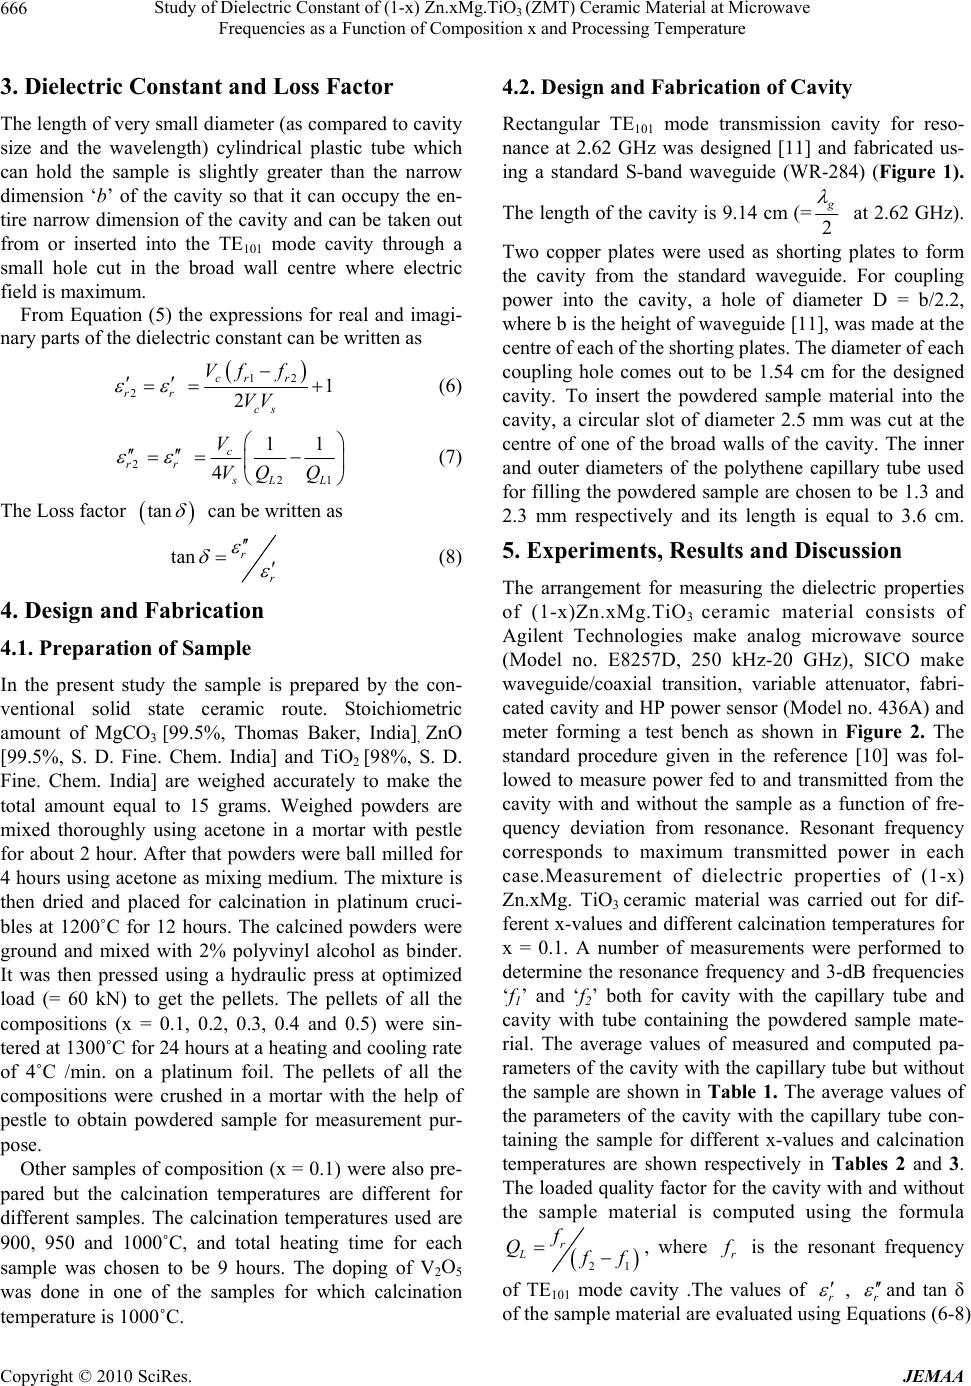 Study of Dielectric Constant of (1-x) Zn.xMg.TiO(ZMT) Ceramic Material at Microwave 666 3 Frequencies as a Function of Composition x and Processing Temperature 3. Dielectric Constant and Loss Factor The length of very small diameter (as compared to cavity size and the wavelength) cylindrical plastic tube which can hold the sample is slightly greater than the narrow dimension ‘b’ of the cavity so that it can occupy the en- tire narrow dimension of the cavity and can be taken out from or inserted into the TE101 mode cavity through a small hole cut in the broad wall centre where electric field is maximum. From Equation (5) the expressions for real and imagi- nary parts of the dielectric constant can be written as 12 21 2 cr r rr cs Vf f VV (6) 2 21 11 4 c rr sL L V VQ Q (7) The Loss factor tan can be written as tan r r (8) 4. Design and Fabrication 4.1. Preparation of Sample In the present study the sample is prepared by the con- ventional solid state ceramic route. Stoichiometric amount of MgCO3 [99.5%, Thomas Baker, India], ZnO [99.5%, S. D. Fine. Chem. India] and TiO2 [98%, S. D. Fine. Chem. India] are weighed accurately to make the total amount equal to 15 grams. Weighed powders are mixed thoroughly using acetone in a mortar with pestle for about 2 hour. After that powders were ball milled for 4 hours using acetone as mixing medium. The mixture is then dried and placed for calcination in platinum cruci- bles at 1200˚C for 12 hours. The calcined powders were ground and mixed with 2% polyvinyl alcohol as binder. It was then pressed using a hydraulic press at optimized load (= 60 kN) to get the pellets. The pellets of all the compositions (x = 0.1, 0.2, 0.3, 0.4 and 0.5) were sin- tered at 1300˚C for 24 hours at a heating and cooling rate of 4˚C /min. on a platinum foil. The pellets of all the compositions were crushed in a mortar with the help of pestle to obtain powdered sample for measurement pur- pose. Other samples of composition (x = 0.1) were also pre- pared but the calcination temperatures are different for different samples. The calcination temperatures used are 900, 950 and 1000˚C, and total heating time for each sample was chosen to be 9 hours. The doping of V2O5 was done in one of the samples for which calcination temperature is 1000˚C. 4.2. Design and Fabrication of Cavity Rectangular TE101 mode transmission cavity for reso- nance at 2.62 GHz was designed [11] and fabricated us- ing a standard S-band waveguide (WR-284) (Figure 1). The length of the cavity is 9.14 cm (=2 g at 2.62 GHz). Two copper plates were used as shorting plates to form the cavity from the standard waveguide. For coupling power into the cavity, a hole of diameter D = b/2.2, where b is the height of waveguide [11], was made at the centre of each of the shorting plates. The diameter of each coupling hole comes out to be 1.54 cm for the designed cavity. To insert the powdered sample material into the cavity, a circular slot of diameter 2.5 mm was cut at the centre of one of the broad walls of the cavity. The inner and outer diameters of the polythene capillary tube used for filling the powdered sample are chosen to be 1.3 and 2.3 mm respectively and its length is equal to 3.6 cm. 5. Experiments, Results and Discussion The arrangement for measuring the dielectric properties of (1-x)Zn.xMg.TiO3 ceramic material consists of Agilent Technologies make analog microwave source (Model no. E8257D, 250 kHz-20 GHz), SICO make waveguide/coaxial transition, variable attenuator, fabri- cated cavity and HP power sensor (Model no. 436A) and meter forming a test bench as shown in Figure 2. The standard procedure given in the reference [10] was fol- lowed to measure power fed to and transmitted from the cavity with and without the sample as a function of fre- quency deviation from resonance. Resonant frequency corresponds to maximum transmitted power in each case.Measurement of dielectric properties of (1-x) Zn.xMg. TiO3 ceramic material was carried out for dif- ferent x-values and different calcination temperatures for x = 0.1. A number of measurements were performed to determine the resonance frequency and 3-dB frequencies ‘f1’ and ‘f2’ both for cavity with the capillary tube and cavity with tube containing the powdered sample mate- rial. The average values of measured and computed pa- rameters of the cavity with the capillary tube but without the sample are shown in Table 1. The average values of the parameters of the cavity with the capillary tube con- taining the sample for different x-values and calcination temperatures are shown respectively in Tables 2 and 3. The loaded quality factor for the cavity with and without the sample material is computed using the formula 21 r Lf Qff , where is the resonant frequency r f of TE101 mode cavity .The values of r , r and tan δ of the sample material are evaluated using Equations (6-8) Copyright © 2010 SciRes. JEMAA 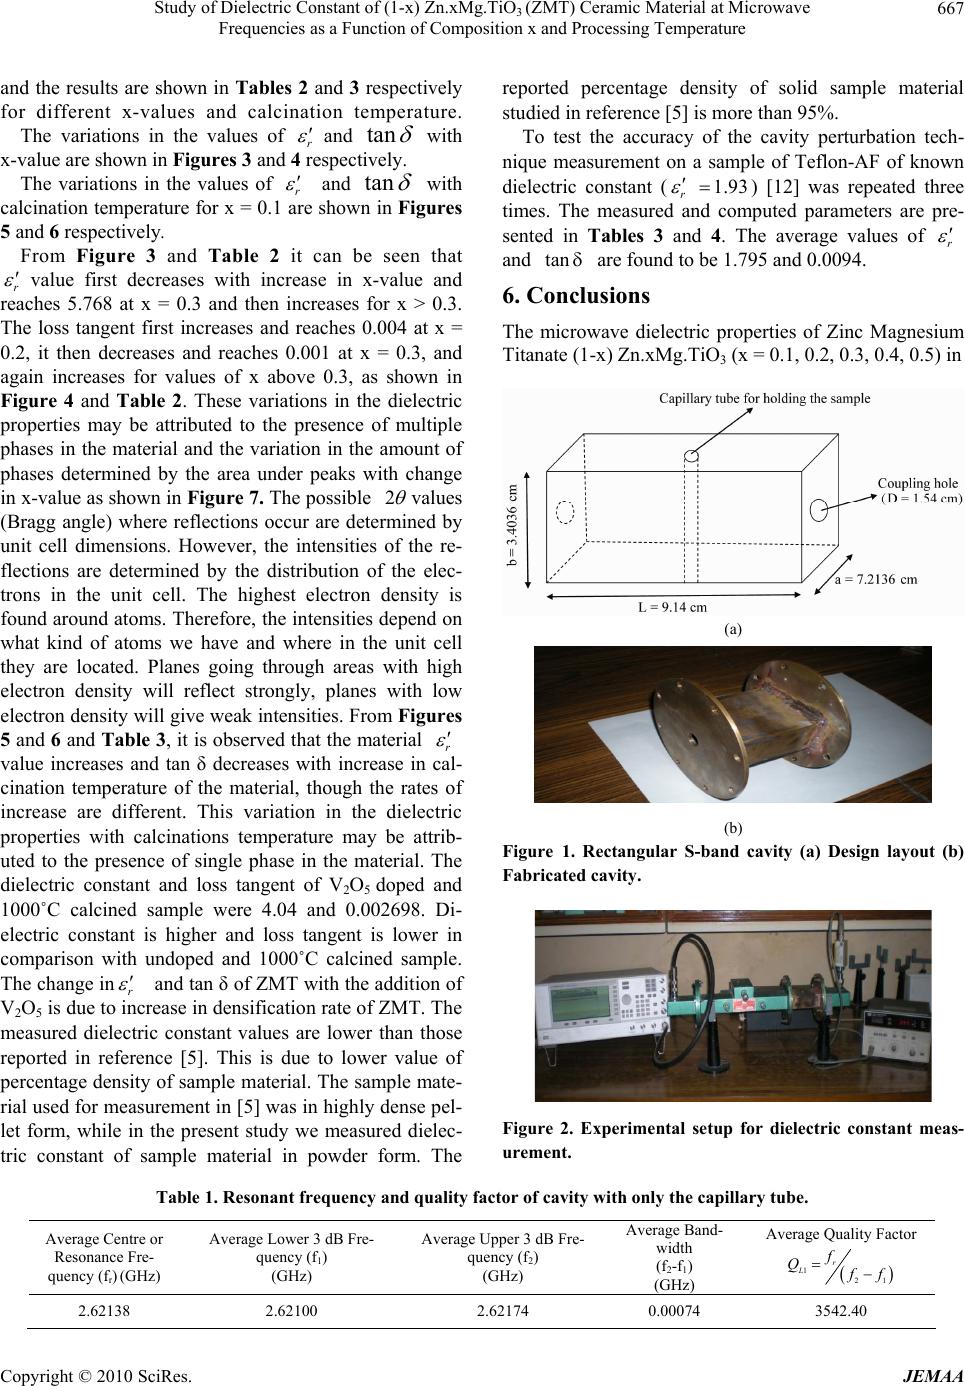 Study of Dielectric Constant of (1-x) Zn.xMg.TiO3 (ZMT) Ceramic Material at Microwave Frequencies as a Function of Composition x and Processing Temperature Copyright © 2010 SciRes. JEMAA 667 and the results are shown in Tables 2 and 3 respectively for different x-values and calcination temperature. The variations in the values of r and tan with x-value are shown in Figures 3 and 4 respectively. The variations in the values of r and tan with calcination temperature for x = 0.1 are shown in Figures 5 and 6 respectively. From Figure 3 and Table 2 it can be seen that r value first decreases with increase in x-value and reaches 5.768 at x = 0.3 and then increases for x > 0.3. The loss tangent first increases and reaches 0.004 at x = 0.2, it then decreases and reaches 0.001 at x = 0.3, and again increases for values of x above 0.3, as shown in Figure 4 and Table 2. These variations in the dielectric properties may be attributed to the presence of multiple phases in the material and the variation in the amount of phases determined by the area under peaks with change in x-value as shown in Figure 7. The possible 2 values (Bragg angle) where reflections occur are determined by unit cell dimensions. However, the intensities of the re- flections are determined by the distribution of the elec- trons in the unit cell. The highest electron density is found around atoms. Therefore, the intensities depend on what kind of atoms we have and where in the unit cell they are located. Planes going through areas with high electron density will reflect strongly, planes with low electron density will give weak intensities. From Figures 5 and 6 and Tab le 3, it is observed that the material r value increases and tan δ decreases with increase in cal- cination temperature of the material, though the rates of increase are different. This variation in the dielectric properties with calcinations temperature may be attrib- uted to the presence of single phase in the material. The dielectric constant and loss tangent of V2O5 doped and 1000˚C calcined sample were 4.04 and 0.002698. Di- electric constant is higher and loss tangent is lower in comparison with undoped and 1000˚C calcined sample. The change inr and tan δ of ZMT with the addition of V2O5 is due to increase in densification rate of ZMT. The measured dielectric constant values are lower than those reported in reference [5]. This is due to lower value of percentage density of sample material. The sample mate- rial used for measurement in [5] was in highly dense pel- let form, while in the present study we measured dielec- tric constant of sample material in powder form. The reported percentage density of solid sample material studied in reference [5] is more than 95%. To test the accuracy of the cavity perturbation tech- nique measurement on a sample of Teflon-AF of known dielectric constant () [12] was repeated three times. The measured and computed parameters are pre- sented in Tables 3 and 4. The average values of 1.93 r r and tan are found to be 1.795 and 0.0094. 6. Conclusions The microwave dielectric properties of Zinc Magnesium Titanate (1-x) Zn.xMg.TiO3 (x = 0.1, 0.2, 0.3, 0.4, 0.5) in (a) (b) Figure 1. Rectangular S-band cavity (a) Design layout (b) Fabricated cavity. Figure 2. Experimental setup for dielectric constant meas- urement. Table 1. Resonant frequency and quality factor of cavity with only the capillary tube. Average Centre or Resonance Fre- quency (fr) (GHz) Average Lower 3 dB Fre- quency (f1) (GHz) Average Upper 3 dB Fre- quency (f2) (GHz) Average Band- width (f2-f1) (GHz) Average Quality Factor 1 21 r Lf Q f f 2.62138 2.62100 2.62174 0.00074 3542.40  Study of Dielectric Constant of (1-x) Zn.xMg.TiO(ZMT) Ceramic Material at Microwave 668 3 Frequencies as a Function of Composition x and Processing Temperature Table 2. Dielectric constant of ((1-x) Zn.xMg.TiO3) for different values of x. X value Average Centre or Resonant Frequency (fr) (GHz) Average Lower 3dB Frequency (f1) (GHz) Average Upper 3 dB Frequency (f2) (GHz) Average Quality Fac- tor 2 21 L r f Q f f r r tan r r 0.1 0.2 0.3 0.4 0.5 2.61462 2.61494 2.61548 2.61504 2.61456 2.61422 2.61454 2.61546 2.61468 2.61418 2.61500 2.61534 2.61620 2.61542 2.61494 3352.07 3268.67 3534.91 3533.83 3404.21 6.4648 6.2055 5.768 6.1244 6.5134 0.0169 0.0249 0.00063 0.00072 0.0121 0.0026 0.0040 0.0001 0.00011 0.00185 Table 3. Dielectric constant of ((1-x) Zn.xMg.TiO3) where x = 0.1, for different values of calcination temperatures. Sample Calcination Temperature ( 0C) Centre or Resonant Frequency (fr) (GHz) Lower 3dB Fre- quency (f1) (GHz) Upper 3 dB Frequency (f2) (GHz) Quality Factor 2 21 L r f Q f f r r tan r r ZMT ZMT ZMT ZMT +V2O5 900 950 1000 1000 2.61728 2.61736 2.61752 2.61472 2.61688 2.61696 2.61712 2.61434 2.61770 2.61778 2.61790 2.61514 3191.80 3191.90 3355.79 3268.40 2.94 3.03 3.67 4.04 0.0174 0.0173 0.0111 0.01188 0.005914 0.00507 0.003026 0.002698 Table 4. Resonance frequenc y and quality factor of cavity without standard sample. Average Centre or Resonance Fre- quency (fr) (GHz) Average Lower 3 dB Fre- quency ( f1) (GHz) Average Upper 3 dB Fre- quency (f2) (GHz) Average Bandwidth (f2-f1) (GHz) Average Quality Factor 1 21 r Lf Q f f 2.62794 2.62754 2.62834 0.00080 3284.925 Table 5. Dielectric constant of standard material (Teflon-AF). Standard Material Centre or Resonant Frequency (fr) (GHz) Lower 3 dB Fre- quency (f1) (GHz) Upper 3 dB Fre- quency (f2) (GHz) Quality Factor 2 21 L r f Q f f r r tan r r Average Value r and tan Teflon-AF (diameter = 2.5 mm and length = 37.25 mm) 2.62386 2.62388 2.62382 2.62340 2.62340 2.62344 2.62438 2.62436 2.62432 2677.408 2733.208 2677.367 1.794 1.790 1.801 0.0176 0.0156 0.0176 0.0098 0.0087 0.0097 1.795 and 0.0094 powder form have been investigated. The cavity pertur- bation technique has been used for the evaluation of di- electric properties of the material in S-band of micro- wave frequencies. In this technique, a cavity has been designed with very small slot at the centre of the broad wall of rectangular waveguide in order to insert the sam- ple material. A cylindrical capillary is designed for holding of the sample. According to Wang [5] dielectric Copyright © 2010 SciRes. JEMAA  Study of Dielectric Constant of (1-x) Zn.xMg.TiO(ZMT) Ceramic Material at Microwave 669 3 Frequencies as a Function of Composition x and Processing Temperature 5.2 5.4 5.6 5.8 6 6.2 6.4 6.6 0.1 0.2 0.3 0.4 0.5 x-value Dielectric Constant Figure 3. The experimentally observed variation of dielectric constant with x-value. 0 0.0005 0.001 0.0015 0.002 0.0025 0.003 0.0035 0.004 0.0045 0.1 0.2 0.3 0.4 0.5 x-value Loss Tangent Figure 4. The experimentally observed variation of loss tangent with x-value Copyright © 2010 SciRes. JEMAA  Study of Dielectric Constant of (1-x) Zn.xMg.TiO3 (ZMT) Ceramic Material at Microwave Frequencies as a Function of Composition x and Processing Temperature Copyright © 2010 SciRes. JEMAA 670 2 2.2 2.4 2.6 2.8 3 3.2 3.4 3.6 3.8 900950 1000 Calcination Temperature Dielectric Constant Figure 5. The experimentally observed variation of dielectric constant with calcination temperature for composition x = 0.1. 0 0.001 0.002 0.003 0.004 0.005 0.006 0.007 900950 1000 Calcination Tempera ture Loss Tange nt Figure 6. The experimentally observed variation of loss tangent with calcination temperature for composition x = 0.1.  Study of Dielectric Constant of (1-x) Zn.xMg.TiO(ZMT) Ceramic Material at Microwave 671 3 Frequencies as a Function of Composition x and Processing Temperature 20 25 30 35 40 45 50 55 60 65 70 $ $ $ ## # $ # # ## # # # # * * * * * * * * * * * * * * * * ** * * *# * (a) (b) (c) (d) (e) Intensity (arb. units) 2 (degree) Figure 7. X-ray diffraction patterns of (1-x)Zn.xMg.TiO3 with (a) x = 0.1, (b) x = 0.2, (c) x = 0.3, (d) x = 0.4 and (e) x = 0.5 ( where * (Mg, Zn)TiO3, # (Mg, Zn)Ti2O5 and $ TiO2). constant decreases with increase in x-value. In the pre- sent study the dielectric constant value decreased for x–values from x = 0.1 to 0.3 and then increased for x > 0.3. This is because of the presence of different phases in the composite material and the variation in the amount of phases with change in x-values as shown in the XRD patterns of the material. The dielectric constant has in- creased and loss tangent reduced with increase in calci- nation temperature. This may be attributed to the pres- ence of single phase in the material. The r value in- creased and tan δ reduced with the addition of V2O5 in ZMT material. This is because of improvement in the rate of densification of ZMT material. The measured dielectric constant values are lower than those reported in reference [5]. This is due to lower value of percentage density of sample material. The reported percentage den- sity of sample materials studied in reference [5] is more than 95%. Sample material used for measurement in ref- erence [5] is in highly dense pellet form while in the present study we measured the permittivity of sample material in powder form. It is concluded that the results represented here may provide important inputs for the design of devices at mi- crowave frequencies. REFERENCES [1] V. Subramanian, V. Sivasubramanian, V. R. K. Murty and J. Sobhanadri, “Measurement of Complex Dielectric Permittivity of Partially Inserted Samples in a Cavity Perturbation Technique,” Review of Scientific Instruments, Vol. 67, No. 1, January 1996, pp. 279-282. [2] L. G. Chen, C. K. Ong and B. T. G. Tan, “Amendment of Cavity Perturbation Method for Permittivity Measure- ment of Extremely Low-Loss Dielectrics,” IEEE Trans- actons on Instrumentation and Measurement, Vol. 48, No. 6, December 1999, pp. 1031-1037. [3] J. Y. H. Sheen, “Amendment of Cavity Perturbation Technique for Loss Tangent Measurement at Microwave Frequencies,” Journal of Applied Physics, Vol. 102, No. 1, July 2007, pp. 014102-014102-6. [4] A. Kumar and S. Sharma, “Measurement of Dielectric Constant and Loss Factor of the Dielectric Material at Microwave Frequencies,” Progress in Electromagnetic Research, PIER, Vol. 69, 2007, pp. 47-54. [5] W. R. Wang, S. F. Wang and Y. M. Lin, “Low Tempera- ture Sintering of (Zn1-x MgX) TiO3 Microwave Dielec- tric,” Ceramic International, Vol. 31, 2005, pp. 905-909. [6] M. Lin and M. N. Safer, “A New Cavity Perturbation Technique for Accurate Measurement of Dielectric Pa- rameters,” Ieee Mtt-S International Microwave Sympo- sium Digest, San Francisco, 11-16 June 2006, pp. 1630- 1633. [7] B. Meng, J. Booske and R. Cooper, “A System to Meas- ure Complex Permittivity of Low Loss Ceramics at Mi- crowave Frequencies and over Large Temperature Ranges,” Review of Scientific Instruments, Vol. 66, No. 2, February 1995, pp. 1068-1071. [8] A. Verma and D. C. Dube, “Measurement of Dielectric Parameter of Small Samples X-Band Frequencies by Cavity Perturbation Techniques,” IEEE Transaction on Instrumentation and Measurement, Vol. 54, No. 5, Octo- ber 2005, pp. 2120-2123. [9] V. R. K. Murty and R. Raman, “A Method for the Evaluation of Microwave Dielectric and Magnetic Pa- rameters Using Rectangular Cavity Perturbation Tech- nique,” Solid State Communication, Vol. 70, No. 8, 1989, pp. 847-850. [10] H. M. Altschuler, “Dielectric Constant,” In: M. Sucher and J. Fox, Eds., Handbook of Microwave Measurements, Brooklyn, Polytechnic Press, New York, Vol. II, 1963, pp. 518-548. [11] A report on, “Standard Test Method for Complex Permit- tivity (Dielectric Constant) of Solid Electrical Insulating Material at Microwave Frequencies and Temperature to 1850 Degree Centigrade,” ANSI/ASTM D. pp. 2520-2577. [12] http://www2.dupont.com/Teflon_Industrial/en_US/produ cts/product_by_name/teflon_af/properties.html Copyright © 2010 SciRes. JEMAA |