Paper Menu >>
Journal Menu >>
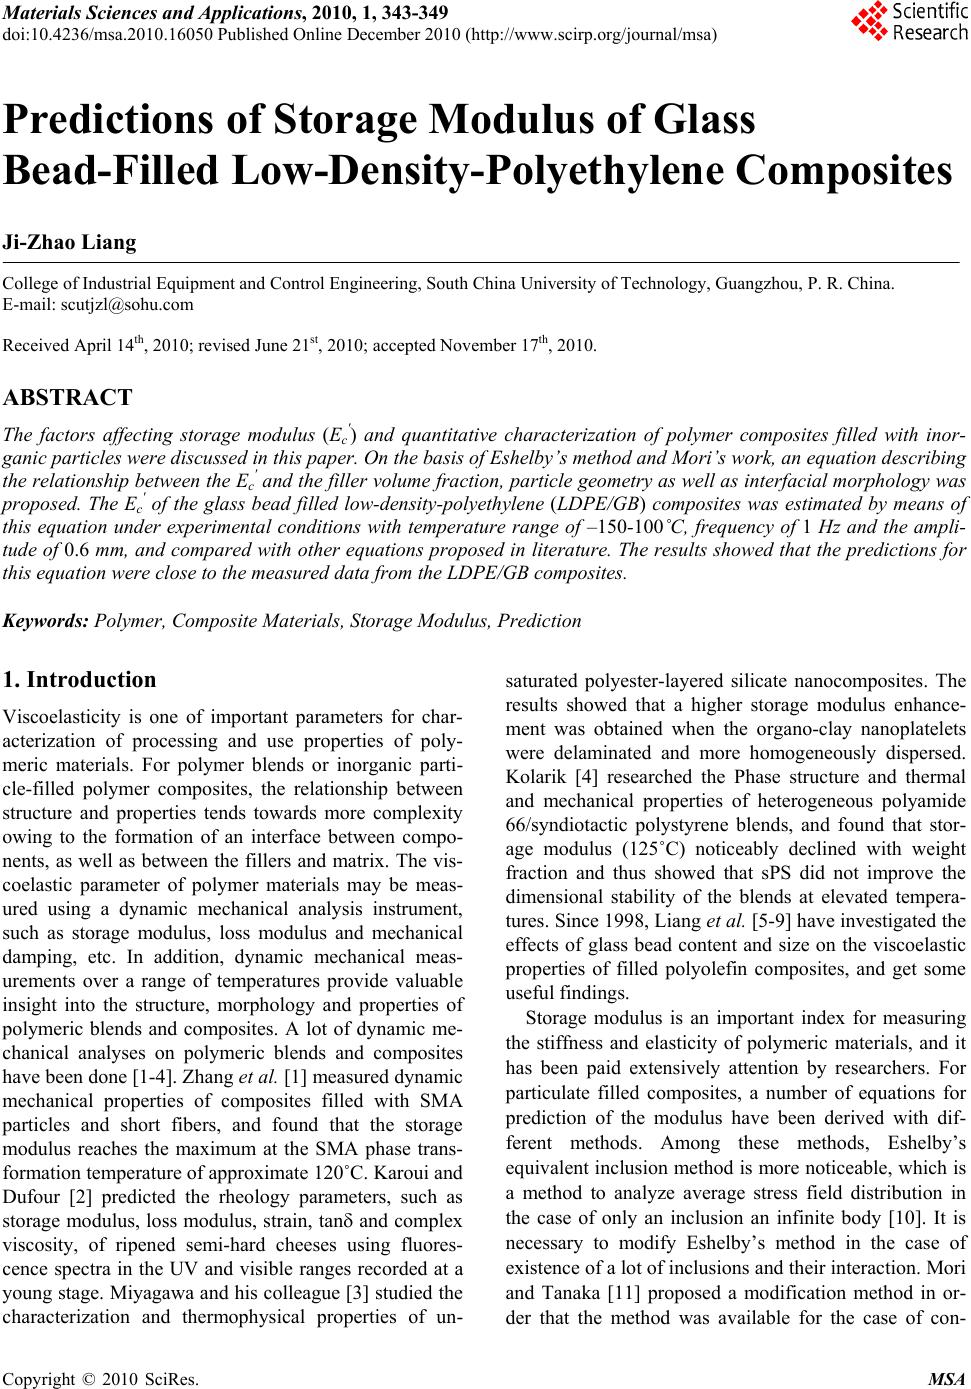 Materials Sciences and Applicatio ns, 2010, 1, 343-349 doi:10.4236/msa.2010.16050 Published Online December 2010 (http://www.scirp.org/journal/msa) Copyright © 2010 SciRes. MSA 343 Predictions of Storage Modulus of Glass Bead-Filled Low-Density-Polyethylene Composites Ji-Zhao Liang College of Industrial Equipment and Control Engineering, South China University of Technology, Guangzhou, P. R. China. E-mail: scutjzl@sohu.com Received April 14th, 2010; revised June 21st, 2010; accepted November 17th, 2010. ABSTRACT The factors affecting storage modulus (Ec') and quantitative characterization of polymer composites filled with inor- ganic particles were discussed in this paper. On the basis of Eshelby’s m ethod and Mo ri’s wo rk, an equa tion describ ing the relationship b etween the Ec' and the filler volume fraction , particle geometry as well as in terfacial morphology was proposed. The Ec' of the glass bead filled low-density-polyethylene (LDPE/GB) composites was estimated by means of this equation under experimental conditions with temperature range of –150-100˚C, frequency of 1 Hz and the ampli- tude of 0.6 mm, and compared with o ther equation s proposed in litera ture. The results sho wed that the predictions for this equation were close to the measured data from the LDPE/GB composites. Keywords: Polymer, Composite Materials, Storage Modulus, Prediction 1. Introduction Viscoelasticity is one of important parameters for char- acterization of processing and use properties of poly- meric materials. For polymer blends or inorganic parti- cle-filled polymer composites, the relationship between structure and properties tends towards more complexity owing to the formation of an interface between compo- nents, as well as between the fillers and matrix. The vis- coelastic parameter of polymer materials may be meas- ured using a dynamic mechanical analysis instrument, such as storage modulus, loss modulus and mechanical damping, etc. In addition, dynamic mechanical meas- urements over a range of temperatures provide valuable insight into the structure, morphology and properties of polymeric blends and composites. A lot of dynamic me- chanical analyses on polymeric blends and composites have been done [ 1- 4 ]. Zh an g et al. [1] measured dynamic mechanical properties of composites filled with SMA particles and short fibers, and found that the storage modulus reaches the maximum at the SMA phase trans- formation temperature of approximate 120˚C. Karoui and Dufour [2] predicted the rheology parameters, such as storage modulus, loss modulus, strain, tanδ and complex viscosity, of ripened semi-hard cheeses using fluores- cence spectra in the UV and visible ranges recorded at a young stage. Miyagaw a and his colleague [3] stud ied the characterization and thermophysical properties of un- saturated polyester-layered silicate nanocomposites. The results showed that a higher storage modulus enhance- ment was obtained when the organo-clay nanoplatelets were delaminated and more homogeneously dispersed. Kolarik [4] researched the Phase structure and thermal and mechanical properties of heterogeneous polyamide 66/syndiotactic polystyrene blends, and found that stor- age modulus (125˚C) noticeably declined with weight fraction and thus showed that sPS did not improve the dimensional stability of the blends at elevated tempera- tures. Since 1998, Liang et al. [5-9] hav e investigated th e effects of glass bead content and size on the viscoelastic properties of filled polyolefin composites, and get some useful findin gs. Storage modulus is an important index for measuring the stiffness and elasticity of polymeric materials, and it has been paid extensively attention by researchers. For particulate filled composites, a number of equations for prediction of the modulus have been derived with dif- ferent methods. Among these methods, Eshelby’s equivalent inclusion method is more noticeable, which is a method to analyze average stress field distribution in the case of only an inclusion an infinite body [10]. It is necessary to modify Eshelby’s method in the case of existence of a lot of inclusions and their in teractio n. Mori and Tanaka [11] proposed a modification method in or- der that the method was available for the case of con- 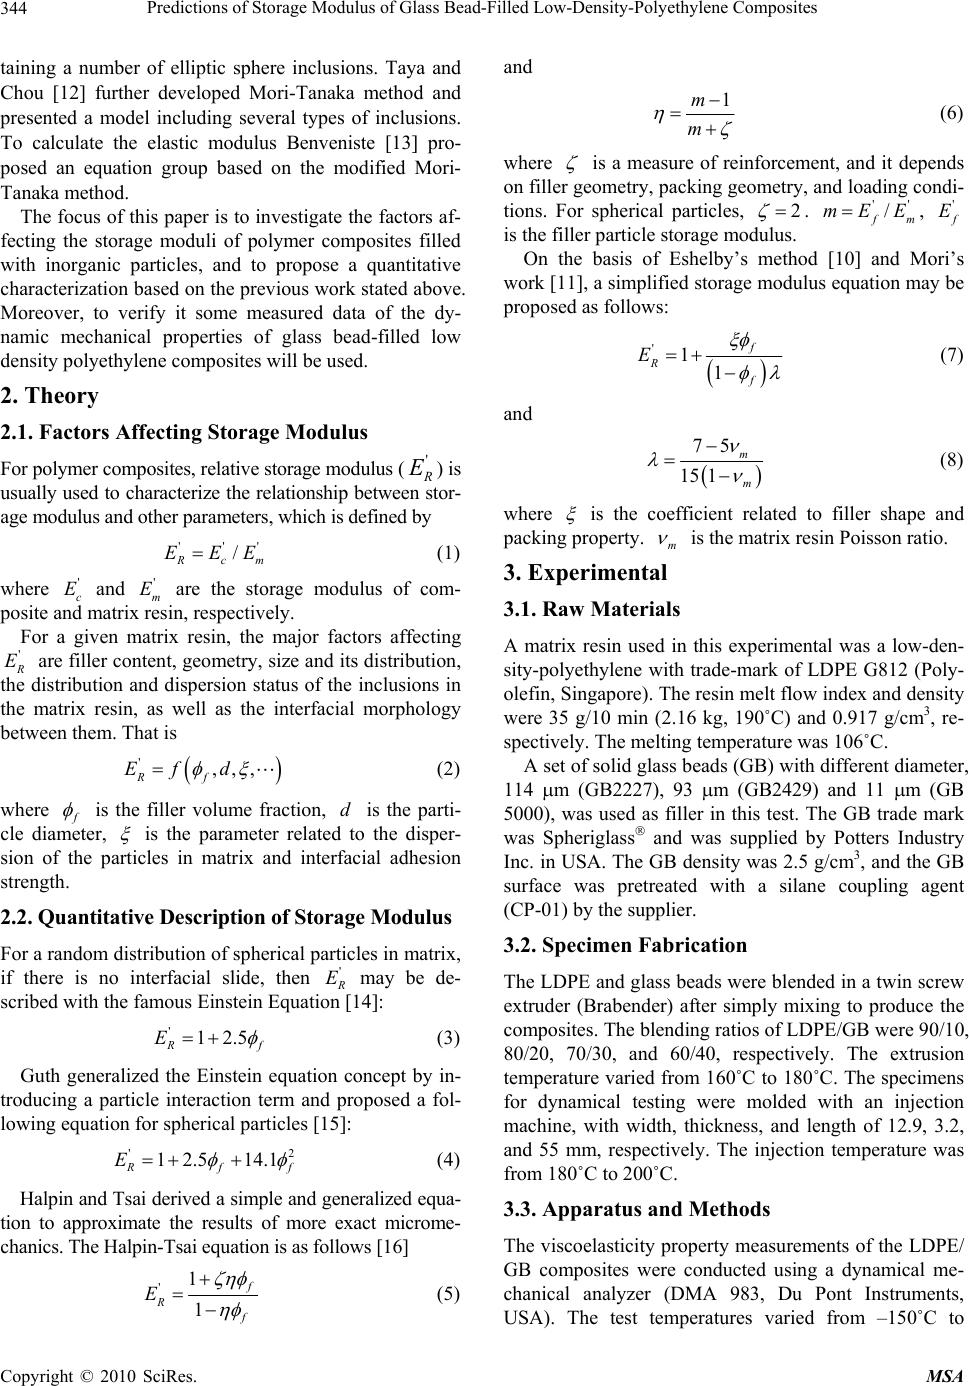 Predictions of Storage Modulus of Glass Bead-Filled Low-Density-Polyethylene Composites 344 taining a number of elliptic sphere inclusions. Taya and Chou [12] further developed Mori-Tanaka method and presented a model including several types of inclusions. To calculate the elastic modulus Benveniste [13] pro- posed an equation group based on the modified Mori- Tanaka method. The focus of this paper is to investigate the factors af- fecting the storage moduli of polymer composites filled with inorganic particles, and to propose a quantitative characterization based on the previous work stated above. Moreover, to verify it some measured data of the dy- namic mechanical properties of glass bead-filled low density polyethylene composites will be used. 2. Theory 2.1. Factors Affecting Storage Modulus For polymer composites, relative storage modulus () is usually used to character ize the relationship between stor- age modulus and other parameters, whic h is defined by ' R E '' /' R cm EEE= (1) where and are the storage modulus of com- posite and matrix resin, respectiv ely. ' c E' m E For a given matrix resin, the major factors affecting ' R E are filler content, geometry, size and its distribution, the distribution and dispersion status of the inclusions in the matrix resin, as well as the interfacial morphology between them. That is ( ',,, Rf Ef d φξ =" ) (2) where f φ is the filler volume fraction, is the parti- cle diameter, d ξ is the parameter related to the disper- sion of the particles in matrix and interfacial adhesion strength. 2.2. Quantitative Description of Storage Modulus For a random distribution of spherical particles in matrix, if there is no interfacial slide, then ' R E may be de- scribed with the famous Einstein Equation [14]: '12.5 R f E φ =+ (3) Guth generalized the Einstein equation concept by in- troducing a particle interaction term and proposed a fol- lowing equation for spherical particles [15 ]: ' 12.514.1 2 R f Ef φ φ =+ + (4) Halpin and Tsai derived a simple and generalized equa- tion to approximate the results of more exact microme- chanics. The Halpin-Tsai equation is as follows [16] '1 1 f R f E ζ ηφ η φ + =− (5) and 1m m η ζ − = + (6) where ζ is a measure of reinforcement, and it depends on filler geometry, packing geometry, and loading condi- tions. For spherical particles, 2= ζ . , is the filler particle storage modulus. '' /mf EEm ='f E On the basis of Eshelby’s method [10] and Mori’s work [11], a simplified storage modulus equation may be proposed as follows: () '11 f R f E ξφ φ λ =+ − (7) and () 75 15 1m m ν λ ν − =− (8) where ξ is the coefficient related to filler shape and packing property. m ν is the matrix resin Poisson ratio. 3. Experimental 3.1. Raw Materials A matrix resin used in this experimental was a low-den- sity-polyethylene with trade-mark of LDPE G812 (Poly- olefin, Singapore). The resin melt flow index and density were 35 g/10 min (2.16 kg, 190˚C) and 0.917 g/cm3, re- spectively. The melting temperature was 106˚C. A set of solid glass beads (GB) with different diameter, 114 μm (GB2227), 93 μm (GB2429) and 11 μm (GB 5000), was used as filler in this test. The GB trade mark was Spheriglass® and was supplied by Potters Industry Inc. in USA. The GB density was 2.5 g/cm3, and the GB surface was pretreated with a silane coupling agent (CP-01) by the supplier. 3.2. Specimen Fabrication The LDPE and glass beads were blended in a twin screw extruder (Brabender) after simply mixing to produce the composites. The blending ratios of LDPE/GB were 90/10, 80/20, 70/30, and 60/40, respectively. The extrusion temperature varied from 160˚C to 180˚C. The specimens for dynamical testing were molded with an injection machine, with width, thickness, and length of 12.9, 3.2, and 55 mm, respectively. The injection temperature was from 180˚C to 200˚C. 3.3. Apparatus and Methods The viscoelasticity property measurements of the LDPE/ GB composites were conducted using a dynamical me- chanical analyzer (DMA 983, Du Pont Instruments, USA). The test temperatures varied from –150˚C to Copyright © 2010 SciRes. MSA 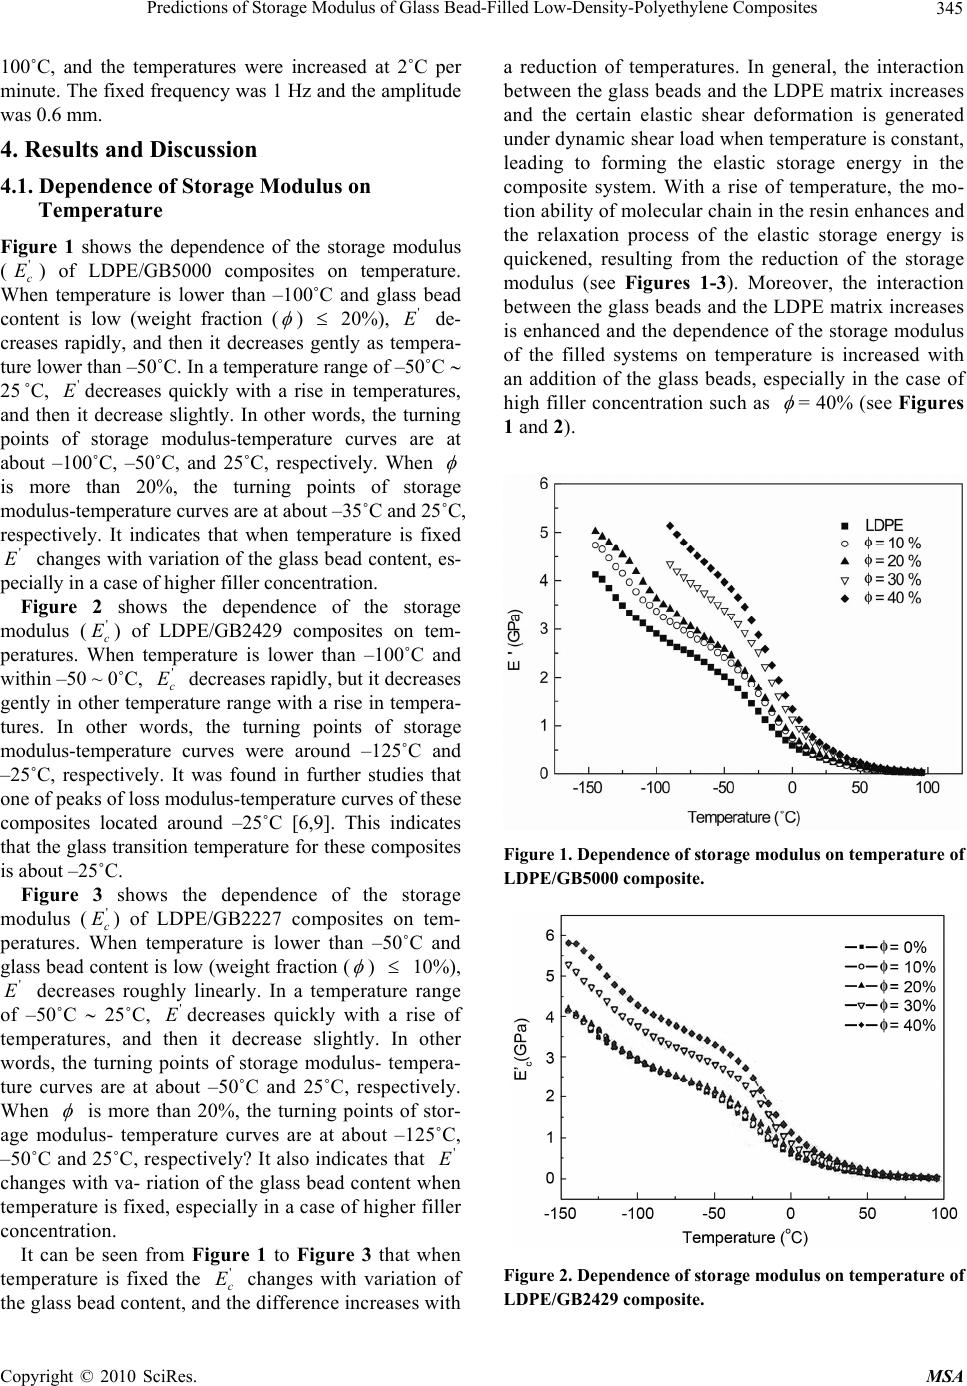 Predictions of Storage Modulus of Glass Bead-Filled Low-Density-Polyethylene Composites 345 100˚C, and the temperatures were increased at 2˚C per minute. The fixed frequency was 1 Hz and the amplitude was 0.6 mm . 4. Results and Discussion 4.1. Dependence of Storage Modulus on Temperature Figure 1 shows the dependence of the storage modulus () of LDPE/GB5000 composites on temperature. When temperature is lower than –100˚C and glass bead content is low (weight fraction ( ' c E φ ) 20%), de- creases rapidly, and then it decreases gently as tempera- ture lower than –50˚C. In a temperature range of –50˚C ∼ 25 ˚C, decreases quickly with a rise in temperatures, and then it decrease slightly. In other words, the turning points of storage modulus-temperature curves are at about –100˚C, –50˚C, and 25˚C, respectively. When ≤' E ' E φ is more than 20%, the turning points of storage modulus-temperature curves are at about –35˚C and 25˚C, respectively. It indicates that when temperature is fixed changes with variation of the glass bead content, es- pecially in a case of higher filler concentration . ' E Figure 2 shows the dependence of the storage modulus () of LDPE/GB2429 composites on tem- peratures. When temperature is lower than –100˚C and within –50 ~ 0˚C, decreases rapidly, but it decreases gently in other temperature range with a rise in tempera- tures. In other words, the turning points of storage modulus-temperature curves were around –125˚C and –25˚C, respectively. It was found in further studies that one of peaks of loss modulus-temperature curves of these composites located around –25˚C [6,9]. This indicates that the glass transition temperature for these co mposites is about –25˚C. ' c E ' c E Figure 3 shows the dependence of the storage modulus () of LDPE/GB2227 composites on tem- peratures. When temperature is lower than –50˚C and glass bead content is low (weight fraction ( ' c E φ ) ≤ 10%), decreases roughly linearly. In a temperature range of –50˚C ∼ 25˚C, decreases quickly with a rise of temperatures, and then it decrease slightly. In other words, the turning points of storage modulus- tempera- ture curves are at about –50˚C and 25˚C, respectively. When ' E' E φ is more than 20%, the turning points of stor- age modulus- temperature curves are at about –125˚C, –50˚C and 25˚C, respectively? It also indicates that changes w ith va- r iation of th e glass bead c ontent when temperature is fixed, especially in a case of higher filler concentration. ' E It can be seen from Figure 1 to Figure 3 that when temperature is fixed the changes with variation of the glass b ead content, and the d ifference increa ses w ith a reduction of temperatures. In general, the interaction between the glass beads and the LDPE matrix increases and the certain elastic shear deformation is generated under dynamic shear load when temperature is constant, leading to forming the elastic storage energy in the composite system. With a rise of temperature, the mo- tion ability of molecular chain in the resin enhances and the relaxation process of the elastic storage energy is quickened, resulting from the reduction of the storage modulus (see Figures 1-3). Moreover, the interaction between the glass beads and the LDPE matrix increases is enhanced and the dependence of the storage modulus of the filled systems on temperature is increased with an addition of the glass beads, especially in the case of high filler concentration such as ' c E φ = 40% (see Figures 1 and 2). Figure 1. Dependence of storage modulus on temperature of LDPE/GB5000 composite. Figure 2. Dependence of storage modulus on temperature of LDPE/GB2429 comp osite. Copyright © 2010 SciRes. MSA  Predictions of Storage Modulus of Glass Bead-Filled Low-Density-Polyethylene Composites Copyright © 2010 SciRes. MSA 346 -150 -100-50050100 -1 0 1 2 3 4 5 6 7 LDPE φ = 10 % φ = 20 % φ = 30 % E ' (GPa) Temperature (oC) where mf ρ ρ χ / = , f ρ and m ρ are the density of the filler and matrix resin, respectively. When te mperatu re is 0˚C, the relationship between the relative storage modulus of the LDPE/GB composites and the glass bead volume fraction is showed as in Fig- ure 5. Similarly, the increases nonlinearly with an addition of f ' R E φ . Furthermore, the is also estimated by means of Equation (7) under these test conditions. The results show good agreement between the estima- tions and the experimental measured data. ' R E It can also be observed from Figures 4 and 5 that the relative storage modulus of LDPE filled with small di- ameter GB is obvious greater than that of LDPE filled with big ones. This because that the smaller the size of particles is, the more specific surface area of the filler is, leading to increase of the contact area between the inclu- sions and matrix. Furthermore, the particle number in- creases with an reduction of filler size under the same volume fraction, and the interaction between the inclu- sions and matrix is enhanced correspondingly, resulting in increase of the storage modulus of polymer compos- ites, especially in a case of uniform dispersion of filler in resin matrix. Figures 6-8 are respectively the fracture surface photographs of the scanning electron microscope (SEM) of the LDPE/GB2227, LDPE/GB2429 and LDPE /GB5000 filled systems when the glass bead weight frac- tion is 20%. It can be observed that the dispersion of the glass beads in LDPE matrix was roughly uniform. Figure 3. Dependence of storage modulus on temperature of LDPE/GB2227 composite. 4.2. Relationship between Relative Storage Modulus and GB Content Figure 4 illustrates the relationship between the relative storage modulus () of the LDPE/GB composites and the glass bead volume fraction (f ' R E φ ) as temperature is –25˚C. It may seen that the increases nonlinearly with an increase of f ' R E φ . In addition, the is esti- mated by means of Equation (7) under these test condi- tions. The results indicate that the calculations and the experimental measured data are roughly close to each other. In this paper, ' R E 38.0= m ν , 2.0 ξ =. For inorganic particles, a relationship between weight fraction and volume fraction is given by [17]: 1 f ff φχ φ φ φχ =−+ (9) As stated above, the interaction between the glass beads and the LDPE matrix increases is enhanced and the dependence of the storage modulus of the filled sys- tems on temperature is increased with an addition of the glass beads, especially in the case of high concentration of the fine particles, leading to the difference between the predictions and the measured storage modulus of the 0510 15 20 25 0.0 0.5 1.0 1.5 2.0 2.5 3.0 d = 11 μm d = 93 μm d = 114 μm Equation (7) 0oC E 'R φf (%) Figure 4. Relationship between relative storage modulus and GB volume fraction at –25˚C. Figure 5. Relationship between relative storage modulus and GB volume fraction at 0˚C. 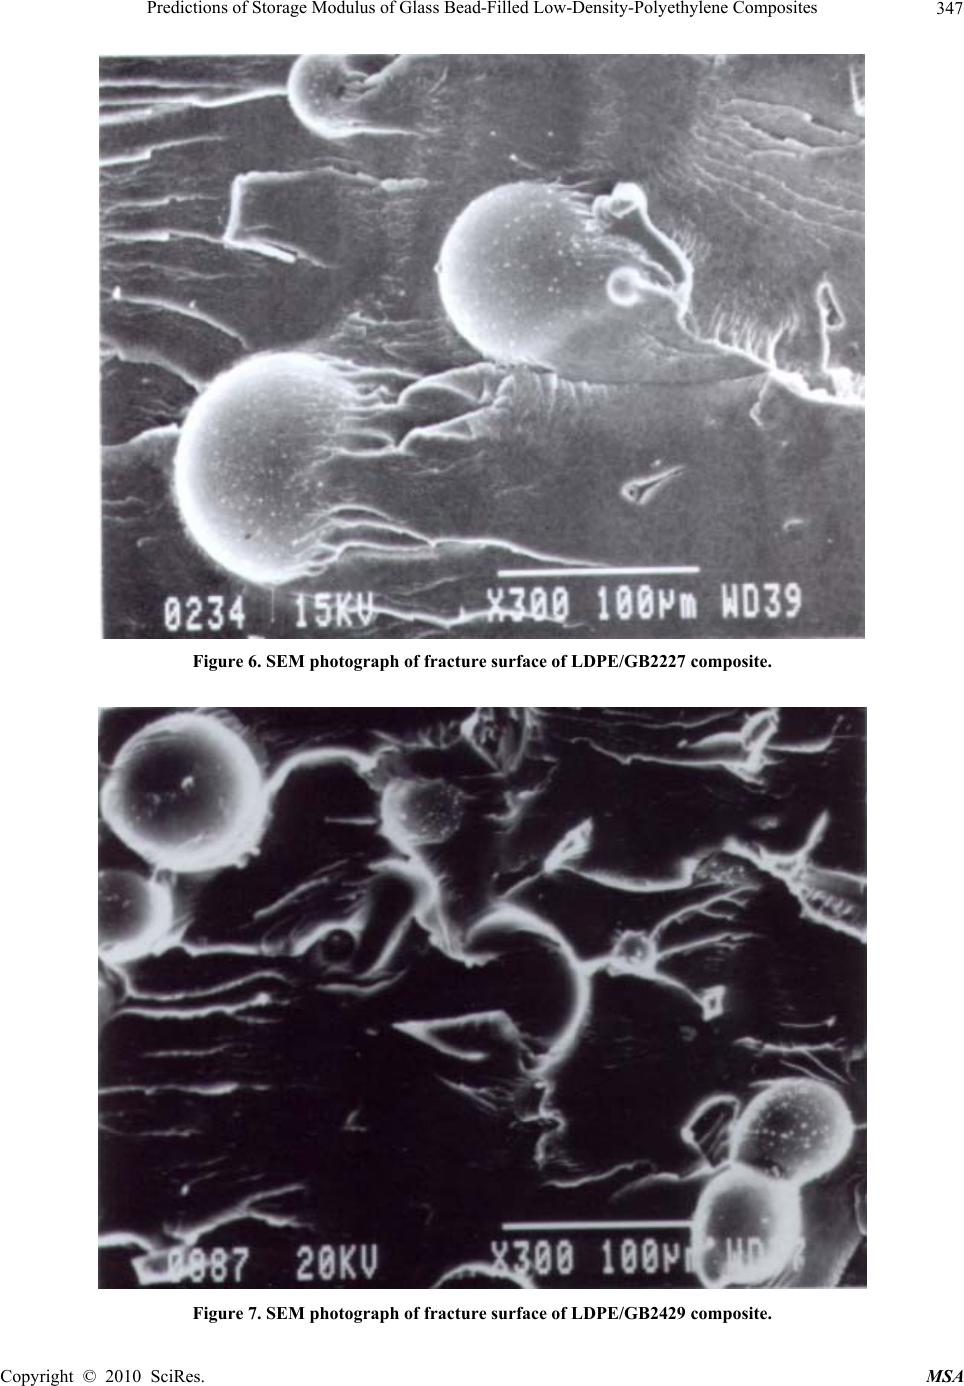 Predictions of Storage Modulus of Glass Bead-Filled Low-Density-Polyethylene Composites 347 Figure 6. SEM photograph of fracture surface of LDPE/GB2227 composite. Figure 7. SEM photograph of fracture surface of LDPE/GB2429 composite. Copyright © 2010 SciRes. MSA 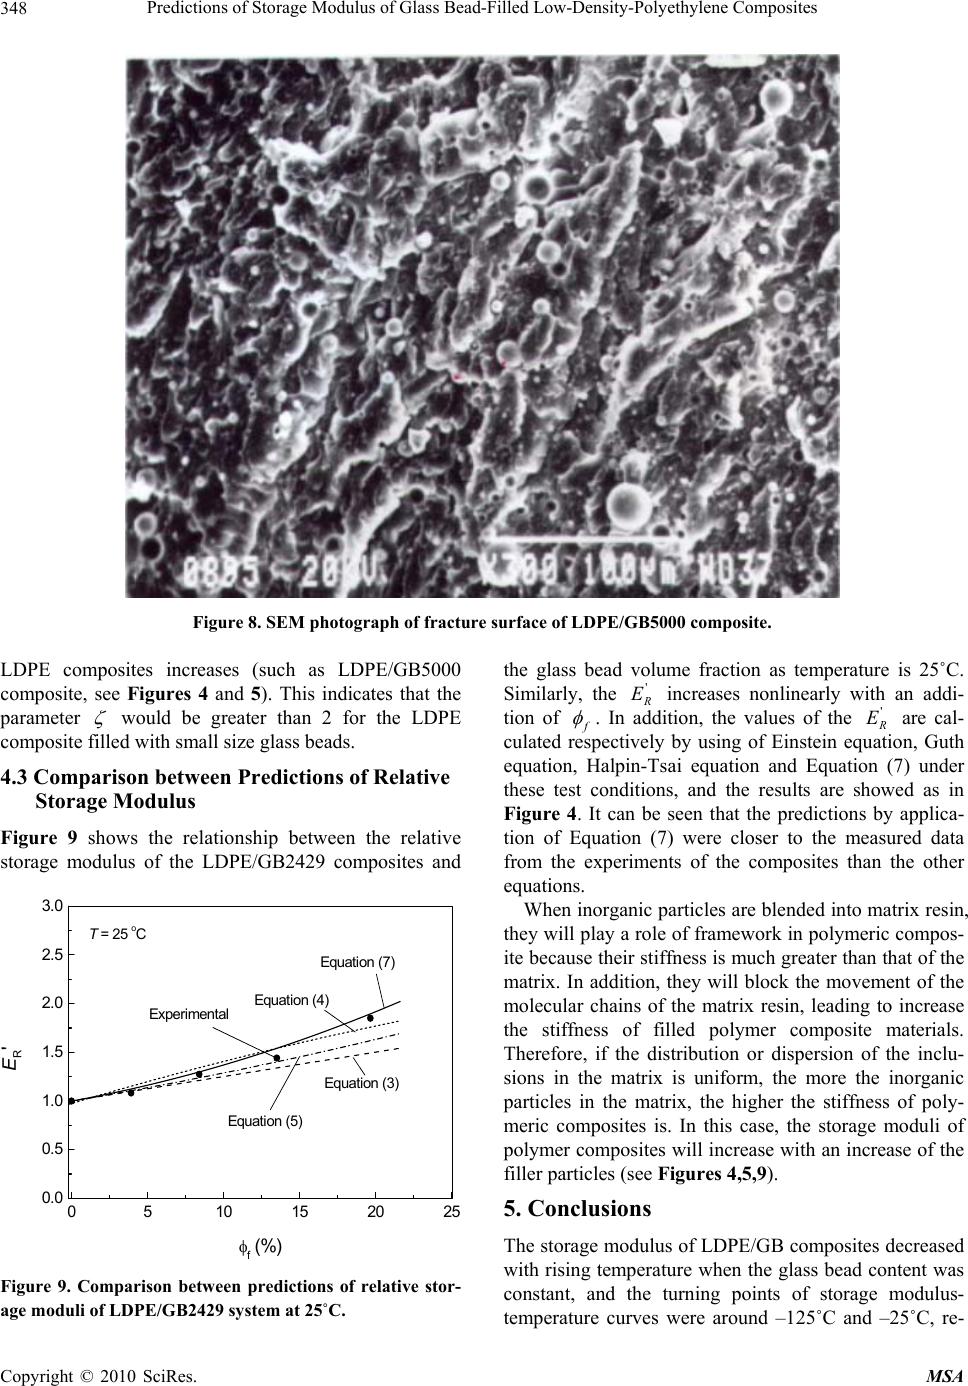 Predictions of Storage Modulus of Glass Bead-Filled Low-Density-Polyethylene Composites Copyright © 2010 SciRes. MSA 348 Figure 8. SEM photograph of fracture surface of LDPE/GB5000 composite. LDPE composites increases (such as LDPE/GB5000 composite, see Figures 4 and 5). This indicates that the parameter ζ would be greater than 2 for the LDPE composite filled with small size glass beads. the glass bead volume fraction as temperature is 25˚C. Similarly, the increases nonlinearly with an addi- tion of f ' R E φ . In addition, the values of the are cal- culated respectively by using of Einstein equation, Guth equation, Halpin-Tsai equation and Equation (7) under these test conditions, and the results are showed as in Figure 4. It can be seen that the predictions by applica- tion of Equation (7) were closer to the measured data from the experiments of the composites than the other equations. ' R E 4.3 Comparison between Predictions of Relative Storage Modulus Figure 9 shows the relationship between the relative storage modulus of the LDPE/GB2429 composites and 0510 15 20 25 0.0 0.5 1.0 1.5 2.0 2.5 3.0 T = 25 oC Experimental Equation (7) Equation (4) Eq ua tion (5) Equation (3) E R' φf (% ) When inorganic particles are blended into matrix resin, they will play a role of framework in polymeric compos- ite because their stiffness is much greater than that of the matrix. In addition, they will block the movement of the molecular chains of the matrix resin, leading to increase the stiffness of filled polymer composite materials. Therefore, if the distribution or dispersion of the inclu- sions in the matrix is uniform, the more the inorganic particles in the matrix, the higher the stiffness of poly- meric composites is. In this case, the storage moduli of polymer composites will increase with an increase of the filler particles (see Figures 4,5,9). 5. Conclusions The storage modulus of LDPE/GB composites decreased with rising temperature when the glass bead content was constant, and the turning points of storage modulus- temperature curves were around –125˚C and –25˚C, re- Figure 9. Comparison between predictions of relative stor- age moduli of LDPE/GB2429 system at 25˚C. 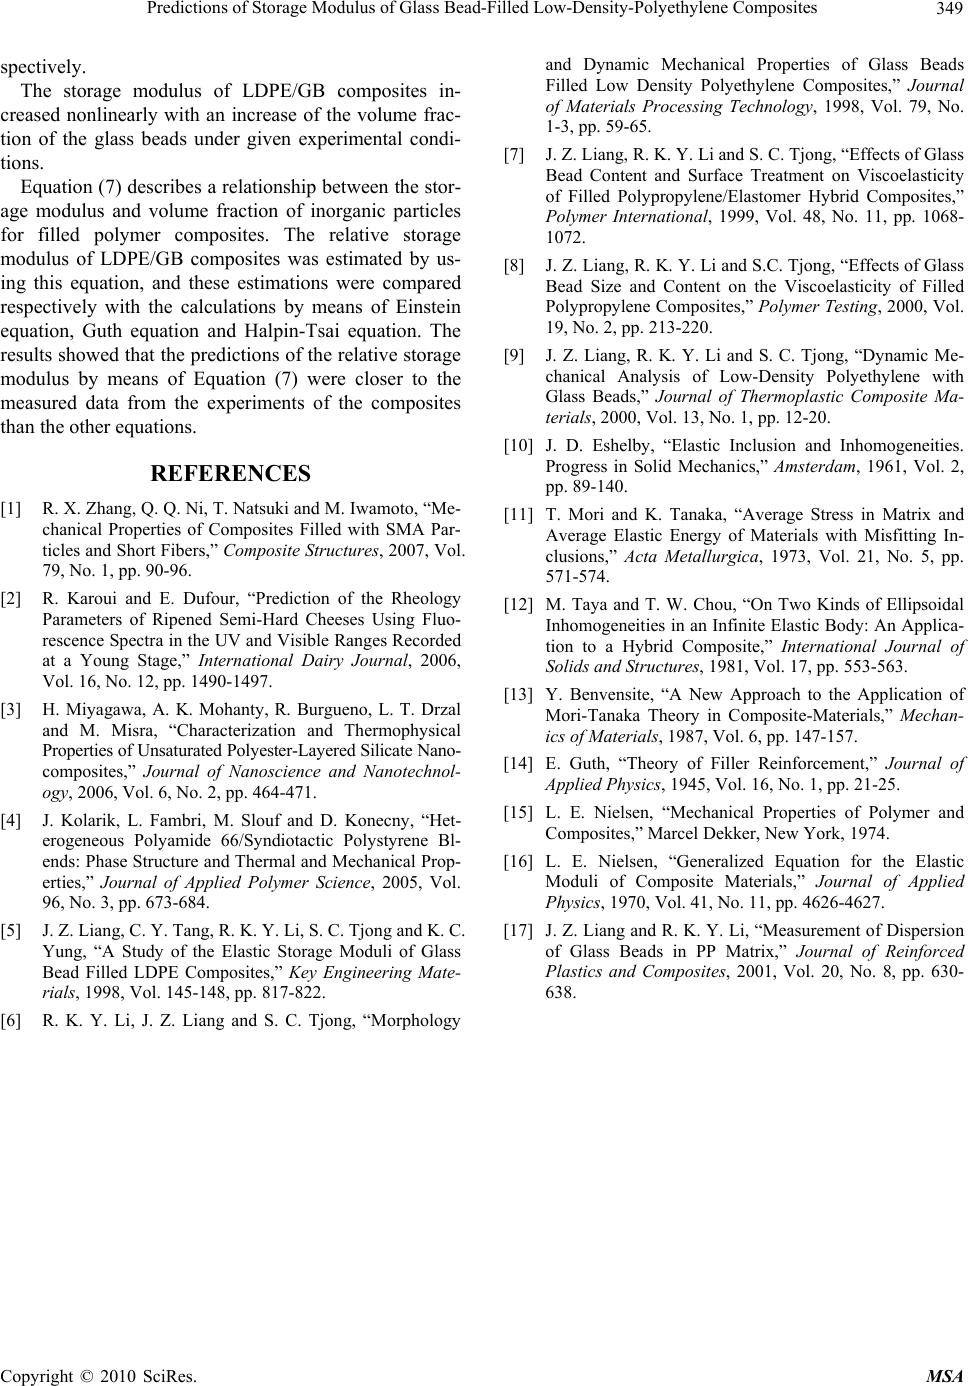 Predictions of Storage Modulus of Glass Bead-Filled Low-Density-Polyethylene Composites 349 spectively. The storage modulus of LDPE/GB composites in- creased nonlinearly with an increase of the volume frac- tion of the glass beads under given experimental condi- tions. Equation (7) describes a relationship between the stor- age modulus and volume fraction of inorganic particles for filled polymer composites. The relative storage modulus of LDPE/GB composites was estimated by us- ing this equation, and these estimations were compared respectively with the calculations by means of Einstein equation, Guth equation and Halpin-Tsai equation. The results showed that the predictio ns of the relative storage modulus by means of Equation (7) were closer to the measured data from the experiments of the composites than the othe r equat ions. REFERENCES [1] R. X. Zhang, Q. Q. Ni, T. Natsuki and M. Iwamoto, “Me- chanical Properties of Composites Filled with SMA Par- ticles and Short Fibers,” Composite Structures, 2007, Vol. 79, No. 1, pp. 90-96. [2] R. Karoui and E. Dufour, “Prediction of the Rheology Parameters of Ripened Semi-Hard Cheeses Using Fluo- rescence Spectra in the UV and Visible Ranges Recorded at a Young Stage,” International Dairy Journal, 2006, Vol. 16, No. 12, pp. 1490-1497. [3] H. Miyagawa, A. K. Mohanty, R. Burgueno, L. T. Drzal and M. Misra, “Characterization and Thermophysical Properties of Unsaturated Polyester-Layered Silicate Nano- composites,” Journal of Nanoscience and Nanotechnol- ogy, 2006, Vol. 6, No. 2, pp. 464-471. [4] J. Kolarik, L. Fambri, M. Slouf and D. Konecny, “Het- erogeneous Polyamide 66/Syndiotactic Polystyrene Bl- ends: Phase Structure and Thermal and Mechanical Prop- erties,” Journal of Applied Polymer Science, 2005, Vol. 96, No. 3, pp. 673-684. [5] J. Z. Liang, C. Y. Tang, R. K. Y. Li, S. C. Tjong and K. C. Yung, “A Study of the Elastic Storage Moduli of Glass Bead Filled LDPE Composites,” Key Engineering Mate- rials, 1998, Vol. 145-148, pp. 817-822. [6] R. K. Y. Li, J. Z. Liang and S. C. Tjong, “Morphology and Dynamic Mechanical Properties of Glass Beads Filled Low Density Polyethylene Composites,” Journal of Materials Processing Technology, 1998, Vol. 79, No. 1-3, pp. 59-65. [7] J. Z. Liang, R. K. Y. Li and S. C. Tjong, “Effects of Glass Bead Content and Surface Treatment on Viscoelasticity of Filled Polypropylene/Elastomer Hybrid Composites,” Polymer International, 1999, Vol. 48, No. 11, pp. 1068- 1072. [8] J. Z. Liang, R. K. Y. Li and S.C. Tjong, “Effects of Glass Bead Size and Content on the Viscoelasticity of Filled Polypropylene Composites,” Polymer Testing, 2000, Vol. 19, No. 2, pp. 213-220. [9] J. Z. Liang, R. K. Y. Li and S. C. Tjong, “Dynamic Me- chanical Analysis of Low-Density Polyethylene with Glass Beads,” Journal of Thermoplastic Composite Ma- terials, 2000, Vol. 13, No. 1, pp. 12-20. [10] J. D. Eshelby, “Elastic Inclusion and Inhomogeneities. Progress in Solid Mechanics,” Amsterdam, 1961, Vol. 2, pp. 89-140. [11] T. Mori and K. Tanaka, “Average Stress in Matrix and Average Elastic Energy of Materials with Misfitting In- clusions,” Acta Metallurgica, 1973, Vol. 21, No. 5, pp. 571-574. [12] M. Taya and T. W. Chou, “On Two Kinds of Ellipsoidal Inhomogeneities in an Infinite Elastic Body: An Applica- tion to a Hybrid Composite,” International Journal of Solids and Structures, 1981, Vol. 17, pp. 553-563. [13] Y. Benvensite, “A New Approach to the Application of Mori-Tanaka Theory in Composite-Materials,” Mechan- ics of Materials, 1987, Vol. 6, pp. 147-157. [14] E. Guth, “Theory of Filler Reinforcement,” Journal of Applied Physics, 1945, Vol. 16, No. 1, pp. 21-25. [15] L. E. Nielsen, “Mechanical Properties of Polymer and Composites,” Marcel Dekker, New York, 1974. [16] L. E. Nielsen, “Generalized Equation for the Elastic Moduli of Composite Materials,” Journal of Applied Physics, 1970, Vol. 41, No. 11, pp. 4626-4627. [17] J. Z. Liang and R. K. Y. Li, “Measurement of Dispersion of Glass Beads in PP Matrix,” Journal of Reinforced Plastics and Composites, 2001, Vol. 20, No. 8, pp. 630- 638. Copyright © 2010 SciRes. MSA |