P. T. NG 33
StatTools®, UNISTAT®, and XLSTAT©. With the ex-
ception of PopTools, which is written specifically to
analyze ecological models, these add-ins are commercial
products that have an annual single user license fee that
ranges from $40.00 for statistiXL© to $300.00 for UNI-
STAT®. In light of the ever rising textbook prices and
costs of attending colleges/universities, it will be valu-
able to the students, instructors and researchers to have
the freedom of using an Excel add-in that utilizes the
familiar interface of Excel, and offers a reliable and an
extended range of statistical procedures without having
to be burdened with the licensing cost.
XLR intends to serve this purpose by being a free
software version of an Excel add-in that includes a fuller
range of statistical procedures that are commonly cov-
ered in a typical Introductory Business Statistics course
and free the users from the constraints that come with
proprietary software. It attempts to achieve this by har-
nessing the power of th e popular free sof twar e R [14 ] -- a
language and environment for statistical computing and
graphics.
2. Design Approach and Philosophy
Reference [15] provides a utility, R-Excel interface, to
connect Excel to R. The R-Excel interface uses DCOM
to embed R into Excel. Component object model (COM)
is a technology used on Microsoft Windows platforms
for server applications (e.g., R) to expo se functionality o f
a component (set of objects, e.g., R functions) to client
applications (e.g., Excel). DCOM is the distributed ver-
sion of COM that makes COM objects (e.g., a set of R
functions) transparently available across a network of
computers.
Specifically, R-Excel provides three interface modes:
(1) scratchpad and data transfer mode, (2) macro mode,
and (3) spreadsheet mode. The first scatchpad and data
transfer mode is designed for power users who have a
reasonable amount of knowledge in R. We did not adopt
this interface mode in XLR. We want to shield the users
from all the details of R computations and coding so that
the users think that they are working in Excel not R. The
macro mode allows us to put any statistical procedures
written in R on an Excel menu or button via VBA for
Excel. This is the pre-dominant interface design in XLR.
The spreadsheet mode, which retains the automatic re-
calculation feature in Excel, is adop ted to rewrite a list of
commonly used Excel functions by making functional
calls to the corresponding R functions and, hence, enable
us to solve the notorious problems of incorrect handling
of delicate numerical problems in Excel as reported in
[5,7-10].
R has an extensive collection of statistical (linear and
nonlinear modeling, classical statistical tests, time-series
analysis, classification, clustering, etc.) and graphical
(box and whisker plots, pie charts, pairs plot, coplot, 3D
plot, forest plot, etc.) procedures and is highly extensible
through the add-on packages, which number more than
4,000 to date. This makes it perfectly suitable to act as
the computational engine for Excel in the COM para-
digm so that we do not have to be concerned about rein-
venting the wheels of statistical computing procedures.
In our XLR implementation, Excel (client application)
utilizes R (server application) as a computational com-
ponent object. The users are not expected to know any
programming in R. Our goal is that they should not even
be aware that R is involved at all. The distributed version
of COM will be explored in a future proj ect.
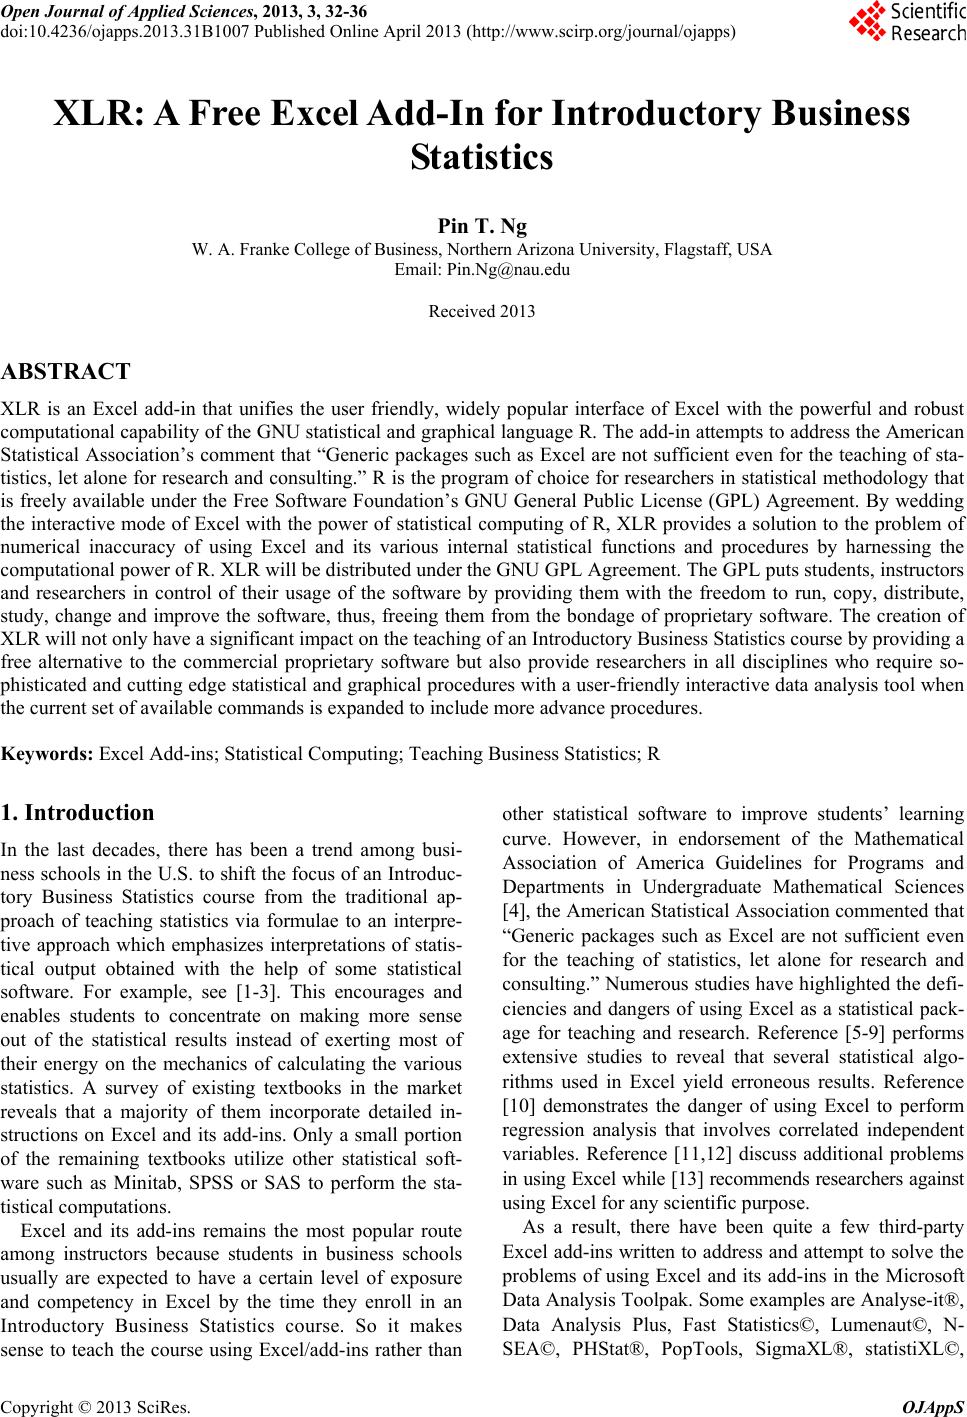
Whenever possible, we adhere to the feel and look of
the input dialogue box and output format of the various
tools in Excel’s Analysis ToolPak. This will help make
users feel more at home in their familiar Excel comput-
ing environment. Figure 1 and Figure 2 show the dia-
logue box and output for the Simple Linear Regression in
XLR. Users can see that they look very much like the
dialogue box and output of the Regression tool in EX-
CEL’s Analysis ToolPak.
Figure 1. Dialogue box for the Simple Linear Regression
command in XLR.
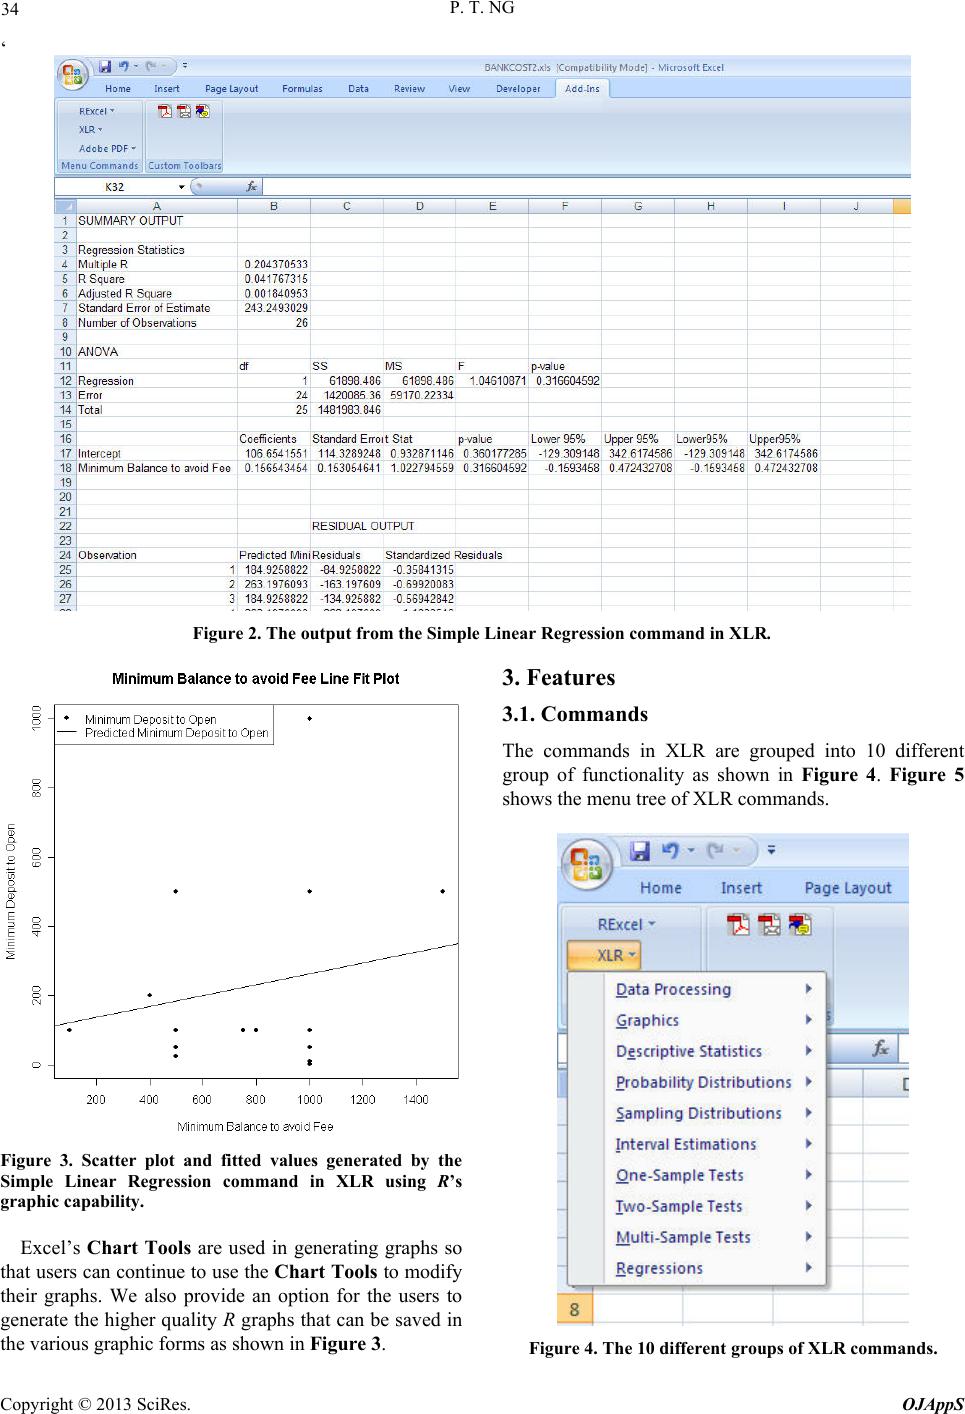
Copyright © 2013 SciRes. OJAppS