Paper Menu >>
Journal Menu >>
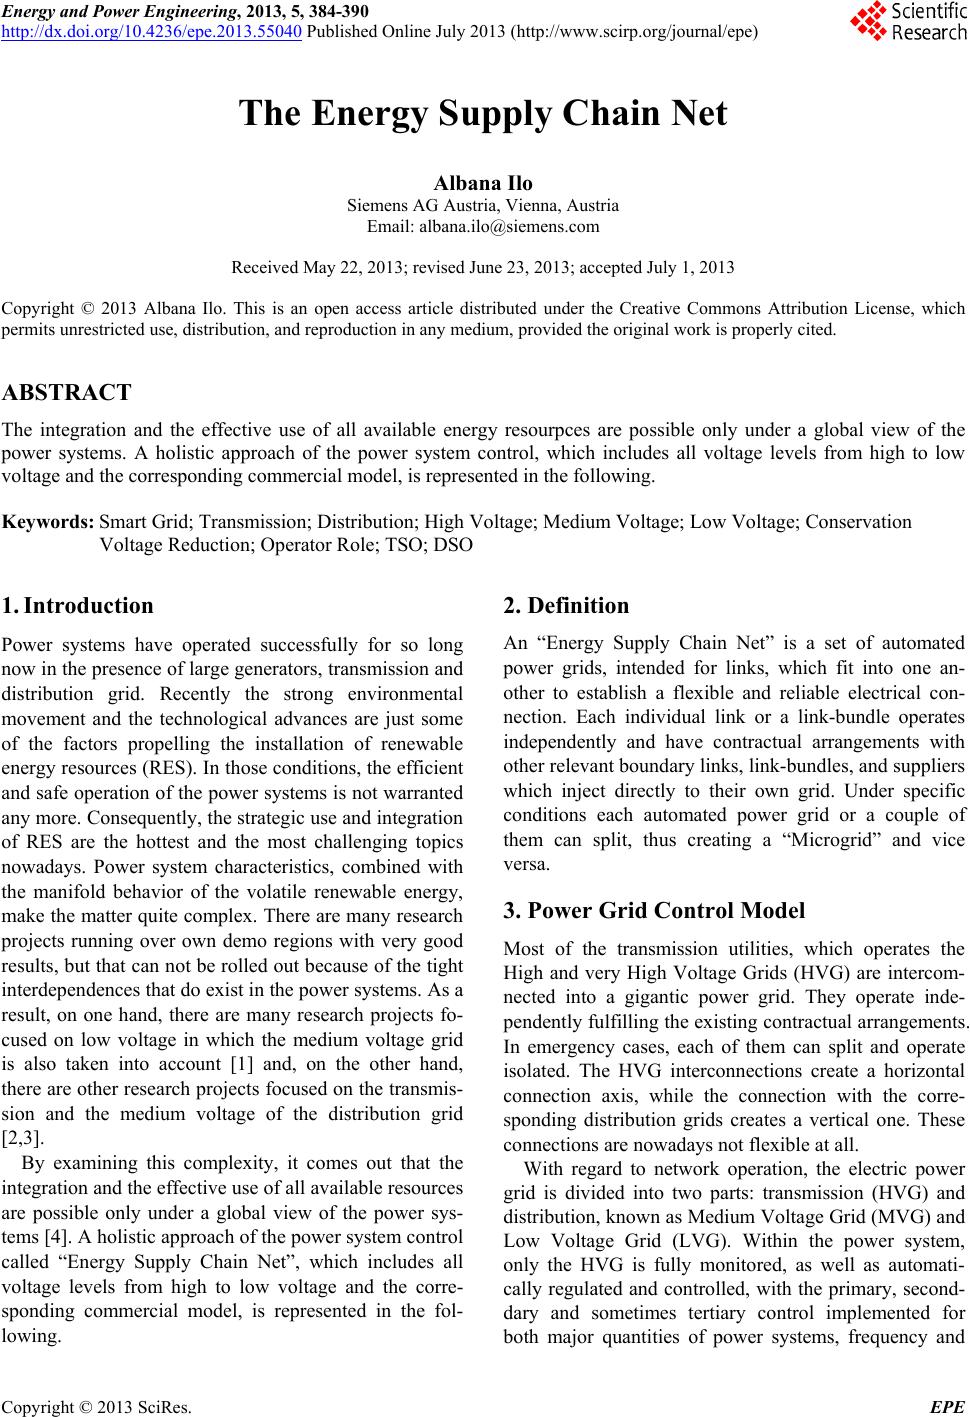 Energy and Power Engineering, 2013, 5, 384-390 http://dx.doi.org/10.4236/epe.2013.55040 Published Online July 2013 (http://www.scirp.org/journal/epe) The Energy Supply Chain Net Albana Ilo Siemens AG Austria, Vienna, Austria Email: albana.ilo@siemens.com Received May 22, 2013; revised June 23, 2013; accepted July 1, 2013 Copyright © 2013 Albana Ilo. This is an open access article distributed under the Creative Commons Attribution License, which permits unrestricted use, distribution, and reproduction in any medium, provided the original work is properly cited. ABSTRACT The integration and the effective use of all available energy resourpces are possible only under a global view of the power systems. A holistic approach of the power system control, which includes all voltage levels from high to low voltage and the corresponding commercial model, is represented in the following. Keywords: Smart Grid; Transmission; Distribution; High Voltage; Medium Voltage; Lo w Voltage; Conservation Voltage Reduction; Operator Role; TSO; DSO 1. Introduction Power systems have operated successfully for so long now in the presence of large generators, transmission and distribution grid. Recently the strong environmental movement and the technological advances are just some of the factors propelling the installation of renewable energy resources (RES). In those conditions, the efficient and safe operation of the power systems is not warranted any more. Consequently, the strategic use and integration of RES are the hottest and the most challenging topics nowadays. Power system characteristics, combined with the manifold behavior of the volatile renewable energy, make the matter quite complex. There are many research projects running over own demo regions with very good results, but that can not be rolled out because of the tight interdepend ences that do exist in the power systems. As a result, on one hand, there are many research projects fo- cused on low voltage in which the medium voltage grid is also taken into account [1] and, on the other hand, there are other research projects focused on the transmis- sion and the medium voltage of the distribution grid [2,3]. By examining this complexity, it comes out that the integration and the effectiv e use of all available resources are possible only under a global view of the power sys- tems [4]. A holistic approach of the power system control called “Energy Supply Chain Net”, which includes all voltage levels from high to low voltage and the corre- sponding commercial model, is represented in the fol- lowing. 2. Definition An “Energy Supply Chain Net” is a set of automated power grids, intended for links, which fit into one an- other to establish a flexible and reliable electrical con- nection. Each individual link or a link-bundle operates independently and have contractual arrangements with other relevant boundary links, link-bundles, and suppliers which inject directly to their own grid. Under specific conditions each automated power grid or a couple of them can split, thus creating a “Microgrid” and vice versa. 3. Power Grid Control Model Most of the transmission utilities, which operates the High and very High Voltage Grids (HVG) are intercom- nected into a gigantic power grid. They operate inde- pendently fulfilling the existing contractual arrangements. In emergency cases, each of them can split and operate isolated. The HVG interconnections create a horizontal connection axis, while the connection with the corre- sponding distribution grids creates a vertical one. These connections are nowadays not flexible at all. With regard to network operation, the electric power grid is divided into two parts: transmission (HVG) and distribution, kno wn as Med ium Vo ltage Grid ( MVG) and Low Voltage Grid (LVG). Within the power system, only the HVG is fully monitored, as well as automati- cally regulated and controlled, with the primary, second- dary and sometimes tertiary control implemented for both major quantities of power systems, frequency and C opyright © 2013 SciRes. EPE 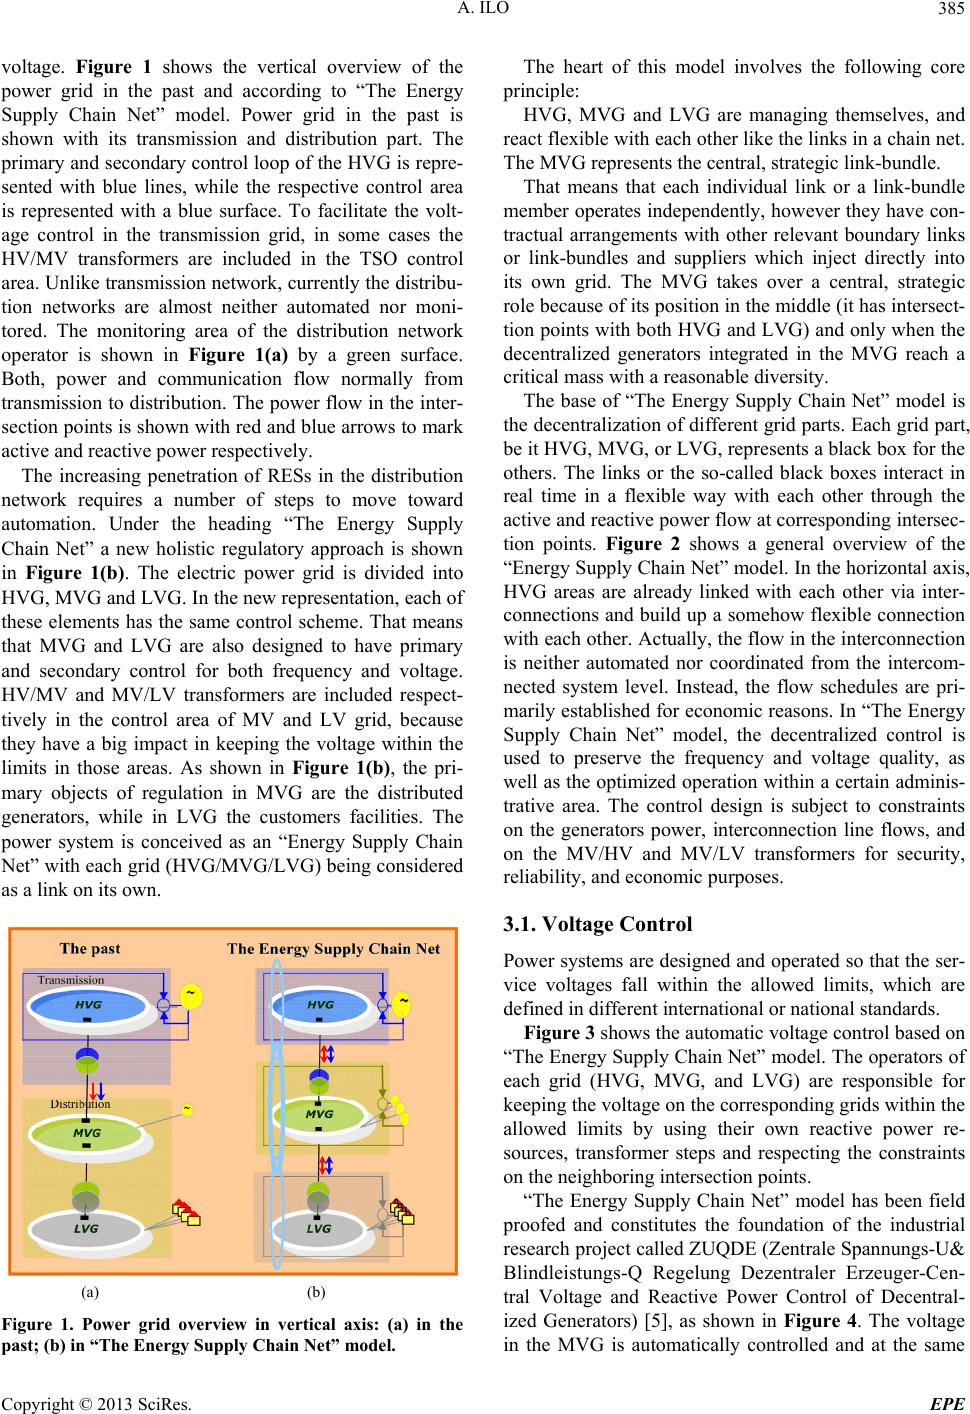 A. ILO 385 voltage. Figure 1 shows the vertical overview of the power grid in the past and according to “The Energy Supply Chain Net” model. Power grid in the past is shown with its transmission and distribution part. The primary and secondary control loop of the HVG is repre- sented with blue lines, while the respective control area is represented with a blue surface. To facilitate the volt- age control in the transmission grid, in some cases the HV/MV transformers are included in the TSO control area. Unlike transmission network, currently the distr ibu- tion networks are almost neither automated nor moni- tored. The monitoring area of the distribution network operator is shown in Figure 1(a) by a green surface. Both, power and communication flow normally from transmission to distribution. Th e power flow in the inter- section points is shown with red and blue arrows to mark active and reactive power respectively. The increasing penetration of RESs in the distribution network requires a number of steps to move toward automation. Under the heading “The Energy Supply Chain Net” a new holistic regulatory approach is shown in Figure 1(b). The electric power grid is divided into HVG, MVG and LVG. In the new representation, each of these elements has the same control scheme. That means that MVG and LVG are also designed to have primary and secondary control for both frequency and voltage. HV/MV and MV/LV transformers are included respect- tively in the control area of MV and LV grid, because they have a big impact in keeping the voltage within the limits in those areas. As shown in Figure 1(b), the pri- mary objects of regulation in MVG are the distributed generators, while in LVG the customers facilities. The power system is conceived as an “Energy Supply Chain Net” with each grid (HVG/MVG/LVG) being considered as a link on its own. (a) (b) Figure 1. Power grid overview in vertical axis: (a) in the past; (b) in “The Energy Supply Chain Net” model. The heart of this model involves the following core principle: HVG, MVG and LVG are managing themselves, and react flexible with each other like the links in a chain net. The MVG represents the central, strategic link-bundle. That means that each individual link or a link-bundle member operates independ ently, however they have con- tractual arrangements with other relevant boundary links or link-bundles and suppliers which inject directly into its own grid. The MVG takes over a central, strategic role because of its position in the middle (it has intersect- tion points with both HVG and LVG) and only when the decentralized generators integrated in the MVG reach a critical mass with a reasonable diversity. The base of “The Energy Supply Chain Net” model is the decentralization of different grid parts. Each grid part, be it HVG, MVG, or LVG, represents a black box for the others. The links or the so-called black boxes interact in real time in a flexible way with each other through the active and reactive pow er flow at corresponding in tersec- tion points. Figure 2 shows a general overview of the “Energy Supply Chain Net” model. In the horizon tal axis, HVG areas are already linked with each other via inter- connections and build up a somehow flexible connection with each other. Actually, the flow in the interconnection is neither automated nor coordinated from the intercom- nected system level. Instead, the flow schedules are pri- marily established for economic reasons. In “The Energy Supply Chain Net” model, the decentralized control is used to preserve the frequency and voltage quality, as well as the optimized operation within a certain adminis- trative area. The control design is subject to constraints on the generators power, interconnection line flows, and on the MV/HV and MV/LV transformers for security, reliability, and economic purposes. 3.1. Voltage Control Power systems are designed and operated so that the ser- vice voltages fall within the allowed limits, which are defined in different international or national standards. Figure 3 shows the automatic voltage control based on “The Energy Supply Chain Net” model. The operators of each grid (HVG, MVG, and LVG) are responsible for keeping the voltage on the correspond ing grid s within the allowed limits by using their own reactive power re- sources, transformer steps and respecting the constraints on the neighboring intersection points. “The Energy Supply Chain Net” model has been field proofed and constitutes the foundation of the industrial research project called ZUQDE (Zentrale Spannun gs-U& Blindleistungs-Q Regelung Dezentraler Erzeuger-Cen- tral Voltage and Reactive Power Control of Decentral- ized Generators) [5], as shown in Figure 4. The voltage n the MVG is automatically controlled and at the same i Copyright © 2013 SciRes. EPE 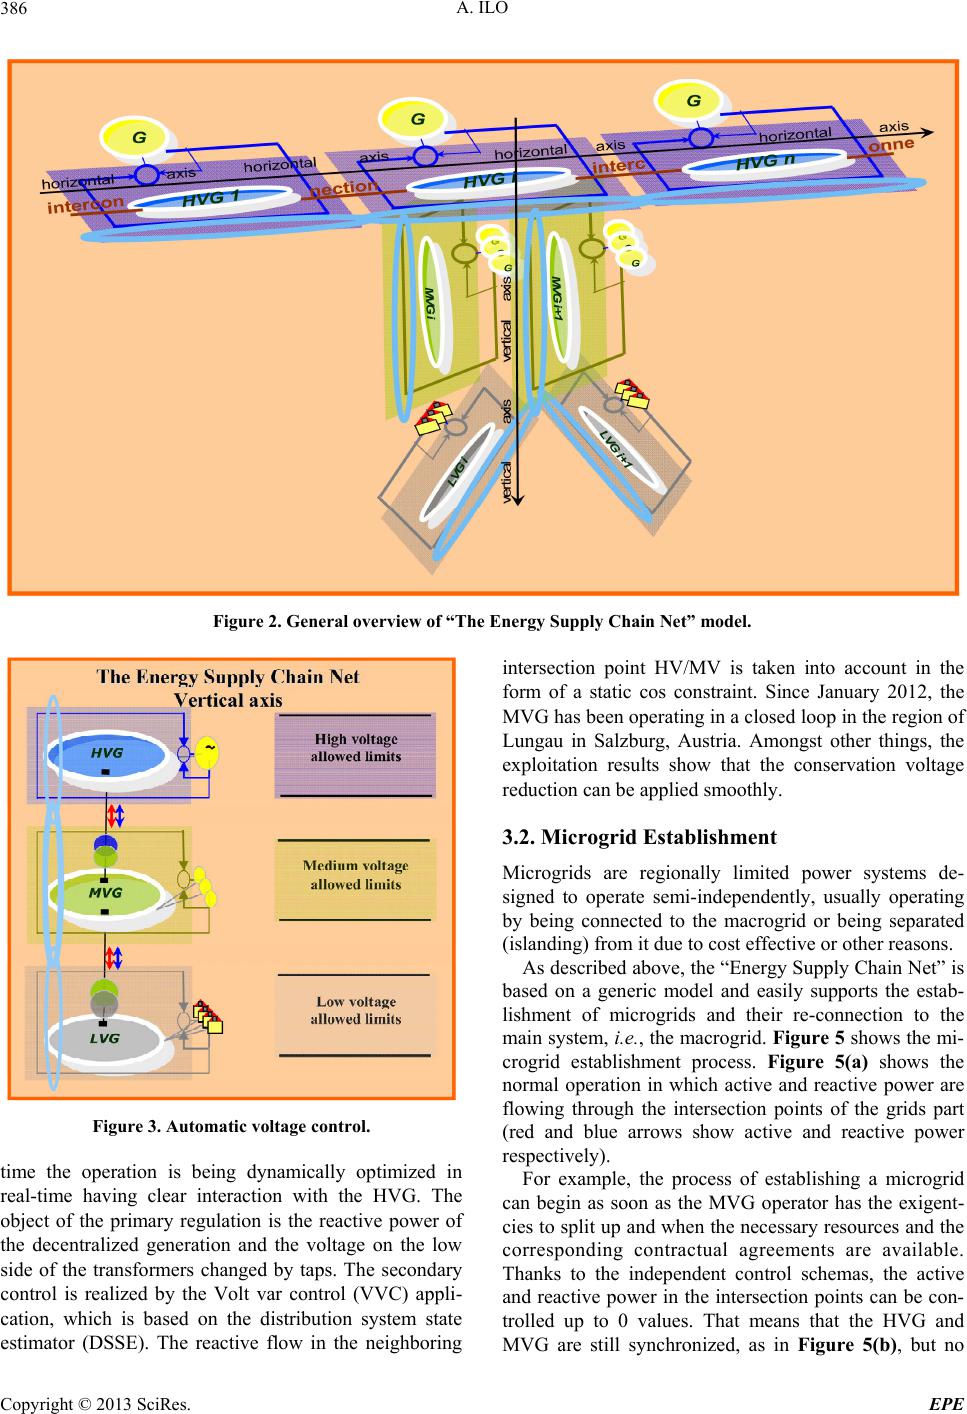 A. ILO Copyright © 2013 SciRes. EPE 386 Figure 2. General overview of “The Energy Supply Chain Net” model. Figure 3. Automatic voltage control. time the operation is being dynamically optimized in real-time having clear interaction with the HVG. The object of the primary regulation is the reactive power of the decentralized generation and the voltage on the low side of the transformers changed by taps. The secondary control is realized by the Volt var control (VVC) appli- cation, which is based on the distribution system state estimator (DSSE). The reactive flow in the neighboring intersection point HV/MV is taken into account in the form of a static cos constraint. Since January 2012, the MVG has been operating in a closed loop in the region of Lungau in Salzburg, Austria. Amongst other things, the exploitation results show that the conservation voltage reduction can be applied smoothly. 3.2. Microgrid Establishment Microgrids are regionally limited power systems de- signed to operate semi-independently, usually operating by being connected to the macrogrid or being separated (islanding) from it due to cost effective or other reasons. As described above, the “Energy Supply Chain Net” is based on a generic model and easily supports the estab- lishment of microgrids and their re-connection to the main system, i.e., the macrogrid. Figure 5 shows the mi- crogrid establishment process. Figure 5(a) shows the normal operation in which active and reactive power are flowing through the intersection points of the grids part (red and blue arrows show active and reactive power respectively). For example, the process of establishing a microgrid can begin as soon as the MVG operator has the exigent- cies to split up and when the necessary resources and the corresponding contractual agreements are available. Thanks to the independent control schemas, the active and reactive power in the intersection points can be con- trolled up to 0 values. That means that the HVG and VG are still synchronized, as in Figure 5(b), but no M 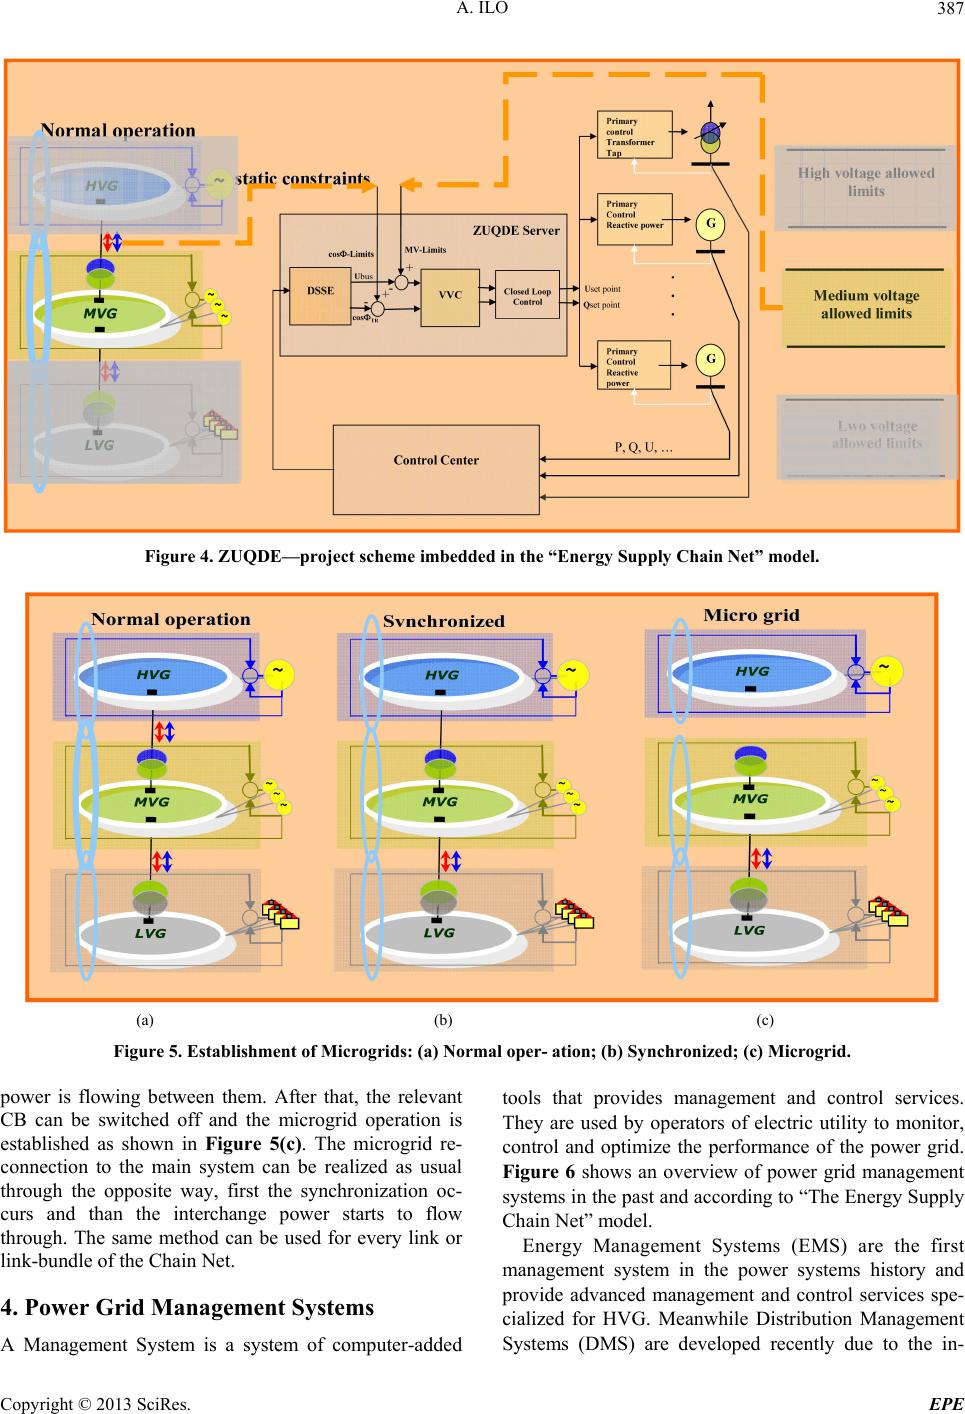 A. ILO 387 Figure 4. ZUQDE—project sche me imbe dde d in the “Energy Supply Chain Net” model. (a) (b) (c) Figure 5. Establishment of Microgrids: (a) Normal oper- ation; (b) Synchronized; (c) Microgrid. power is flowing between them. After that, the relevant CB can be switched off and the microgrid operation is established as shown in Figure 5(c). The microgrid re- connection to the main system can be realized as usual through the opposite way, first the synchronization oc- curs and than the interchange power starts to flow through. The same method can be used for every link or link-bundle of the Chain Net. 4. Power Grid Management Systems A Management System is a system of computer-added tools that provides management and control services. They are used by operators of electric utility to monitor, control and optimize the performance of the power grid. Figure 6 shows an overview of power grid management systems in the past and according to “The Energy Supply Chain Net” model. Energy Management Systems (EMS) are the first management system in the power systems history and provide advanced management and control services spe- cialized for HVG. Meanwhile Distribution Management Systems (DMS) are developed recently due to the in- Copyright © 2013 SciRes. EPE 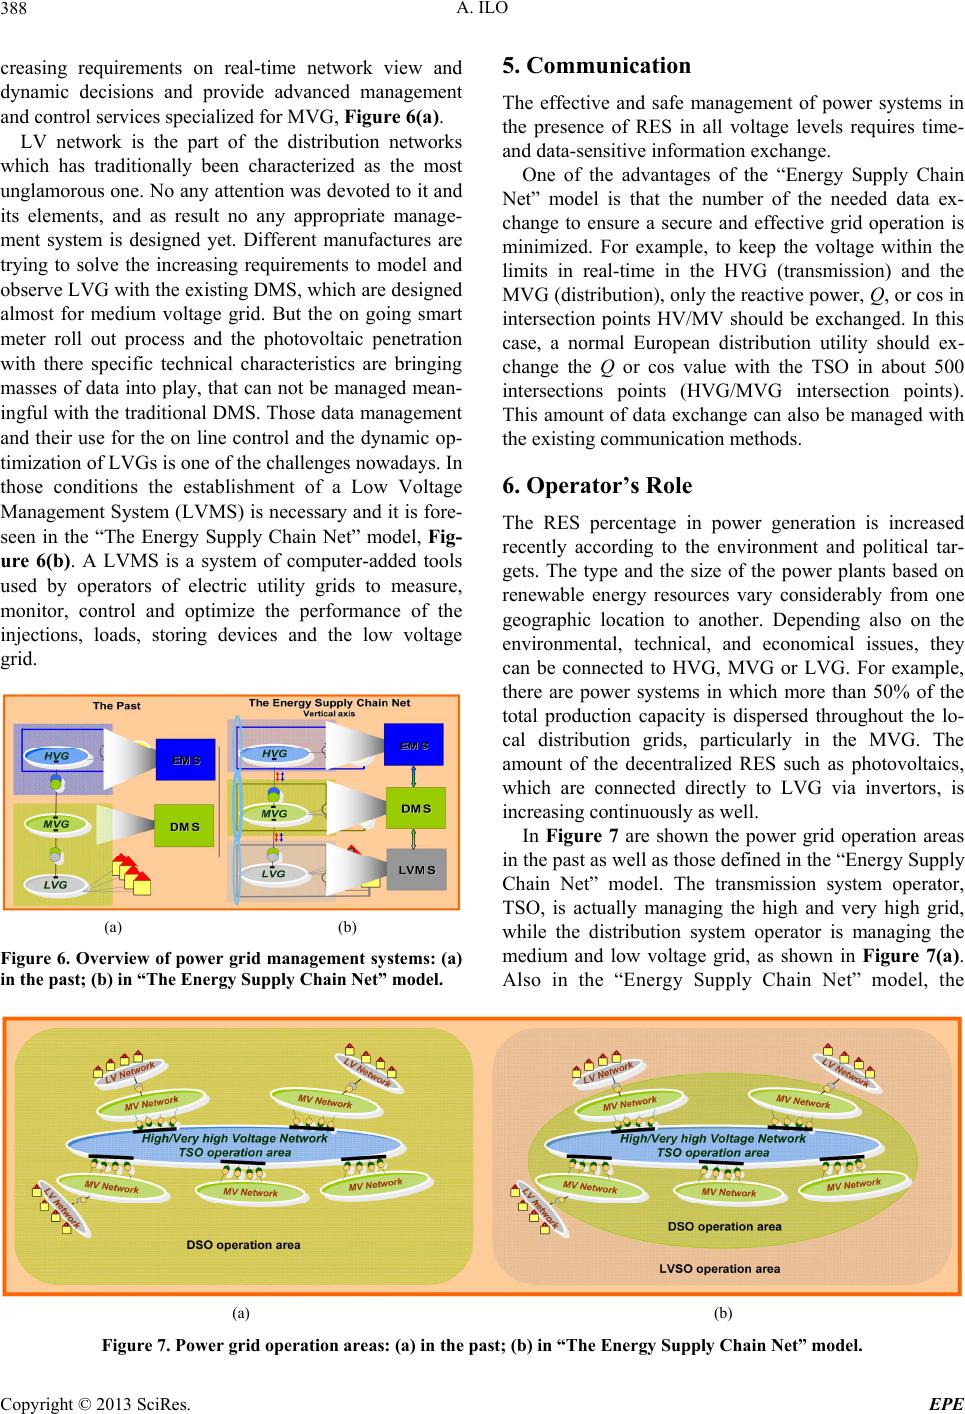 A. ILO 388 creasing requirements on real-time network view and dynamic decisions and provide advanced management and control services specialized for MVG, Fi gur e 6( a ) . LV network is the part of the distribution networks which has traditionally been characterized as the most unglamorous one. No any attention was devoted to it and its elements, and as result no any appropriate manage- ment system is designed yet. Different manufactures are trying to solve the increasing requirements to model and observe LVG with the existing DMS, which are designed almost for medium voltage grid. But the on going smart meter roll out process and the photovoltaic penetration with there specific technical characteristics are bringing masses of data into play, that can not be managed mean- ingful with the traditional DMS. Th ose data management and their use for the on line control and the dynamic op- timization of LVGs is one of the challenges nowadays. In those conditions the establishment of a Low Voltage Management System (LVMS) is necessary and it is fore- seen in the “The Energy Supply Chain Net” model, Fig- ure 6(b). A LVMS is a system of computer-added tools used by operators of electric utility grids to measure, monitor, control and optimize the performance of the injections, loads, storing devices and the low voltage grid. (a) (b) Figure 6. Overview of power grid management systems: (a) in the past; (b) in “The Energy Supply Chain Net” model. 5. Communication The effective and safe management of power systems in the presence of RES in all voltage levels requires time- and data-sensitive information exchange. One of the advantages of the “Energy Supply Chain Net” model is that the number of the needed data ex- change to ensure a secure and effective grid operation is minimized. For example, to keep the voltage within the limits in real-time in the HVG (transmission) and the MVG (distribution), only the reactive power, Q, or cos in intersection points HV/MV should be exchanged. In this case, a normal European distribution utility should ex- change the Q or cos value with the TSO in about 500 intersections points (HVG/MVG intersection points). This amount of data exchange can also be managed with the existing communication methods. 6. Operator’s Role The RES percentage in power generation is increased recently according to the environment and political tar- gets. The type and the size of the power plants based on renewable energy resources vary considerably from one geographic location to another. Depending also on the environmental, technical, and economical issues, they can be connected to HVG, MVG or LVG. For example, there are power systems in which more than 50% of the total production capacity is dispersed throughout the lo- cal distribution grids, particularly in the MVG. The amount of the decentralized RES such as photovoltaics, which are connected directly to LVG via invertors, is increasing continuously as well. In Figure 7 are shown the power grid operation areas in the past as well as those defined in the “Energy Supply Chain Net” model. The transmission system operator, TSO, is actually managing the high and very high grid, while the distribution system operator is managing the medium and low voltage grid, as shown in Figure 7(a). Also in the “Energy Supply Chain Net” model, the (a) (b) Figure 7. Power grid operation areas: (a) in th e past; (b) in “The Ene rgy Supply Chain Net” model. Copyright © 2013 SciRes. EPE 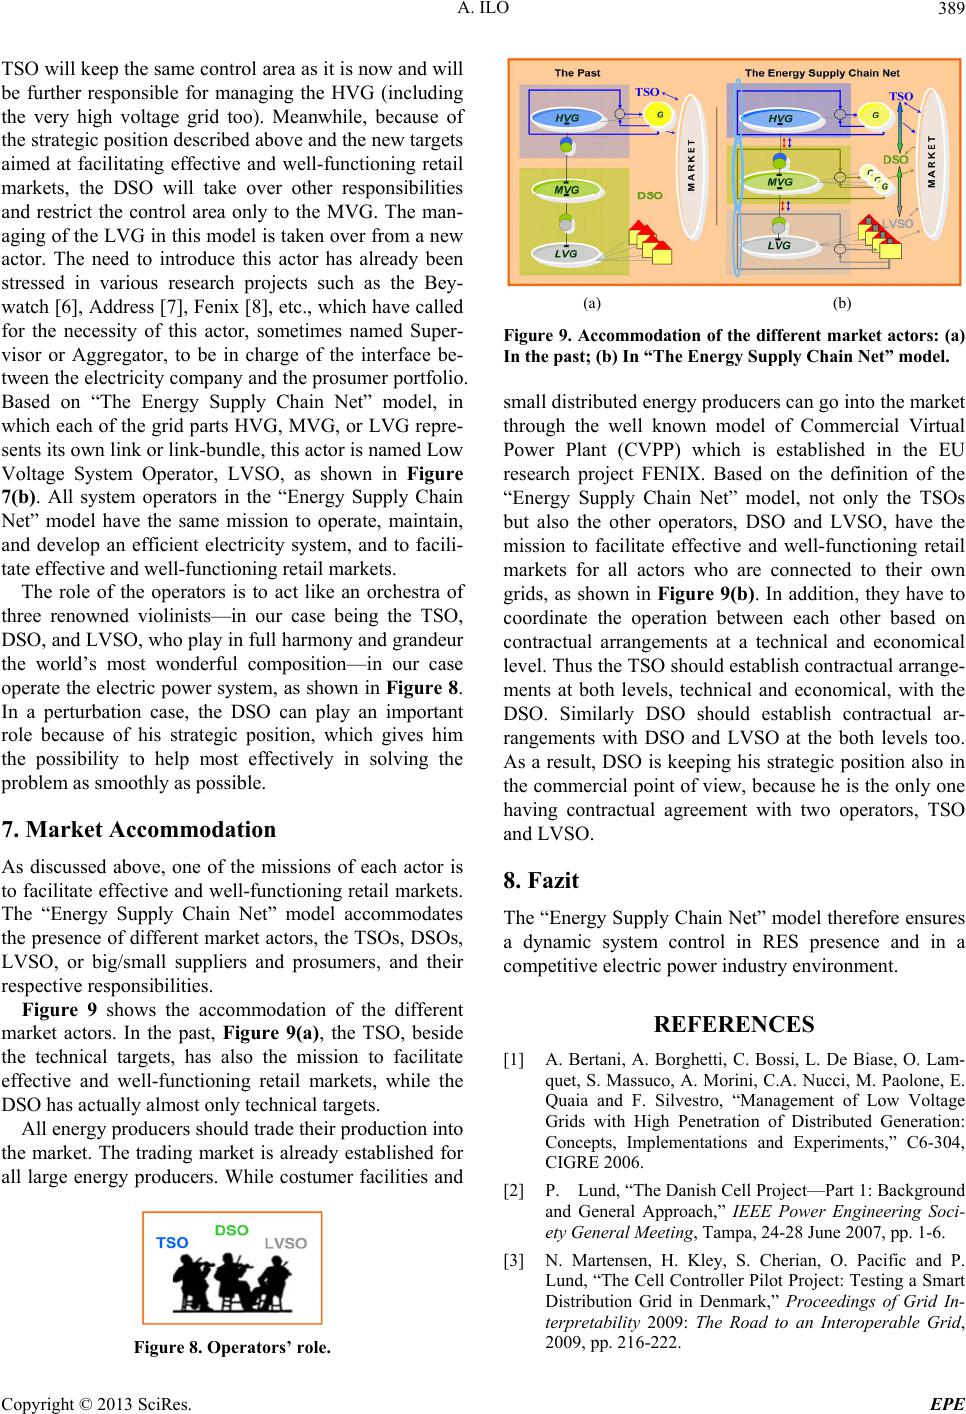 A. ILO 389 TSO will keep the same control area as it is now and will be further responsible for managing the HVG (including the very high voltage grid too). Meanwhile, because of the strategic position described above and the new targets aimed at facilitating effective and well-functioning retail markets, the DSO will take over other responsibilities and restrict the control area only to the MVG. The man- aging of the LVG in this model is take n over from a new actor. The need to introduce this actor has already been stressed in various research projects such as the Bey- watch [6], Address [7], Fenix [8], etc., which have called for the necessity of this actor, sometimes named Super- visor or Aggregator, to be in charge of the interface be- tween the electricity company and the prosumer portfolio. Based on “The Energy Supply Chain Net” model, in which each of the grid parts HVG, MVG, or LVG repre- sents its own link or link-bund le, this actor is named Low Voltage System Operator, LVSO, as shown in Figure 7(b). All system operators in the “Energy Supply Chain Net” model have the same mission to operate, maintain, and develop an efficient electricity system, and to facili- tate effective and well-functioning retail markets. The role of the operators is to act like an orchestra of three renowned violinists—in our case being the TSO, DSO, and LVSO, who play in full harmony and grandeur the world’s most wonderful composition—in our case operate the electric power system, as shown in Figure 8. In a perturbation case, the DSO can play an important role because of his strategic position, which gives him the possibility to help most effectively in solving the problem as smoothly as possible. 7. Market Accommodation As discussed above, one of the missions of each actor is to facilitate effective and well-functioning retail markets. The “Energy Supply Chain Net” model accommodates the presence of different market actors, the TSOs, DSOs, LVSO, or big/small suppliers and prosumers, and their respective responsibilities. Figure 9 shows the accommodation of the different market actors. In the past, Figure 9(a), the TSO, beside the technical targets, has also the mission to facilitate effective and well-functioning retail markets, while the DSO has actually almost only technical targets. All energy producers should trade their produ ction into the market. The trading market is already established for all large energy producers. While costumer facilities and Figure 8. Operators’ role. (a) (b) Figure 9. Accommodation of the different market actors: (a) In the past; (b) In “The Energy Supply Chain Net” model. small distributed energy producers can go into the market through the well known model of Commercial Virtual Power Plant (CVPP) which is established in the EU research project FENIX. Based on the definition of the “Energy Supply Chain Net” model, not only the TSOs but also the other operators, DSO and LVSO, have the mission to facilitate effective and well-functioning retail markets for all actors who are connected to their own grids, as shown in Figure 9(b). In addition, they have to coordinate the operation between each other based on contractual arrangements at a technical and economical level. Thus the TSO shou ld establish contractu al arrange- ments at both levels, technical and economical, with the DSO. Similarly DSO should establish contractual ar- rangements with DSO and LVSO at the both levels too. As a result, DSO is keeping his strategic position also in the commercial point of view, because he is the only one having contractual agreement with two operators, TSO and LVSO. 8. Fazit The “Energy Supply Chain Net” model therefore ensures a dynamic system control in RES presence and in a competitive electric power industry environment. REFERENCES [1] A. Bertani, A. Borghetti, C. Bossi, L. De Biase, O. Lam- quet, S. Massuco, A. Morini, C.A. Nucci, M. Paolone, E. Quaia and F. Silvestro, “Management of Low Voltage Grids with High Penetration of Distributed Generation: Concepts, Implementations and Experiments,” C6-304, CIGRE 2006. [2] P. Lund, “The Danish Cell Project—Part 1: Background and General Approach,” IEEE Power Engineering Soci- ety General Meeti n g, Tampa, 24-28 June 2007, pp. 1-6. [3] N. Martensen, H. Kley, S. Cherian, O. Pacific and P. Lund, “The Cell Controller Pilot Project: Testing a Smart Distribution Grid in Denmark,” Proceedings of Grid In- terpretability 2009: The Road to an Interoperable Grid, 2009, pp. 216-222. Copyright © 2013 SciRes. EPE  A. ILO 390 [4] A. Ilo, “The New Electricity Age,” 6th Spectrum Power User Group Conference, Rome, 26-28 October 2011, pp. 1-16. [5] A. Ilo, W. Schaffer, T. Rieder and I. Dzafic, “Dynamische Optimierung der Verteilnetze—Closed Loop Betrieber- gebnisse,” VDE Kongress, Stuttgart, 5-6 November 2012, pp. 184-189. [6] “Design and Implementation of the BeyWatch Super- wisor,” FP7-ICT-22388, BeyWatch. [7] ADD-WP1_ADDRESS_scenarios-v1.0. www.addressfp7.org [8] J. Corera, “Virtual Power Plant Concept in Electrical Networks,” 2nd International Conference on Integration of Renewable and Distributed Energy Resources, Napa, 4-8 December 2006, pp. 1-16. Copyright © 2013 SciRes. EPE |