Paper Menu >>
Journal Menu >>
 Energy and Power Engineering, 2013, 5, 377-383 http://dx.doi.org/10.4236/epe.2013.55039 Published Online July 2013 (http://www.scirp.org/journal/epe) Power Quality Consideration for Off-Grid Renewable Energy Systems Mojgan Hojabri1, Arash Toudeshki2 1Faculty of Electrical and Electronics Engineering, University Malaysia Pahang (UMP), Pekan, Malaysia 2Department of Electrical and Electronic Engineering, University Putra Malaysia (UPM), Serdang, Malaysia Email: mojganhojabri@ump.edu.my Received April 11, 2013; revised May 12, 2013; accepted May 20, 2013 Copyright © 2013 Mojgan Hojabri, Arash Toudeshki. This is an open access article distributed under the Creative Commons Attri- bution License, which permits unrestricted use, distribution, and reproduction in any medium, provided the original work is properly cited. ABSTRACT Necessity of electricity access in remote area is the main reason for expanding decentralized energy system such as stand-alone power systems. The best electrical power supply must provide a constant magnitude and frequency voltage. Therefore, good power quality is an important factor for the reliable operation of electrical loads in a power system. However, the current drawn by most of electronic devices and non-linear loads are non-sinusoidal, which can result in a poor power quality, especially in off-grid power systems. Poor power quality is characterized by electrical disturbances such as transients, sags, swells, harmonics and even interruptions in the power supply. Off-grid power systems world- wide often struggle with system failures and equipment damage due to poor power quality. In this paper, MAT- LAB/Simulink is used to model and analyses power quality in an off-grid renewable energy system. The results show high voltage transient when the inductive loads were switched OFF. The voltage and current harmonics are also deter- mined and compared for various types of loads. Keywords: Off-Grid Renewable Energy System; Power Quality; Pulse Width Modulation (PWM) Inverters; Total Harmonic Distortion; Total Demand Distortion 1. Introduction Energy demand increasing makes important problems such as grid instability or even outage. Therefore, more energy must be generated at the grid. However, energy generation by big plant is not economically. Moreover, implementation of distributed generation is rapidly in- creased. Because of increasing global warming, limita- tion and high cost of fossil fuel sources, governments tend to increase use and implementation of renewable energy sources. The main difference between renewable energy and fossil fuels systems is up-front cost versus lifelong energy cost. Currently, in most development countries, governments as well as utilities provide a vari- ety of incentives, to help the renewable energy industry reach to a higher economic scale. Figure 1 shows the annual growth rates of renewable energies in the world between 2006 and 2011 [1]. Solar/photovoltaic, wind, hydro, geothermal, tidal, wave and bio energy are exam- ples of renewable energy sources which the solar/ photovoltaic and wind are most popular among them. However, environmental friendly is the principal advantage of renewable energies, high up-front cost and uncontrollability are the main disadvantages of it [2]. Renewable energy sources can be used as an off-grid or on-grid systems. An off-grid renewable energy system is typically a stand-alone power system located in a remote area to fulfill residential or commercial power needs. Because of the high installation price and technical problems for supplying utility power in remote area, this type of power system is useful and also isolated from the power grid system. The main objectives of this paper are to create a simulation of a typical off-grid system and study the power quality issues through the simulation. Moreover, it determines the issues and impacts of poor power quality issues on various types of linear and non-linear loads. The organization of this paper follows the structure of off-grid power system, power quality considerations, simulation with the concluded remarks. 2. Structure of Off-Grid Power System A typical off-grid system is shown in Figure 2. As it is shown in this figure, an off-grid renewable energy C opyright © 2013 SciRes. EPE 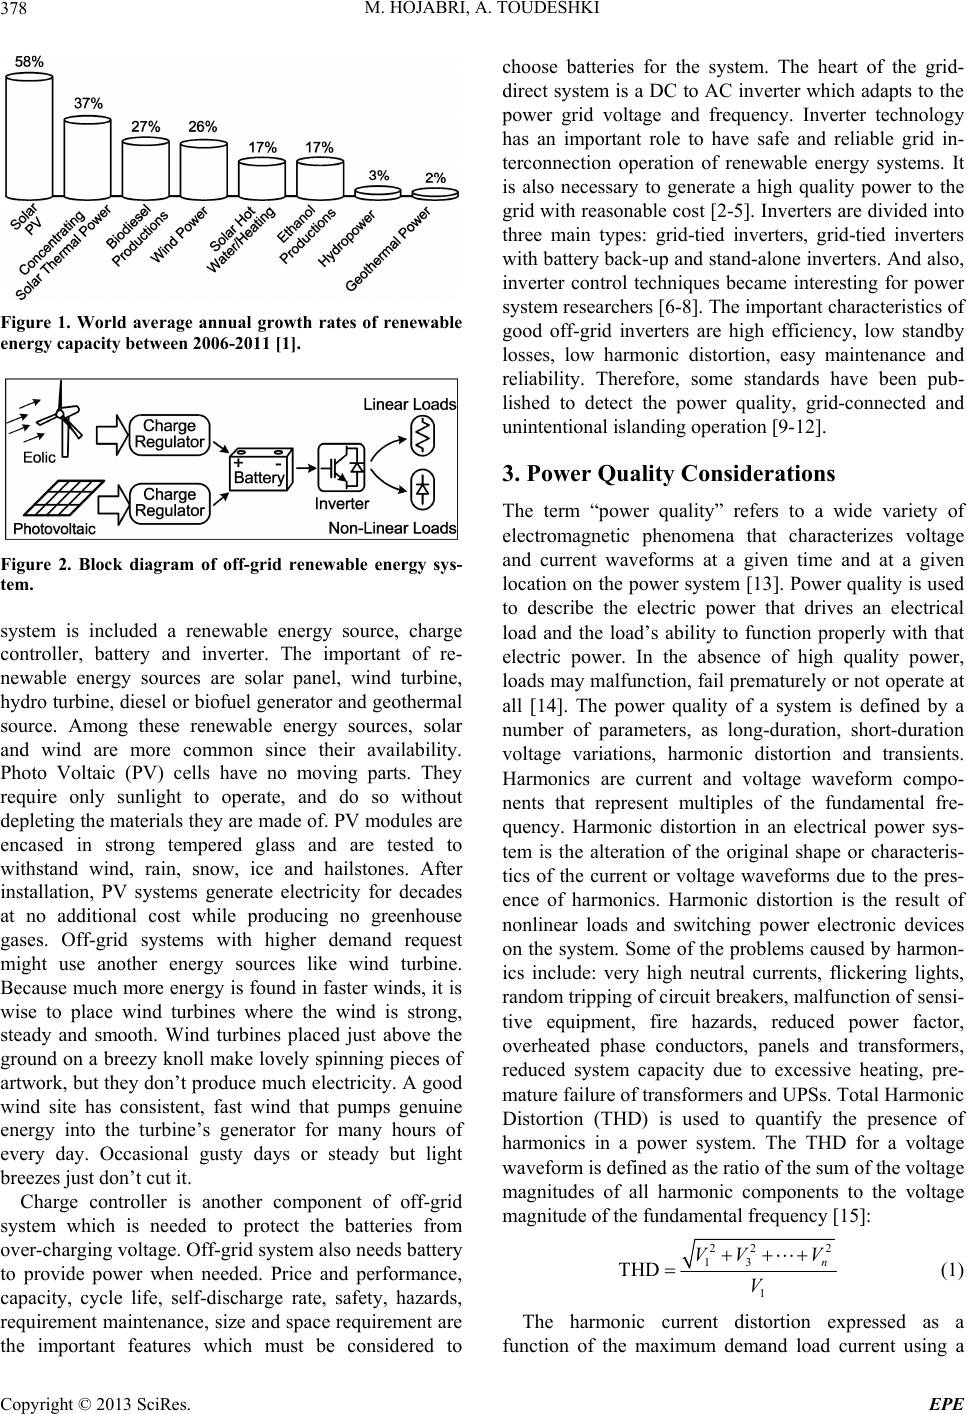 M. HOJABRI, A. TOUDESHKI 378 Figure 1. World average annual growth rates of renewable energy capacity between 2006-2011 [1]. Figure 2. Block diagram of off-grid renewable energy sys- tem. system is included a renewable energy source, charge controller, battery and inverter. The important of re- newable energy sources are solar panel, wind turbine, hydro turbine, diesel or biofuel generator and geothermal source. Among these renewable energy sources, solar and wind are more common since their availability. Photo Voltaic (PV) cells have no moving parts. They require only sunlight to operate, and do so without depleting the materials they are made of. PV modules are encased in strong tempered glass and are tested to withstand wind, rain, snow, ice and hailstones. After installation, PV systems generate electricity for decades at no additional cost while producing no greenhouse gases. Off-grid systems with higher demand request might use another energy sources like wind turbine. Because much more energy is found in faster winds, it is wise to place wind turbines where the wind is strong, steady and smooth. Wind turbines placed just above the ground on a breezy knoll make lovely spinning pieces of artwork, but they don’t produce much electricity. A good wind site has consistent, fast wind that pumps genuine energy into the turbine’s generator for many hours of every day. Occasional gusty days or steady but light breezes just don’t cut it. Charge controller is another component of off-grid system which is needed to protect the batteries from over-charging voltage. Off-grid system also needs battery to provide power when needed. Price and performance, capacity, cycle life, self-discharge rate, safety, hazards, requirement maintenance, size and space requirement are the important features which must be considered to choose batteries for the system. The heart of the grid- direct system is a DC to AC inverter which adapts to the power grid voltage and frequency. Inverter technology has an important role to have safe and reliable grid in- terconnection operation of renewable energy systems. It is also necessary to generate a high quality power to the grid with reasonable cost [2-5]. Inverters are divided into three main types: grid-tied inverters, grid-tied inverters with battery back-up and stand-alone inverters. And also, inverter control techniques became interesting for power system researchers [6-8]. The important characteristics of good off-grid inverters are high efficiency, low standby losses, low harmonic distortion, easy maintenance and reliability. Therefore, some standards have been pub- lished to detect the power quality, grid-connected and unintentional islanding operation [9-12]. 3. Power Quality Considerations The term “power quality” refers to a wide variety of electromagnetic phenomena that characterizes voltage and current waveforms at a given time and at a given location on the power system [13]. Power quality is used to describe the electric power that drives an electrical load and the load’s ability to function properly with that electric power. In the absence of high quality power, loads may malfunction, fail prematurely or not operate at all [14]. The power quality of a system is defined by a number of parameters, as long-duration, short-duration voltage variations, harmonic distortion and transients. Harmonics are current and voltage waveform compo- nents that represent multiples of the fundamental fre- quency. Harmonic distortion in an electrical power sys- tem is the alteration of the original shape or characteris- tics of the current or voltage waveforms due to the pres- ence of harmonics. Harmonic distortion is the result of nonlinear loads and switching power electronic devices on the system. Some of the problems caused by harmon- ics include: very high neutral currents, flickering lights, random tripping of circuit breakers, malfunction of sensi- tive equipment, fire hazards, reduced power factor, overheated phase conductors, panels and transformers, reduced system capacity due to excessive heating, pre- mature failure of transformers and UPSs. Total Harmonic Distortion (THD) is used to quantify the presence of harmonics in a power system. The THD for a voltage waveform is defined as the ratio of the sum of the voltage magnitudes of all harmonic components to the voltage magnitude of the fundamental frequency [15]: 22 2 13 1 THD n VV V V (1) The harmonic current distortion expressed as a function of the maximum demand load current using a Copyright © 2013 SciRes. EPE 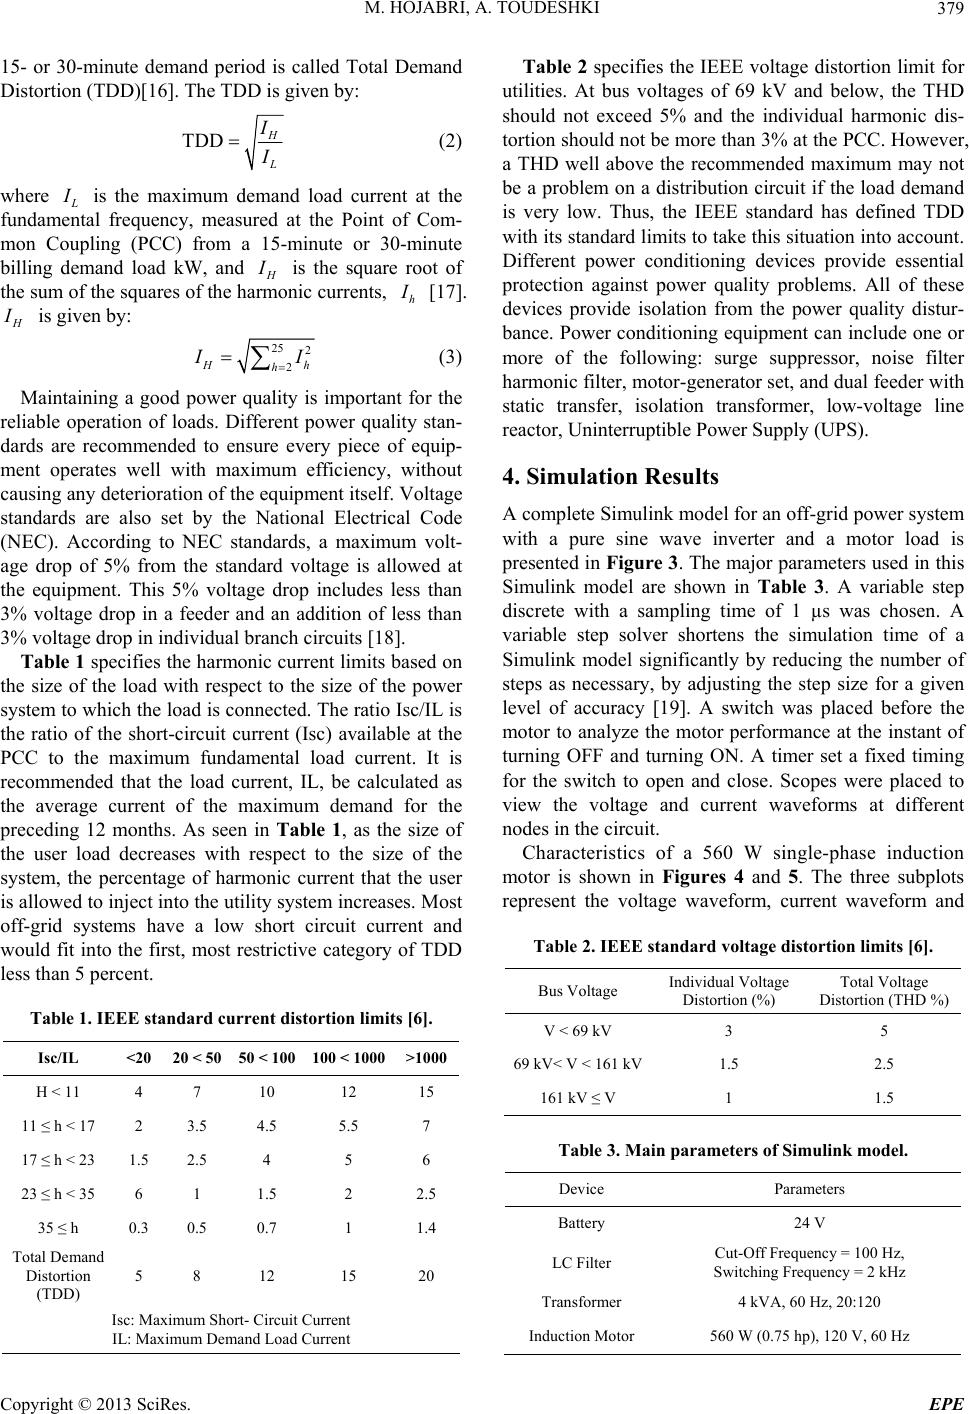 M. HOJABRI, A. TOUDESHKI 379 15- or 30-minute demand period is called Total Demand Distortion (TDD)[16]. The TDD is given by: TDD H L I (2) I where L I is the maximum demand load current at the fundamental frequency, measured at the Point of Com- mon Coupling (PCC) from a 15-minute or 30-minute billing demand load kW, and H I is the square root of the sum of the squares of the harmonic currents, h I [17]. H I is given by: 25 2 2 H h h I I (3) Maintaining a good power quality is important for the reliable operation of loads. Different power quality stan- dards are recommended to ensure every piece of equip- ment operates well with maximum efficiency, without causing any deterioration of the equipment itself. Voltage standards are also set by the National Electrical Code (NEC). According to NEC standards, a maximum volt- age drop of 5% from the standard voltage is allowed at the equipment. This 5% voltage drop includes less than 3% voltage drop in a feeder and an addition of less than 3% voltage drop in individual branch circuits [18]. Table 1 specifies the harmonic current limits based on the size of the load with respect to the size of the power system to which the load is connected. The ratio Isc/IL is the ratio of the short-circuit current (Isc) available at the PCC to the maximum fundamental load current. It is recommended that the load current, IL, be calculated as the average current of the maximum demand for the preceding 12 months. As seen in Table 1, as the size of the user load decreases with respect to the size of the system, the percentage of harmonic current that the user is allowed to inject into the utility system increases. Most off-grid systems have a low short circuit current and would fit into the first, most restrictive category of TDD less than 5 percent. Table 1. IEEE standard current distortion limits [6]. Isc/IL <20 20 < 50 50 < 100 100 < 1000>1000 H < 11 4 7 10 12 15 11 ≤ h < 17 2 3.5 4.5 5.5 7 17 ≤ h < 23 1.5 2.5 4 5 6 23 ≤ h < 35 6 1 1.5 2 2.5 35 ≤ h 0.3 0.5 0.7 1 1.4 Total Demand Distortion (TDD) 5 8 12 15 20 Isc: Maximum Short- Circuit Current IL: Maximum Demand Load Current Table 2 specifies the IEEE voltage distortion limit for utilities. At bus voltages of 69 kV and below, the THD should not exceed 5% and the individual harmonic dis- tortion should not be more than 3% at the PCC. However, a THD well above the recommended maximum may not be a problem on a distribution circuit if the load demand is very low. Thus, the IEEE standard has defined TDD with its standard limits to take this situation into account. Different power conditioning devices provide essential protection against power quality problems. All of these devices provide isolation from the power quality distur- bance. Power conditioning equipment can include one or more of the following: surge suppressor, noise filter harmonic filter, motor-generator set, and dual feeder with static transfer, isolation transformer, low-voltage line reactor, Uninterruptible Power Supply (UPS). 4. Simulation Results A complete Simulink model for an off-grid power system with a pure sine wave inverter and a motor load is presented in Figure 3. The major parameters used in this Simulink model are shown in Table 3. A variable step discrete with a sampling time of 1 µs was chosen. A variable step solver shortens the simulation time of a Simulink model significantly by reducing the number of steps as necessary, by adjusting the step size for a given level of accuracy [19]. A switch was placed before the motor to analyze the motor performance at the instant of turning OFF and turning ON. A timer set a fixed timing for the switch to open and close. Scopes were placed to view the voltage and current waveforms at different nodes in the circuit. Characteristics of a 560 W single-phase induction motor is shown in Figures 4 and 5. The three subplots represent the voltage waveform, current waveform and Table 2. IEEE standard voltage distortion limits [6]. Bus Voltage Individual Voltage Distortion (%) Total Voltage Distortion (THD %) V < 69 kV 3 5 69 kV< V < 161 kV1.5 2.5 161 kV ≤ V 1 1.5 Table 3. Main parameters of Simulink model. Device Parameters Battery 24 V LC Filter Cut-Off Frequency = 100 Hz, Switching Frequency = 2 kHz Transformer 4 kVA, 60 Hz, 20:120 Induction Motor 560 W (0.75 hp), 120 V, 60 Hz Copyright © 2013 SciRes. EPE 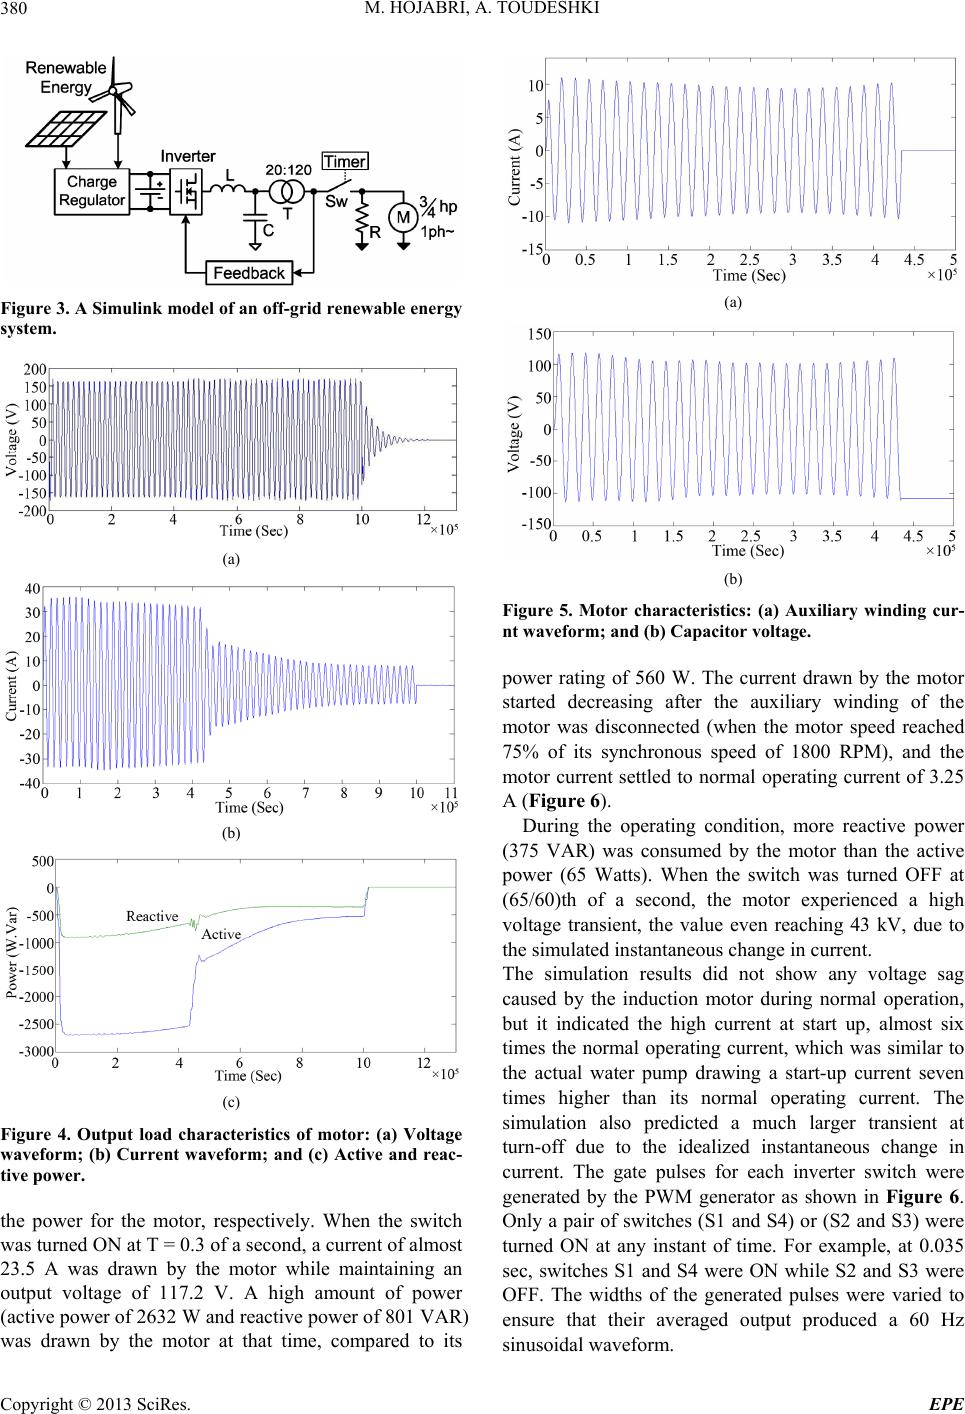 M. HOJABRI, A. TOUDESHKI 380 Figure 3. A Simulink model of an off-grid renewable energy system. (a) (b) (c) Figure 4. Output load characteristics of motor: (a) Voltage waveform; (b) Current waveform; and (c) Active and reac- tive power. the power for the motor, respectively. When the switch was turned ON at T = 0.3 of a second, a current of almost 23.5 A was drawn by the motor while maintaining an output voltage of 117.2 V. A high amount of power (active power of 2632 W and reactive power of 801 VAR) was drawn by the motor at that time, compared to its (a) (b) Figure 5. Motor characteristics: (a) Auxiliary winding cur- nt waveform; and (b) Capacitor voltage. power rating of 560 W. The current drawn by the motor started decreasing after the auxiliary winding of the motor was disconnected (when the motor speed reached 75% of its synchronous speed of 1800 RPM), and the motor current settled to normal operating current of 3.25 A (Figure 6). During the operating condition, more reactive power (375 VAR) was consumed by the motor than the active power (65 Watts). When the switch was turned OFF at (65/60)th of a second, the motor experienced a high voltage transient, the value even reaching 43 kV, due to the simulated instantaneous change in current. The simulation results did not show any voltage sag caused by the induction motor during normal operation, but it indicated the high current at start up, almost six times the normal operating current, which was similar to the actual water pump drawing a start-up current seven times higher than its normal operating current. The simulation also predicted a much larger transient at turn-off due to the idealized instantaneous change in current. The gate pulses for each inverter switch were generated by the PWM generator as shown in Figure 6. Only a pair of switches (S1 and S4) or (S2 and S3) were turned ON at any instant of time. For example, at 0.035 sec, switches S1 and S4 were ON while S2 and S3 were OFF. The widths of the generated pulses were varied to ensure that their averaged output produced a 60 Hz inusoidal waveform. s Copyright © 2013 SciRes. EPE 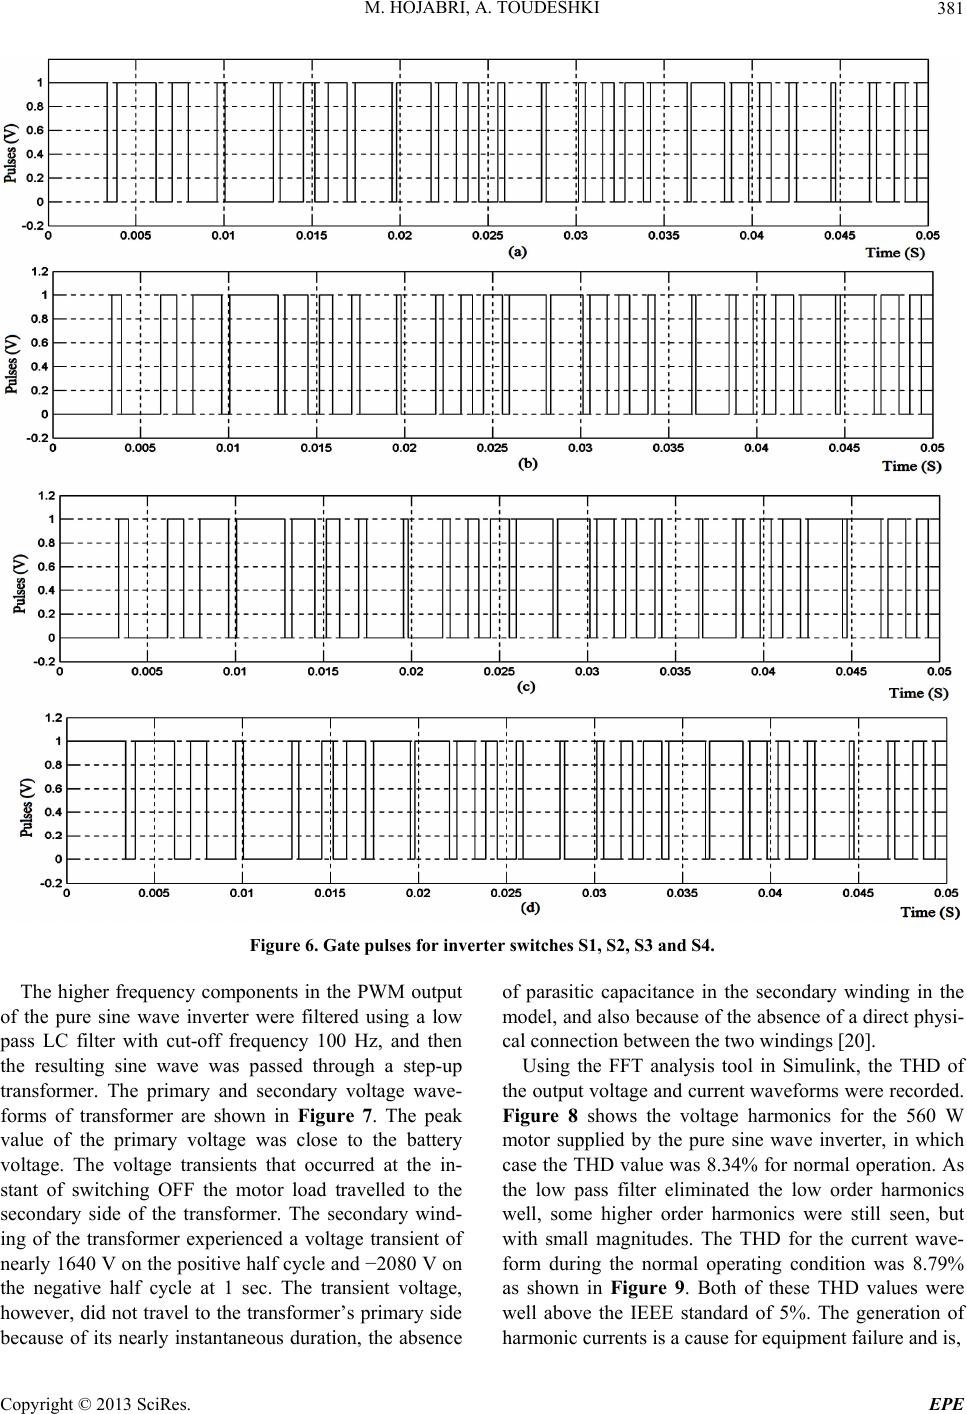 M. HOJABRI, A. TOUDESHKI Copyright © 2013 SciRes. EPE 381 Figure 6. Gate pulses for inverter switche s S1, S2, S3 and S4. The higher frequency components in the PWM output of the pure sine wave inverter were filtered using a low pass LC filter with cut-off frequency 100 Hz, and then the resulting sine wave was passed through a step-up transformer. The primary and secondary voltage wave- forms of transformer are shown in Figure 7. The peak value of the primary voltage was close to the battery voltage. The voltage transients that occurred at the in- stant of switching OFF the motor load travelled to the secondary side of the transformer. The secondary wind- ing of the transformer experienced a voltage transient of nearly 1640 V on the positive half cycle and −2080 V on the negative half cycle at 1 sec. The transient voltage, however, did not travel to the transformer’s primary side because of its nearly instantaneous duration, the absence of parasitic capacitance in the secondary winding in the model, and also because of the absence of a direct physi- cal connection between the two windings [20]. Using the FFT analysis tool in Simulink, the THD of the output voltage and current waveforms were recorded. Figure 8 shows the voltage harmonics for the 560 W motor supplied by the pure sine wave inverter, in which case the THD value was 8.34% for normal operation. As the low pass filter eliminated the low order harmonics well, some higher order harmonics were still seen, but with small magnitudes. The THD for the current wave- form during the normal operating condition was 8.79% as shown in Figure 9. Both of these THD values were well above the IEEE standard of 5%. The generation of harmonic currents is a cause for equipment failure and is,  M. HOJABRI, A. TOUDESHKI 382 (a) (b) Figure 7. Secondary and primary voltage waveforms of a step-up transformer. Figure 8. Voltage harmonics of an induction motor during normal operating conditions. therefore, a serious issue for off-grid systems. 5. Power Quality Analysis for Resistive and Inductive Loads The system power quality effects from other devices were observed by replacing the motor load with a parallel RL load of different power ratings. The loads were turned ON at 0.5 sec to allow time for the inverter tran- sients to settle down, and the loads were turned OFF at 1.08 sec. When the load switch was turned OFF, large Figure 9. Current harmonics of an induction motor during normal operating conditions. voltage transients were seen with the parallel RL load as they were with the motor load, due to the unrealistic, instantaneous change in the modeled current. For exam- ple, voltage transients of 350 kV occurred when an in- ductive load (500 W and 750 VAR) was used. This volt- age transient caused a negative voltage transient of mag- nitude 1100 V at the secondary side of the transformer. However, there were no transients seen for a purely re- sistive load, due to its linear relationship with current. Inductive loads (which are the dominant reactive load in a residential setting) can therefore be assumed as the primary source of voltage transients. The simulated in- stantaneous change in current through the inductor is responsible for generating this high voltage transient ac- cording to the relation [21]: d d i VL t (4) where V is voltage induced across the inductor, L, due to changing current di/dt. High start-up currents are drawn by the inductive loads to energize their coils. However, none of the purely resistive loads or loads where active power dominated the reactive power drew high start-up currents, as expected. For purely resistive loads, the simulation results showed that the current and voltage harmonics decreased slightly with heavy loads. For in- ductive loads also, voltage harmonics decreased while the current harmonics increased with heavy loads be- cause of the high fundamental current draw. Table 4 summarizes the THD of the current and voltage wave- forms for different simulated loads and the corresponding voltage transients that appeared in the system. This simulation shows the off-grid loads had significant cur- rent and voltage harmonics due to the inverter’s voltage along with the power electronics used in those loads. So the load’s voltage and current harmonic distortion in- crease by increasing the pure resistance load. For induc- Copyright © 2013 SciRes. EPE  M. HOJABRI, A. TOUDESHKI Copyright © 2013 SciRes. EPE 383 Table 4. Simulation results for current and voltage har- monics for different loads. Load Voltage THD% Current THD % No Load 7.45 - 150 W 7.68 7.68 500 W 8.17 8.17 700 W 8.56 8.56 100 W, 200 VAR 7.63 3.68 300 W, 500 VAR 7.87 3.91 500 W, 1000 VAR 8.18 3.93 tive loads, the total current harmonic distortion is in IEEE standard range. But the voltage THD is out of IEEE standard range (more than 5%). 6. Conclusion In most cases, off-grid renewable energy systems are cheaper than extending the power grid to provide elec- tricity for remote areas. Therefore, most countries are developing aims for electrification that includes renew- able off-grid options and/or renewably powered mini- grids. However, good power quality is an important fac- tor for the reliable operation of this system. In this paper, the MATLAB/Simulink software was used to model and analyze power quality for additional configurations of the typical off-grid system. The simulation results show the high voltage transient and high start-up current for induc- tive loads. Moreover, the results show the total harmonic distortion of current and voltage for pure resistance loads is significant. However, for inductive load, total demand distortion is in the acceptable range (less than 5%), but the total harmonic distortion of voltage is still more than IEEE standard limitation. REFERENCES [1] Global Status Report, “Renewable Energy Policy Net- work for the 21st Century,” Renewables, Paris, 2012. [2] M. Hojabri, A. Z. Ahmad, A. Toudeshki and M. Sohei- lirad, “An Overview on Current Control Techniques for Grid Connected Renewable Energy Systems,” 2nd Inter- national Conference on Power and Energy Systems (ICPES), November 2012, pp. 119-126. [3] J. H. R. Enslin and P. J. M. Heskes, “Harmonic Interac- tion between a Large Number of Distributed Power In- verters and the Distribution Network,” IEEE Transactions on Power Electronics, Vol. 19, No. 6, 2004, pp. 1586- 1593. [4] A. Bhowmik, A. Maitra, S. M. Halpin and J. E Schatz, “Determination of Allowable Penetration Levels of Dis- tributed Generation Re-Sources Based on Harmonic Limit Considerations,” IEEE Transactions on Power Delivery, Vol. 18, No. 2, 2003, pp. 619-624. [5] IEEE Standard 1547-2003, “IEEE Standard for Intercon- necting Distributed Resources with Electric Power Sys- tems,” 2003, pp. 0_1-16. [6] H. L. Jou, W. J. Chiang and J. C. Wu, “A Simplified Con- trol Method for the Grid-Connected Inverter with the Function of Islanding Detection,” IEEE Transactions on Power Electronics, Vol. 23, No. 6, 2008, pp. 2775-2783. [7] M. Dai, M. N. Marwali, J. W. Jung and A. Keyhani, “A Three-Phase Four-Wire Inverter Control Technique for a Single Distributed Generation Unit In Island Mode,” IEEE Transactions on Power Electronics, Vol. 23, No. 1, 2008, pp. 322-331. [8] Q. Zhang, L. Qian, C. Zhang and D. Cartes, “Study on Grid Connected Inverter Used in High Power Wind Gen- eration System,” 41st IAS Annual Meeting, Industry Ap- plications Conference, Tampa, 8-12 October 2006, pp. 1053-1058. [9] IEEE Standard 929-2000, “IEEE Recommended Practice for Utility Interface of Photovoltaic (PV) Systems,” 2000. [10] IEEE Standard Conformance Test Procedures for Equip- ment Inter-Connecting Distributed Resources with Elec- tric Power Systems 1547. 1-2005, IEEE P1547.1. [11] DIN VDE 0126-1-1, “Automatic Disconnection Device between a Generator and the Public Low-Voltage Grid,” 1999. [12] Grid Code, “High and Extra High Voltage,” E.ON, Lou- isville, 2003. [13] A. Moreno-Muñoz, “Power Quality: Mitigation Tech- nologies in a Distributed Environment,” Springer-Verlag London limited, London, 2007. [14] M. K. Saini and R. Kapoor, “Classification of Power Quality Events—A Review,” International Journal of Electrical Power & Energy Systems, Vol. 43, No. 1, 2012, pp. 11-19. [15] G. R Slone, “The Audiophile’s Project Sourcebook: 120 High-Performance Audio Electronics Projects,” TAB Electronics, New York, 2001. [16] IEEE Standard 519-1992, “IEEE Recommended Practices and Requirements for Harmonic Control in Electrical Power Systems,” 1993. [17] L.A. Schienbein and J.G DeSteese, “Distributed Energy Re-Sources, Power Quality and Reliability-Background,” Pacific Northwest National Labratory, Richland, 2002. [18] ANSI C84.1-2011, “American National Standard for Electric Power Systems and Equipment—Voltage Ratings (60 Hertz),” 2011. [19] MathWorks, “Product Documentatio Choosing a Solver,” MathWorks, 2012. http://www.mathworks.com/help/toolbox/simulink/ug/f11 -69449.html [20] ANSI C84.1-2011, “American National Standard for Electric Power Systems and Equipment Voltage Ratings (60 Hertz),” 2011. [21] MathWorks Products, “Choose a Solver,” Docu- mentation Center, 2013. http://www.mathworks.com/help/gads/choosing-a-s olver.html |