 Natural Resources, 2010, 1, 69-79 doi:10.4236/nr.2010.12007 Published Online December 2010 (http://www.SciRP.org/journal/nr) Copyright © 2010 SciRes. NR 69 The Economic and Environmental Impacts of Constructing Hydro Power Plants in Turkey: A Dynamic CGE Analysis (2004-2020) Levent Aydın* Ministry of Energy and Natural Resources, Moussa Bouh Odowa, Turkey. Email: leventaydin60@gmail.com Received October 31st, 2010; revised November 24th, 2010; accepted November 25th, 2010. ABSTRACT Since Turkey’s economy and population is rapidly growing, Turkey mostly meets its energy demand from imported fos- sil sources due to the very limited indigenous oil and natural gas resources. However, Turkey has abundant renewable resources especially, hydro power potential to be used for generation of electricity. But only one-third of this significant economical potential could be used. This usage seems insufficient when compared with that of European countries. In order to analyze the potential long term impacts of the hydro power expanding shock on some macroeconomic vari- ables of interest such as GDP, real consumption, real investment, exports, imports, trade balance, and carbon emis- sions, we developed TurGEM-D, a dynamic multisectoral general equilibrium model of the Turkish economy. Using TurGEM-D, we analyzed the impact of hydro power shock under policy scenario doubling hydro power generation. The simulation results show that doubling hydro power have slightly positive effects on macro indicators and carbon emis- sions for Turkish economy. Keywords: Hydro Power Generation, Dynamic CGE, Turkey, Carbon Emission 1. Introduction Turkey is seeking to cover an imminent shortfall in elec- tricity as well as cut its dependence on foreign energy resources, mainly natural gas. One of the Turkish energy policies is to designate hydro and nuclear power as an essential source of energy, meeting at least one-fifth of Turkey’s power needs within the next decades. On the other hand, Turkey is not a rich country in terms of the hydrocarbon (oil and natural gas, etc.) po- tential to be used for generation of electricity. Therefore Turkey has a strategy for developing the hydropower potential and expects a few hundred small hydro power plants to be constructed in the long run. Moreover Tur- key must discover new and renewable energy resources. However, new and renewable resources other than hydro will not be sufficient to produce large amounts of elec- tricity in the coming decades even if major efforts were made to develop them. Eventually, Turkey must base its power generation strategy on constructing nuclear and hydro power plants for coming decades in order to minimize foreign de- pendency of natural gas and carbon dioxide (CO2) emis- sions. The other main characteristic of strategy for power generation is the fact that the strategy is highly supply- oriented. Emphasis has been placed on ensuring addi- tional power supply to meet the growing demand while energy efficiency has been lower priority. In spite of new regulations and more activities have recently been launched to enhance energy efficiency, there is obviously a long way to go. As such, studies conducted by the Tur- kish government officials have demonstrated that Turkey has 25-30% energy conservation potential. The aim of this paper is to evaluate the economic and environmental impacts of constructing new hydro power plants as alternative fossil-fired power plants. In order to analyze this policy option we specifically developed TURGEM-D (Turkey General Equilibrium Model-Dy- namic) which is dynamic, multisectoral and applied gen- eral equilibrium model of the Turkish economy. The model structure of TURGEM-D mainly was based on ORANI-INT model except production structure. The production structure is divided into two types: fossil fired power generation and hydro power generation.  The Economic and Environmental Impacts of Constructing Hydro Power Plants in Turkey: A Dynamic CGE Analysis (2004-2020) Copyright © 2010 SciRes. NR 70 TURGEM-D database was compiled from the I/O ta- bles of Turkish economy with reference year of 2004. Both sectors and commodities of this data base were firstly aggregated into 8 sectors and commodities as fol- lows: agriculture, coal, oil, gas, oil products, energy in- tensive industries, electricity, other industries and ser- vices. The electricity sectors further disaggregated 2 sec- tors and its commodities with additional data of Turkish power sector. We expect hydro power generation of Turkish econ- omy is to be about twofold by increasing average annual production from 62 billion kWh to 118 billion kWh in the next decade (2010-2020). The policy scenarios are to diversify fuel sources as well as supply routines and ori- gin and they also aims to reduce import dependence of natural gas and coal in power generation while increase- ing the share of renewable hydro and nuclear power in Turkey. In the long term options we expect that hydro power make significant contribution to power generation. We can use real GDP and CO2 emission as a macroeco- nomic variable to evaluate impacts of hydro power plants on Turkish economy. 2. Hydro Power Potential and Policy in Turkey Turkey has theoretical hydropower potential of 433 bil- lion kWh1, technically feasible potential of 216 billion kWh, and technically economical potential of 140 billion kWh. In 2009, there were 213 hydroelectric power plants in operation in Turkey. Total hydropower plants capacity was 14,300 MW with average annual total production of 50,000 GWh which corresponds to 36% of the total eco- nomical potential. In addition 145 hydro plants with total capacity of 7,286 MW are under construction, corre- sponding to about 23,770 GWh of additional annual power generation. The remaining potential of 66,230 GWh of total 140 billion kWh will use to construct the 200 hydropower plants in the coming decades. This would bring the number of hydropower plants to 558 and the total installed capacity to 44,200 MW [1,2]. Although Turkey has a big potential for hydro power, the utilization of this potential is a question of determin- ing and implementing sound, long-term energy planning and politics that should prepare the best and reliable en- vironment for the national and international investors [3,4]. Place and being a source of re- newable energy in power, the lack of negative influence of the environment, low operating and maintenance costs make it necessary to develop as possible. Giving priority to the use of water resources in Turkey has been adopted as a national policy. Installed hydroelectric power, even though significant progress achieved to date, is not enough. Hydroelectric energy has to be addressed with the development of a new strategy. Table 1 indicates that total the installed capacity will increase to 48,817 MW in 2010 and to 96,349 MW in 2020. The installed hydropower capacity is anticipated to increase to 18,234 MW in 2010 and to 34,076 MW in 2020. Thus, an additional 1,584 MW of hydro capacity should be added to the system annually over the next 10 years [5]. The production of hydroelectric power plants, is de- pendent on rainfall conditions change in the share of total production each year, however, the 20-and 30% of elec- tric energy in Turkey is produced from water. As shown Table 1 the renewable power generation with rainfall conditions will increase to 62 Billion kWh in 2010 to 118 Billion kWh in 2020. In the recent years, more emphasis has been put on the environmental integration of small hydro plants into river systems in order to minimize environmental impacts, incorporating new technology and operating methods in Turkey. Table 1. Turkey’s long-term electricity supply projections. Year 2010 2020 Rain Rainless Rain Rainless Power Plant Type Installed capacity (MW) Billion kWh Installed capacity (MW) Billion kWh Fuel based 30,583 211 211 62,273 425 426 Renewable based 18,234 62 46 34,076 118 77 Total supply 48,817 273 257 96,349 543 503 Sources: TEIAS, Turkey Electricity Generation Planning Study (2005-2020/October 2004) It is almost 1% of world total potential and 16% of the total hydropower capacity in Europe (Balat, 2007).  The Economic and Environmental Impacts of Constructing Hydro Power Plants in Turkey: A Dynamic CGE Analysis (2004-2020) Copyright © 2010 SciRes. NR 71 By the end of 2008 Turkey was producing 17% of its electricity from renewable energy sources. The revised strategy paper for the electricity sector set a target of producing 25% of the country’s electricity from renew- able sources by the end of 2020. Considering that elec- tricity consumption is expected to double by the same date, this objective will require significant efforts. Tur- key’s energy policy has been revised in line with EU policy in the context of enlargement process. In addition to the publication of Electricity Market Law (Law No. 4628) led to the establishment of Electric- ity Market Regulatory Authority and the publication of Renewable Energy Law (LawNo.5346) guarantees to buy electricity from legal entities with a price of €5.5cent/ kWh by government for duration of 10 years, the Law No. 5784, was published stating that the legal entities are not required to apply for a license to generate electricity from renewable energy up to a capacity of 500kW and government guarantees the buy the excess electricity. These laws on renewable energy utilization for electricity generation in Turkey have brought some improvements to the market. However, they must be revised or redes- igned to fulfill the requirements of EU policy as Turkey is an EU- candidate country [6]. 3. Modelling Framework and Simulation Design Before proceeding with the model simulation, we must first briefly discuss the TurGEM-D model and its data- base, originally developed by Malakellis [7]. We take the standard ORANI-INT model and introduce some changes to make it consistent with power generation. We first show that the structure of TurGEM-D model allows for analysis of increasing supply of renewable power generation. The most significant features that distinguish TurGEM from ORANI-INT are the inclusion of inter- fuel substitution, power generation, capital energy sub- stitution/complementarity, and dynamic mechanism ca- pable of projecting the development of the economy through time. With TurGEM-D we have produced an- nual projections of the Turkeys CO2 emission, GDP growth rate, and other economic variables. 3.1. Model Structure and Data TurGEM-D is dynamic computable general equilibrium model of Turkish economy. The dynamic Turkish model described below was developed from the Australian model originally presented in ORANI [8] and has its core the dynamic CGE model described in ORANI-INT mod- el. Model structure is modified from ORANI-INT model to make suitable for analyzing energy, natural resources and climate change issues. The model database was compiled from the 2004 Tur- kish Input-Output table [9] and Energy Statics [10]. The 64 sectors in Turkish economy are first aggregated to 8 sectors, which are thought to be critical for this analysis. Electricity sector further disaggregated into fossil fired electricity generation (oil-fired, coal-fired, gas-fired) and hydro power generations. The electricity industry is able substitute alternative power generation technologies in response to changes in relative costs. The output of the power sector is an aggregate of the power generated from each of these technologies. The production structure of the power generation sectors in TurGEM-D model is illustrated by the nested structure and all electricity gen- erated from these technologies as shown in Figure 1. In addition, power generated from renewable energy sour- ces is designed as a separate sector so as to analyze Tur- kish energy policies in line with the EU policy. The production structure of non-electricity sectors in TurGEM-D model is represented by the nested structure of energy composite (coal, oil products, gas) and primary factor composite (land, labor, capital). The dynamic structure of TurGEM-D is illustrated in Figure 2. The model is replicated “T” times by indexing all variables in the model with respect to time, where “T” is the length of time horizon (in years). Sectoral invest- ments and aggregate household expenditures are exoge- nous in the model. The model equations are dynamic: they express relationships among variables at different points in time. As shown in Figure 1, on the production side of the model, energy is taken out of the intermediate input ‘nest’ to be incorporated into the ‘value-added’ nest. In- corporation of energy into the value-added nest is han- dled in two steps. First, following Burniaux and Truong (2002), energy commodities are first divided into ‘elec- tricity’ and ‘non-electricity.’ Certain degree of substitu- tion is allowed among the non-electricity inputs (σ NELY) as well as between the electricity and the non-electricity inputs (σ ENER). The energy composite is then combined with capital to produce an energy-capital composite. This is in turn combined with other primary factors in a val- ue-added-energy (VAE) nest through a CES structure. The substitution elasticity between capital and energy composite (σKE) is still assumed to be positive (indicating energy and capital are substitutes in the ‘inner nest’). However, provided the value of σKE is set at a level lower than σVAE , the overall substitution elasticity (as viewed from the ‘outer nest’) between capital and energy may still be negative [11]. More precisely, we make use of the formula derived by Keller [12] which specifies the rela- tionship between the ‘inner’ and ‘outer’ elasticity of sub- stitution between K and E as follows:  The Economic and Environmental Impacts of Constructing Hydro Power Plants in Turkey: A Dynamic CGE Analysis (2004-2020) Copyright © 2010 SciRes. NR 72 KE-outerKE-innerVAEKEVAEVAE σ=(σσ )/S+σ/S (1) where SKE is the cost share of the KE-composite in the outer (value-added) nest, and σKE-inner and σKE-outer indicate the inner and outer substitution elasticities between K and E, respectively. In TurGEM-D, the (inner) value of σKE is assumed to be 0.5 for most industries (including electricity), and is set equal to 0.0 for coal, oil, gas, petroleum and coal products, and agriculture. We followed Burniaux and Truong [13] in adopting the parameter values. The value of σVAE ranges from 0.2 to 1.45 and this seems to be slightly larger than the values adopted by other models.2 As indicated by the directions of arrow in Figure 2 some variables are linked through time via forward and backward linkages. For investment (It), the backward linkages are provided by the capital accumulation equa- tions (Kt) while the forward linkages are provided by the specification of forward looking rates of return. Similarly consumption (Ct) in each period is linked (forward) to future prices and income while current debt (Dt) is linked (backwards) to past savings. Only one representative household is modeled in the model and capital is as- sumed to be sector-specific. This means that the model incorporates 9 independent types of forward-looking behavior where 8 relate to the planning of sectoral in- vestments while the other relates to the planning of ag- gregate consumption. There are also 9 accumulation Figure 1. Production structure of the model. See Tables 9 and 10 in Burniaux and Truong (2002: 32) for more details on the values of σ and σ used by other models. 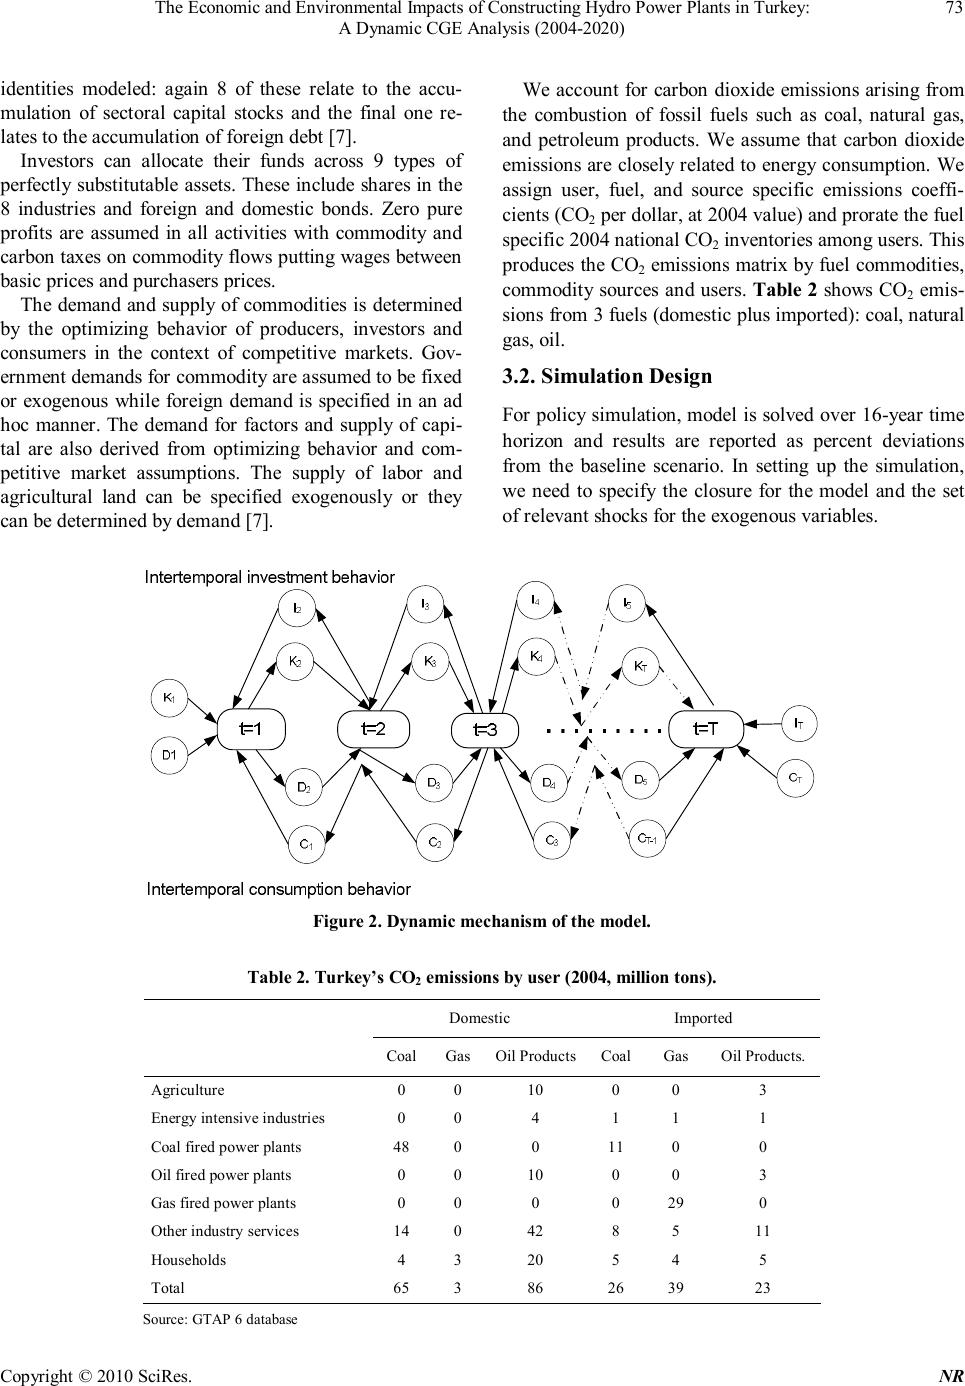 The Economic and Environmental Impacts of Constructing Hydro Power Plants in Turkey: A Dynamic CGE Analysis (2004-2020) Copyright © 2010 SciRes. NR 73 identities modeled: again 8 of these relate to the accu- mulation of sectoral capital stocks and the final one re- lates to the accumulation of foreign debt [7]. Investors can allocate their funds across 9 types of perfectly substitutable assets. These include shares in the 8 industries and foreign and domestic bonds. Zero pure profits are assumed in all activities with commodity and carbon taxes on commodity flows putting wages between basic prices and purchasers prices. The demand and supply of commodities is determined by the optimizing behavior of producers, investors and consumers in the context of competitive markets. Gov- ernment demands for commodity are assumed to be fixed or exogenous while foreign demand is specified in an ad hoc manner. The demand for factors and supply of capi- tal are also derived from optimizing behavior and com- petitive market assumptions. The supply of labor and agricultural land can be specified exogenously or they can be determined by demand [7]. We account for carbon dioxide emissions arising from the combustion of fossil fuels such as coal, natural gas, and petroleum products. We assume that carbon dioxide emissions are closely related to energy consumption. We assign user, fuel, and source specific emissions coeffi- cients (CO2 per dollar, at 2004 value) and prorate the fuel specific 2004 national CO2 inventories among users. This produces the CO2 emissions matrix by fuel commodities, commodity sources and users. Table 2 shows CO2 emis- sions from 3 fuels (domestic plus imported): coal, natural gas, oil. 3.2. Simulation Design For policy simulation, model is solved over 16-year time horizon and results are reported as percent deviations from the baseline scenario. In setting up the simulation, we need to specify the closure for the model and the set of relevant shocks for the exogenous variables. Figure 2. Dynamic mechanism of the model. Table 2. Turkey’s CO2 emissions by user (2004, million tons). Domestic Imported Coal Gas Oil Products Coal Gas Oil Products. Agriculture 0 0 10 0 0 3 Energy intensive industries 0 0 4 1 1 1 Coal fired power plants 48 0 0 11 0 0 Oil fired power plants 0 0 10 0 0 3 Gas fired power plants 0 0 0 0 29 0 Other industry services 14 0 42 8 5 11 Households 4 3 20 5 4 5 Total 65 3 86 26 39 23 Source: GTAP 6 database 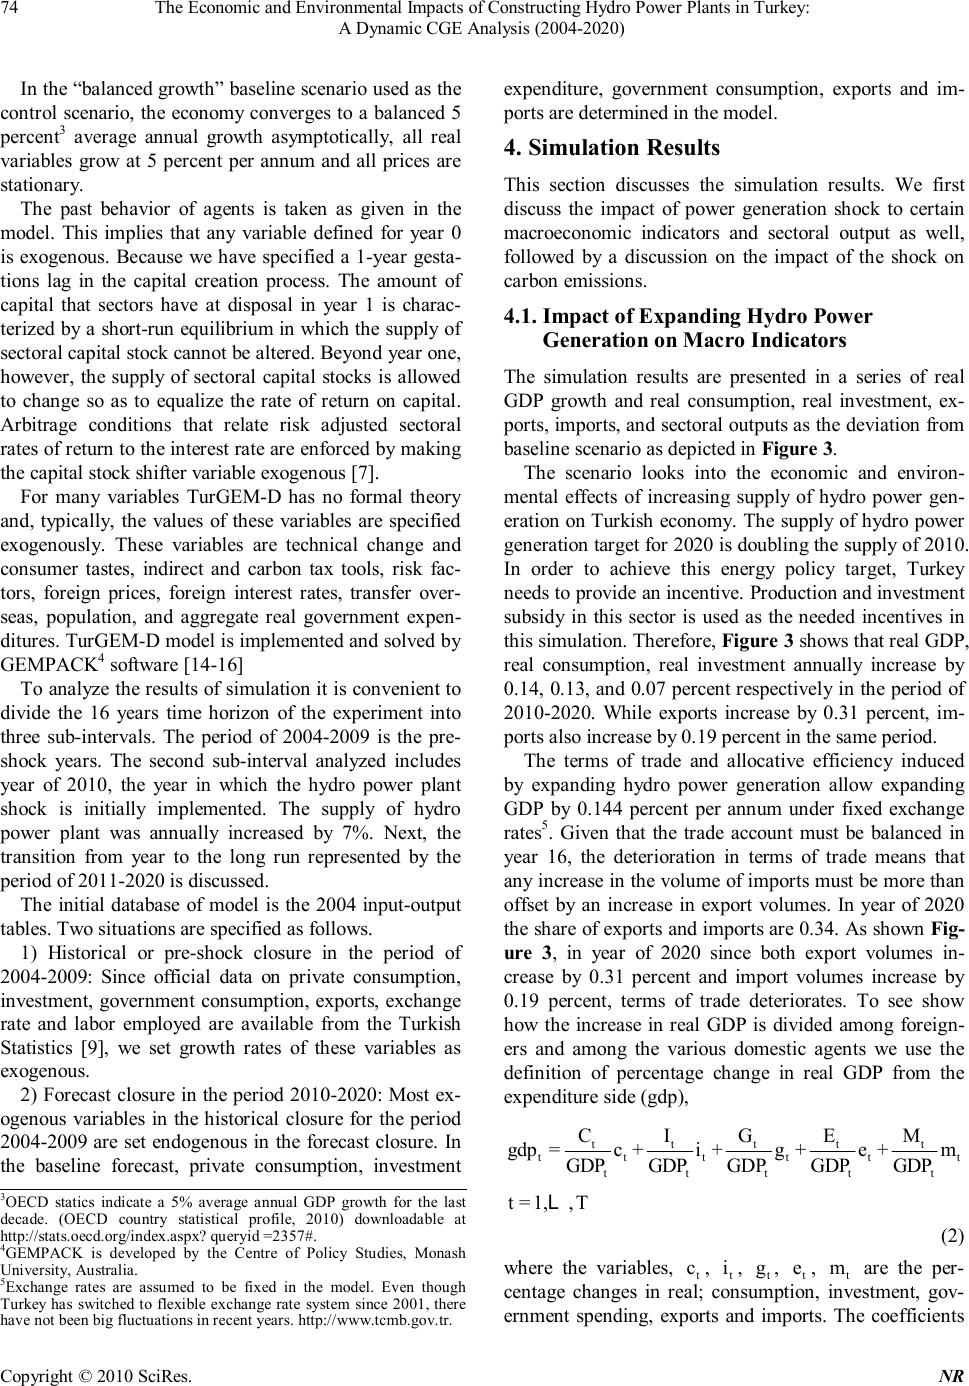 The Economic and Environmental Impacts of Constructing Hydro Power Plants in Turkey: A Dynamic CGE Analysis (2004-2020) Copyright © 2010 SciRes. NR 74 In the “balanced growth” baseline scenario used as the control scenario, the economy converges to a balanced 5 percent3 average annual growth asymptotically, all real variables grow at 5 percent per annum and all prices are stationary. The past behavior of agents is taken as given in the model. This implies that any variable defined for year 0 is exogenous. Because we have specified a 1-year gesta- tions lag in the capital creation process. The amount of capital that sectors have at disposal in year 1 is charac- terized by a short-run equilibrium in which the supply of sectoral capital stock cannot be altered. Beyond year one, however, the supply of sectoral capital stocks is allowed to change so as to equalize the rate of return on capital. Arbitrage conditions that relate risk adjusted sectoral rates of return to the interest rate are enforced by making the capital stock shifter variable exogenous [7]. For many variables TurGEM-D has no formal theory and, typically, the values of these variables are specified exogenously. These variables are technical change and consumer tastes, indirect and carbon tax tools, risk fac- tors, foreign prices, foreign interest rates, transfer over- seas, population, and aggregate real government expen- ditures. TurGEM-D model is implemented and solved by GEMPACK4 software [14-16] To analyze the results of simulation it is convenient to divide the 16 years time horizon of the experiment into three sub-intervals. The period of 2004-2009 is the pre- shock years. The second sub-interval analyzed includes year of 2010, the year in which the hydro power plant shock is initially implemented. The supply of hydro power plant was annually increased by 7%. Next, the transition from year to the long run represented by the period of 2011-2020 is discussed. The initial database of model is the 2004 input-output tables. Two situations are specified as follows. 1) Historical or pre-shock closure in the period of 2004-2009: Since official data on private consumption, investment, government consumption, exports, exchange rate and labor employed are available from the Turkish Statistics [9], we set growth rates of these variables as exogenous. 2) Forecast closure in the period 2010-2020: Most ex- ogenous variables in the historical closure for the period 2004-2009 are set endogenous in the forecast closure. In the baseline forecast, private consumption, investment expenditure, government consumption, exports and im- ports are determined in the model. 4. Simulation Results This section discusses the simulation results. We first discuss the impact of power generation shock to certain macroeconomic indicators and sectoral output as well, followed by a discussion on the impact of the shock on carbon emissions. 4.1. Impact of Expanding Hydro Power Generation on Macro Indicators The simulation results are presented in a series of real GDP growth and real consumption, real investment, ex- ports, imports, and sectoral outputs as the deviation from baseline scenario as depicted in Figure 3. The scenario looks into the economic and environ- mental effects of increasing supply of hydro power gen- eration on Turkish economy. The supply of hydro power generation target for 2020 is doubling the supply of 2010. In order to achieve this energy policy target, Turkey needs to provide an incentive. Production and investment subsidy in this sector is used as the needed incentives in this simulation. Therefore, Figure 3 shows that real GDP, real consumption, real investment annually increase by 0.14, 0.13, and 0.07 percent respectively in the period of 2010-2020. While exports increase by 0.31 percent, im- ports also increase by 0.19 percent in the same period. The terms of trade and allocative efficiency induced by expanding hydro power generation allow expanding GDP by 0.144 percent per annum under fixed exchange rates5. Given that the trade account must be balanced in year 16, the deterioration in terms of trade means that any increase in the volume of imports must be more than offset by an increase in export volumes. In year of 2020 the share of exports and imports are 0.34. As shown Fig- ure 3, in year of 2020 since both export volumes in- crease by 0.31 percent and import volumes increase by 0.19 percent, terms of trade deteriorates. To see show how the increase in real GDP is divided among foreign- ers and among the various domestic agents we use the definition of percentage change in real GDP from the expenditure side (gdp), ttttt ttttt CIGEM GDPGDPGDPGDPGDP t=1,,TL (2) where the variables, , , , , are the per- centage changes in real; consumption, investment, gov- ernment spending, exports and imports. The coefficients 3 OECD statics indicate a 5% average annual GDP growth for the last decade. (OECD country statistical profile, 2010) downloadab http://stats.oecd.org/index.aspx? queryid =2357#. 4 GEMPACK is developed by the Centre of Policy Studies, Monash University, Australia. 5 Exchange rates are assumed to be fixed in the model. Even though Turkey has switched to flexible exchange rate sys have not been big fluctuations in recent years. http://www.tcmb.gov.tr . 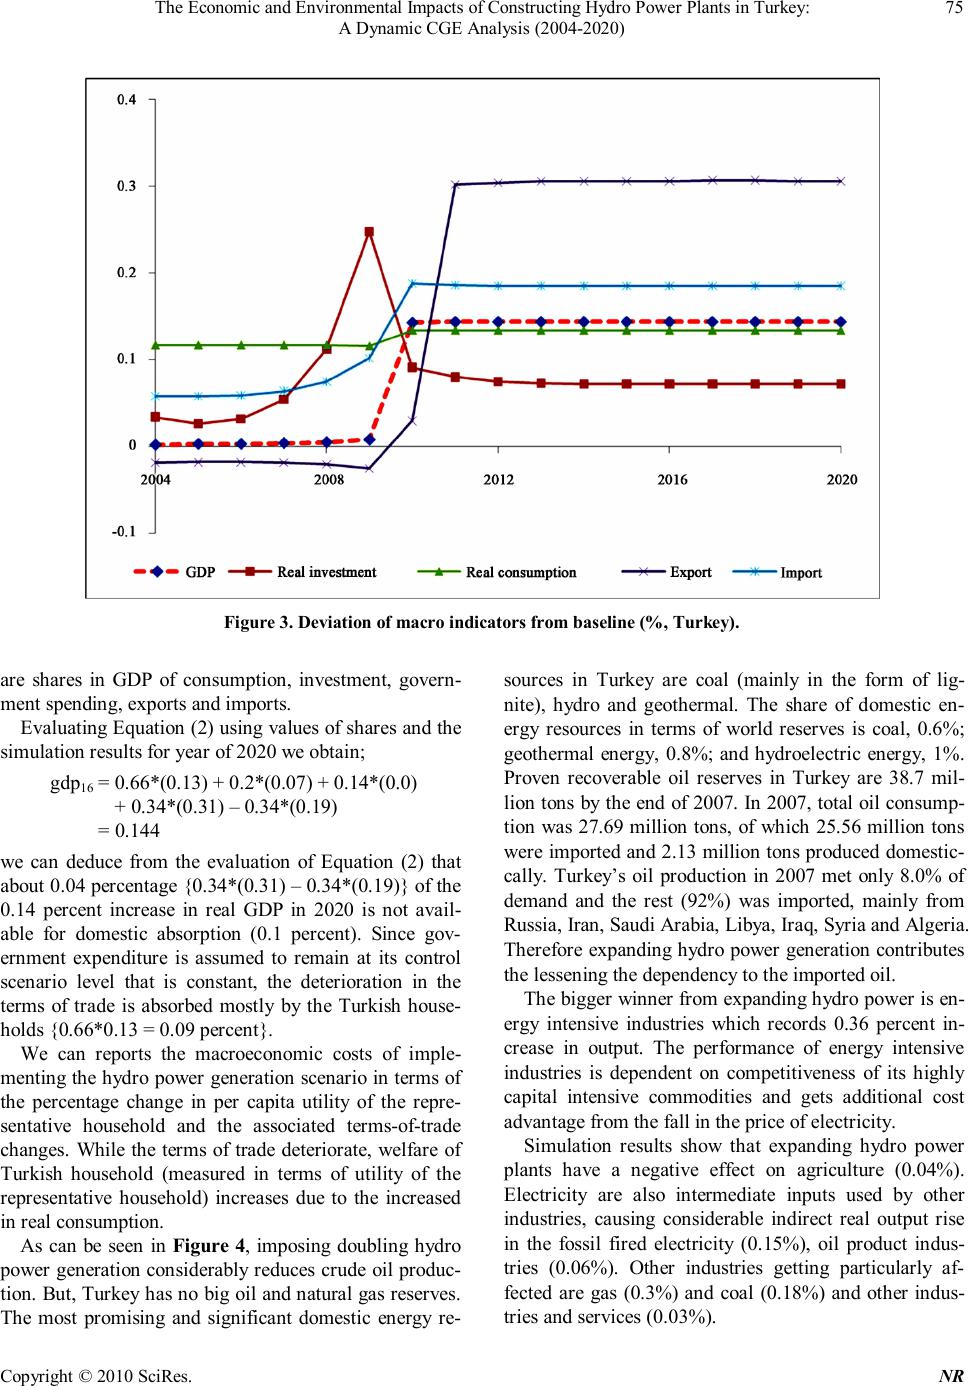 The Economic and Environmental Impacts of Constructing Hydro Power Plants in Turkey: A Dynamic CGE Analysis (2004-2020) Copyright © 2010 SciRes. NR 75 Figure 3. Deviation of macro indicators from baseline (%, Turkey). are shares in GDP of consumption, investment, govern- ment spending, exports and imports. Evaluating Equation (2) using values of shares and the simulation results for year of 2020 we obtain; gdp16 = 0.66*(0.13) + 0.2*(0.07) + 0.14*(0.0) + 0.34*(0.31) – 0.34*(0.19) = 0.144 we can deduce from the evaluation of Equation (2) that about 0.04 percentage {0.34*(0.31) – 0.34*(0.19)} of the 0.14 percent increase in real GDP in 2020 is not avail- able for domestic absorption (0.1 percent). Since gov- ernment expenditure is assumed to remain at its control scenario level that is constant, the deterioration in the terms of trade is absorbed mostly by the Turkish house- holds {0.66*0.13 = 0.09 percent}. We can reports the macroeconomic costs of imple- menting the hydro power generation scenario in terms of the percentage change in per capita utility of the repre- sentative household and the associated terms-of-trade changes. While the terms of trade deteriorate, welfare of Turkish household (measured in terms of utility of the representative household) increases due to the increased in real consumption. As can be seen in Figure 4, imposing doubling hydro power generation considerably reduces crude oil produc- tion. But, Turkey has no big oil and natural gas reserves. The most promising and significant domestic energy re- sources in Turkey are coal (mainly in the form of lig- nite), hydro and geothermal. The share of domestic en- ergy resources in terms of world reserves is coal, 0.6%; geothermal energy, 0.8%; and hydroelectric energy, 1%. Proven recoverable oil reserves in Turkey are 38.7 mil- lion tons by the end of 2007. In 2007, total oil consump- tion was 27.69 million tons, of which 25.56 million tons were imported and 2.13 million tons produced domestic- cally. Turkey’s oil production in 2007 met only 8.0% of demand and the rest (92%) was imported, mainly from Russia, Iran, Saudi Arabia, Libya, Iraq, Syria and Algeria. Therefore expanding hydro power generation contributes the lessening the dependency to the imported oil. The bigger winner from expanding hydro power is en- ergy intensive industries which records 0.36 percent in- crease in output. The performance of energy intensive industries is dependent on competitiveness of its highly capital intensive commodities and gets additional cost advantage from the fall in the price of electricity. Simulation results show that expanding hydro power plants have a negative effect on agriculture (0.04%). Electricity are also intermediate inputs used by other industries, causing considerable indirect real output rise in the fossil fired electricity (0.15%), oil product indus- tries (0.06%). Other industries getting particularly af- fected are gas (0.3%) and coal (0.18%) and other indus- tries and services (0.03%). 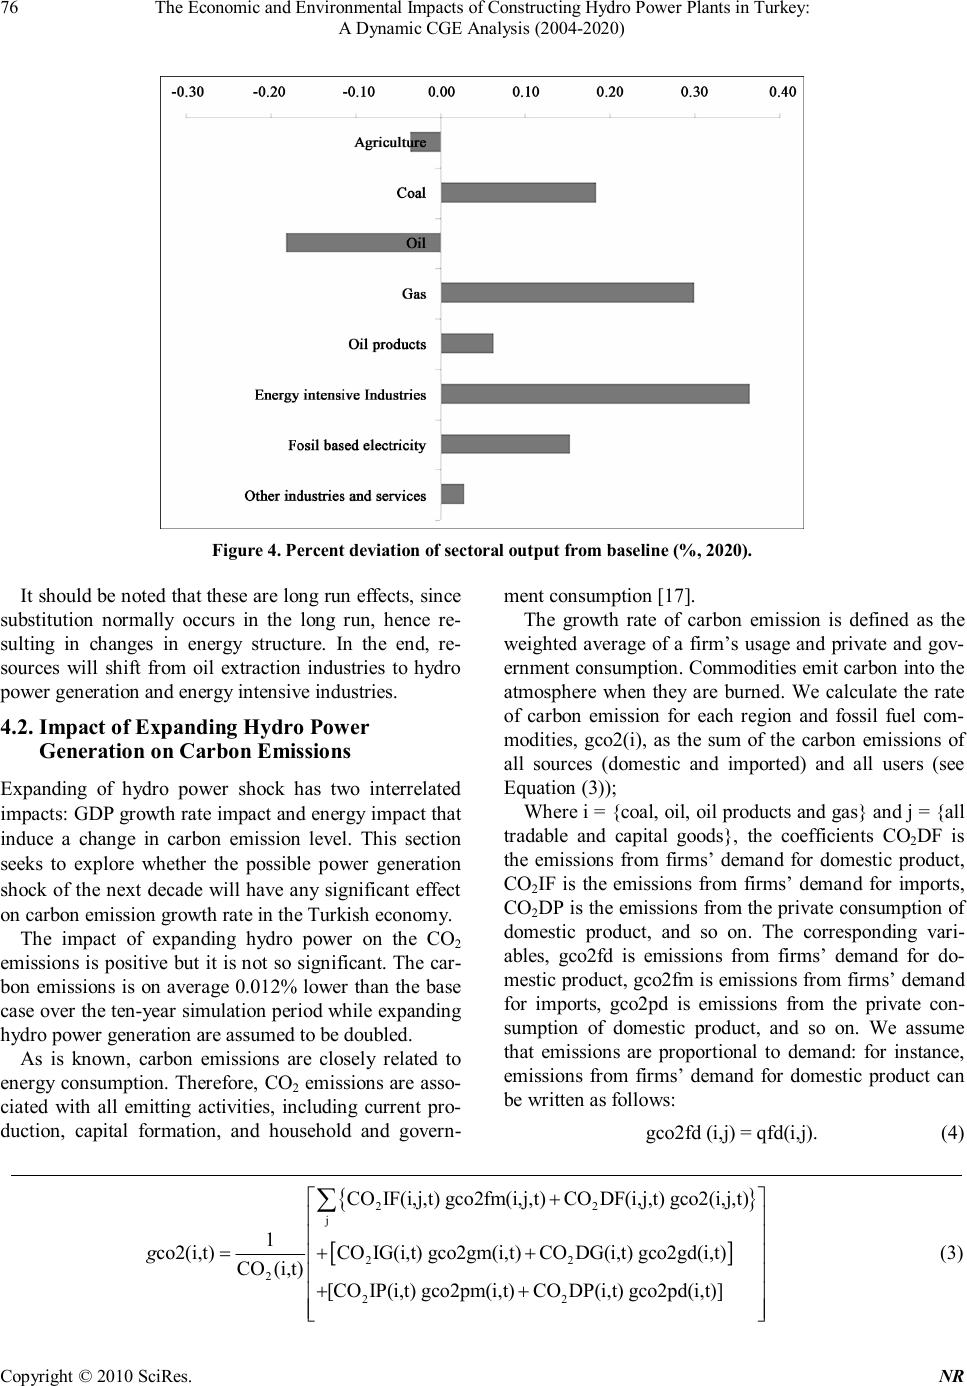 The Economic and Environmental Impacts of Constructing Hydro Power Plants in Turkey: A Dynamic CGE Analysis (2004-2020) Copyright © 2010 SciRes. NR 76 Figure 4. Percent deviation of sectoral output from baseline (%, 2020). It should be noted that these are long run effects, since substitution normally occurs in the long run, hence re- sulting in changes in energy structure. In the end, re- sources will shift from oil extraction industries to hydro power generation and energy intensive industries. 4.2. Impact of Expanding Hydro Power Generation on Carbon Emissions Expanding of hydro power shock has two interrelated impacts: GDP growth rate impact and energy impact that induce a change in carbon emission level. This section seeks to explore whether the possible power generation shock of the next decade will have any significant effect on carbon emission growth rate in the Turkish economy. The impact of expanding hydro power on the CO2 emissions is positive but it is not so significant. The car- bon emissions is on average 0.012% lower than the base case over the ten-year simulation period while expanding hydro power generation are assumed to be doubled. As is known, carbon emissions are closely related to energy consumption. Therefore, CO2 emissions are asso- ciated with all emitting activities, including current pro- duction, capital formation, and household and govern- ment consumption [17]. The growth rate of carbon emission is defined as the weighted average of a firm’s usage and private and gov- ernment consumption. Commodities emit carbon into the atmosphere when they are burned. We calculate the rate of carbon emission for each region and fossil fuel com- modities, gco2(i), as the sum of the carbon emissions of all sources (domestic and imported) and all users (see Equation (3)); Where i = {coal, oil, oil products and gas} and j = {all tradable and capital goods}, the coefficients CO2DF is the emissions from firms’ demand for domestic product, CO2IF is the emissions from firms’ demand for imports, CO2DP is the emissions from the private consumption of domestic product, and so on. The corresponding vari- ables, gco2fd is emissions from firms’ demand for do- mestic product, gco2fm is emissions from firms’ demand for imports, gco2pd is emissions from the private con- sumption of domestic product, and so on. We assume that emissions are proportional to demand: for instance, emissions from firms’ demand for domestic product can be written as follows: (4) [ ] 22 j 22 2 22 COIF(i,j,t) gco2fm(i,j,t)CODF(i,j,t) gco 1 co2(i,t)COIG(i,t) gco2gm(i,t)CODG(i,t) gco2gd(i,t) CO(i,t) [COIP(i,t) gco2pm(i,t)CODP(i,t) gco2pd(i,t)] g + =++ ++  The Economic and Environmental Impacts of Constructing Hydro Power Plants in Turkey: A Dynamic CGE Analysis (2004-2020) Copyright © 2010 SciRes. NR 77 Others follow the same pattern. Similarly, we calculate the rate of the economy-wide CO2 emissions for each region, gco2t, as the sum of emissions from the com- modities subject to the carbon tax. t 2 i 2 1 COT(t) =∑ (5) where i = coal, gas, oil products and By using Table 3 and simulation results we can evalu- ate growth of carbon emission in line with Equation (4) for year of 2020. Table 3 shows the amount of carbon emission released by fuels and percentage changes due to the expanding hydro power generation. As shown in Figure 3 doubling hydro power genera- tion supply leads to a fall in output of the crude oil pro- duction derived from fossil fuels, thereby contributing to environmental protection through the reduction of carbon dioxide emissions associated with the fossil fuels. The carbon dioxide emissions by the Turkish economy de- creases by about 0.012 percent per annum as shown in Figure 5. In general, the results suggest that the long run effects of expanding hydro power generation in Turkish econ- omy with respect to CO2 emissions and GDP growth move in the reverse direction due to the renewable en- ergy usage instead of fossil fuels emitting carbon into atmosphere. Cumulative output gains over the ten-year projection period resulting from doubled hydro power generation can be as large as 1.5 percent, while cumuli- tive CO2 emissions loss can be nearly 0.1 percent devia- tion from baseline. Table 3. Total carbon emission and its percentage change by fuel type. Fuel type Emission (Million Ton) Share of CO2 Emission Growth of CO2 Emission (Average of 2010-2020) Percentage change of CO2 Emission Coal 91 0.38 0.046 0.017 Gas 42 0.17 0.065 0.011 Oil Products 109 0.45 −0.089 −0.040 Total 242 1.00 −0.012 Source: GTAP database and own calculations. Figure 5. Percent deviation of CO2 emissions from baseline (%, Turkey).  The Economic and Environmental Impacts of Constructing Hydro Power Plants in Turkey: A Dynamic CGE Analysis (2004-2020) Copyright © 2010 SciRes. NR 78 The model presented in this article shares many of features incorporated in the models in the intertemporal CGE literature. In order to place TurGEM-D in this lite- rature we outline key features of four models chosen for comparison in table A1 in Appendix. The four models are described by Mercenier and Sampio de Souza [18], Bovering and Goulder [19], Jorgensen and Wilcoxen [20], and McKibbin and Wilcoxen [21]. These models are chosen due to the fact that they represent the latest developments in the class of models to which Tur- GEM-D model belongs. 5. Conclusions One of the most important conclusions of this study for Turkey as a developing country – as implied by the re- sults of the simulation - is that increasing renewable en- ergy source that is hydro power decrease carbon emis- sions without reducing economic growth dramatically. The net effects of this scenario would reduce even fur- ther the cost of adopting environment friendly energy policies. While evaluating the results of energy and environ- mental policies, one should keep in mind that this model measures only deviation from the baseline as to the costs and benefits of these policies. Further potential advan- tages or disadvantages of hydropower in the context of power generation have not been captured by the model. As to the policy recommendation for policy makers who have to consider carbon abatement policy without giving up economic development as an ultimate target, we can say the following. Given the fact that some sort of a carbon tax reform is a must in the context of adjust- ment to the EU energy policies, one option is that carbon tax revenues can be used to finance the adoption of technological change in the form of shifting more to- wards renewable energy sources. As another option, they could be used to minimize the burden sharing of energy tax in favor of the producers. Due to the long term positive implications in creating a less carbon-emitting, more energy efficient economy, we suggest that energy tax revenues should be used to fi- nance shifting towards renewable energy-based technol- ogy and environment-friendly production structure. Be- cause this is the best policy option in achieving cleaner environment without harming the capital stock, invest- ment possibilities and indirect tax revenues. Utilization of renewable energy sources at a higher degree would further contribute to reducing dependency of Turkey to imported energy sources, hence reinforcing energy sup- ply security. The introduction of the energy-environmental dimen- sion in TurGEM-D is only one step towards the elabora- tion of a ORANI framework that is suitable to analyze GHG issues. It is hoped that the current version of Tur- GEM-D could be further extended in order to analyze some other renewable energy issues, such as new con- structing or expanding capacity in nuclear power in elec- tricity generation and using bio-fuels as a fuel in trans- port sector. REFERENCES [1] B. Dursun and C. Gokcol, “The Role of Hydroelectric Power and Contribution of Small Hydropower Plants for Sustainable Development in Turkey,” Renewable Energy, doi:10.1016/j.renene.2010.10.001. [2] DSI, State Hydraulic Works, “Statistics on Hydropower,” Ankara, Turkey. http://www.dsi.gov.tr [3] M. Ozturk, N. C. Bezir and N. Ozek, “Hydropower– Wa- ter and Renewable Energy in Turkey: Sources and Pol- icy,” Renewable and Sustainable Energy Reviews, Vol. 13, No. 3, 2009, pp. 605-615. [4] H. Balat, “A Renewable Perspective for Sustainable En- ergy Development in Turkey: The Case of Small Hydro- power Plants,” Renewable and Sustainable Energy Re- views, Vol. 11, No. 9, 2007, pp. 2152-2165. [5] TEIAS, Directorate-General of Turkish Electricity Trans- mission. http://www.teias.gov.tr [6] S. Kucukali and K. Baris, “Assessment of Small Hydro- power (SHP) Development in Turkey: Laws, Regulations and EU Policy Perspective,” Energy Policy, Vol. 37, No. 10, 2009, pp. 3872-3879. [7] M. Malakellis, “Integrated Macro-Micro-Modeling under Rational Expectations with an Application to Tariff Re- form in Australia,” Physica-Verlag, 2000. [8] P. B. Dixon, B. R. Parmenter, J. Sutton and D. P. Vincent, “ORANI: A Multisectoral Model of the Australian Econ- omy,”Amsterdam, North-Holland, 1982. [9] TURKSAT, “The Supply-Use and Input-Output Tables,” Ankara, 2008. http://www.tuik.gov.tr [10] World Energy Council, “Energy Statistics,” Turkish Na- tional Committee, Istanbul, 2004. [11] A. M. Borges and L. H. Goulder, “Decomposing the Im- pact of Higher Energy Prices on Long Term Growth,” In: H. E. Scarf and J. B. Shoven, Eds., Applied General Equi- librium Analysis, Cambridge University Press, Cambridge, 1984. [12] W. J. Keller, “Tax Incidence, A General Equilibrium Approach,” North Holland, 1980. [13] J. Burniaux and T. Truong, “GTAP-E: An Energy-Envi- ronmental Version of the GTAP Model, ” GTAP Techni- cal Paper No. 16, Center for Global Trade Analysis, Pur- due University, West Lafayette, 2002. [14] B. V. Dimaranan and R. A. McDougall, “Global Trade, Assistance, and Production: The GTAP 6 Data Base, Center for Global Trade Analysis,” Purdue University,  The Economic and Environmental Impacts of Constructing Hydro Power Plants in Turkey: A Dynamic CGE Analysis (2004-2020) Copyright © 2010 SciRes. NR 79 2005. [15] W. J. Harrison and K. R. Pearson, “An Introduction to GEMPACK, Document GPD-1,” Centre of Policy Stud- ies, Monash University, Clayton, Melbourne, 2000. [16] W. J. Harrison and K. R Pearson, “Computing Solutions for Large General Equilibrium Models Using GEM- PACK,” Computational Economics, Vol. 9, No. 2, 1996, pp. 83-127. [17] L. Aydin and M. Acar, “Economic and Environmental Implications of Turkish Accession to the European Union: A CGE Analysis,” Energy Policy, Vol. 38, No. 11, No- vember 2010, pp. 7031-7040. [18] J. Mercenier and M. Sampaio de Souza, “Structural Ad- justment and Growth in a Highly Indebted Market Econ- omy: Brazil,” In: J. Mercenier and T. N. Srinivasan, Eds., Applied General Equilibrium and Economic Development, University of Michigan Press, Ann arbor, 1994, pp. 281- 310. [19] A. L. Bovenberg and L. H. Goulder, “Introducing and Open Economy Features in Applied General Equilibrium Models,” In: H. Don van de Klundert and J. Sinderen, Eds., Applied General Equilibrium Analysis, Kluwer Academic Publishers, Dodrectht, 1991, pp. 47-64. [20] D. W. Jorgensen and P. J. Wolcoxen, “Intertemporal Gen- eral Equilibrium Modeling of U.S. Environmental Regu- lation,” Journal of Policy Modelling, Vol. 12, No. 4, 1990, pp. 715-744. [21] W. J. McKibbin and P. J. Wilcoxen, “The Theoretical and Empirical Structure of the G-Cubed Model, ” Economic Modelling, Vol. 16, No. 1, January 1999, pp. 123-148. Appendix Table A1. Key features of models. TurGEM-D ORANI-INT M-S B-G J-W M-W Single country with open economy features √ √ √ √ Sector produces its own capital using sector –specific technology √ √ √ Energy substitution in its structure √ √ Investment decision are driven by forwards-looking rates of return √ √ √ Time-to-build investment specification that does not incorporate convex adjustment costs √ √ √ Infinitely lived representative household √ √ √ √ √ √ Labor supply decision are not determined by the solution of utility maximization problem √ √ √ √ √ Government decision is endogenous √ √ √ √ Budget deficit is determined residually. √ √ Sources: Malakallis, 2000 Notes: M-S denotes Merceiner and Sampaio de Souze, B-G denotes Bovenberg and Goulder, J-W denotes Jorgensen and Wilcoxen, M-W denotes McKibbin and Wilcoxen model.
|