 Journal of Electromagnetic Analysis and Applications, 2013, 5, 271-280 http://dx.doi.org/10.4236/jemaa.2013.57043 Published Online July 2013 (http://www.scirp.org/journal/jemaa) 271 Analysis of Conservative and Magnetically Induced Electric Fields in a Low-Frequency Birdcage Coil* Bu S. Park1#, Sunder S. Rajan1, Christopher M. Collins2, Leonardo M. Angelone1 1Division of Physics, Center for Devices and Radiological Health, Office of Medical Products and Tobacco, Food and Drug Admini- stration, Silver Spring, USA; 2Department of Radiology, New York University, New York, USA. Email: #bu.park@fda.hhs.gov Received May 16th, 2013; revised June 17th, 2013; accepted June 25th, 2013 Copyright © 2013 Bu S. Park et al. This is an open access article distributed under the Creative Commons Attribution License, which permits unrestricted use, distribution, and reproduction in any medium, provided the original work is properly cited. ABSTRACT Numerical methods are used to evaluate variations of the electromagnetic fields generated by a head-sized birdcage coil as a function of load (“loading effect”). The loading effect was analyzed for the cases of a coil loaded with a conductive cylindrical sample, a dielectric cylindrical sample, and an anatomically precise head model. Maxwell equations were solved by means of finite difference time domain (FDTD) method conducted at 12.8, 64, and 128 MHz. Simulation results indicate that at 12.8 MHz the conservative electric field c caused by the scalar electric potentials between the coil and the load or within the load was significantly higher than the magnetically-induced electric field i and was the major component of the total electric field total E. The amplitudes of c and are seen to be lower within a sample than at a corresponding location in an empty coil, but approximately 65% higher in the space between coil and sample than at a corresponding location in an empty coil. This is due to polarization effects generating an addi- tional scalar potential parallel to the original field. The increased electric field between coil and sample may cause in- creased power deposition at the surface of the sample and may affect the RF-induced currents in external leads used for physiological recording, i.e. ECG, during MRI scanning. total E Keywords: MRI; FDTD; Loading Effect; Conservative Electric Field; Birdcage Coil 1. Introduction In magnetic resonance imaging (MRI), the signal to noise ratio (SNR) and the specific energy absorption rate (SAR), the dosimetric parameter used to establish safety limits for human subjects by the International Electro- technical Commission (IEC) [1] and the US Food and Drug Administration [2], depend upon the total electric field total E. The total can be decomposed into a con- servative and magnetically-induced electric fields (E- fields) [3] and a distinction is often needed between the two components. Conservative E-fields E c caused by the scalar electrical potential on conductors give rise to a portion of sample loss also referred to as “dielectric loss” [4]. Magnetically-induced E-fields i are created by the time-varying magnetic fields [5], and give rise to a portion of sample loss also referred to as “inductive loss” [4]. In some cases it is possible to reduce the losses due to c without changing the current distribution or magnetic field distribution using a so called “Ec-shield” [6], and thus maintaining the desired sensitivity and field of view (FOV) while reducing SAR in the sample and/or the noise received from the sample [6-9]. A previous study [6] showed that this method could be applied to a solenoid coil. This study evaluated whether the method of “Ec-shield” could be also extended to a birdcage coil, the most common type of coil used in human MRI. One of the motivations of this study to understand the mecha- nism of thermal injury to skin is currently the most common type of adverse event reported for MRI scans [10]. Another reason for this study is to find the effect of a conductive or a dielectric sample related to the safety assurance in a region of interest (ROI), particularly be- tween the RF coil and the sample. Previous research [9,11] showed that the total electric field inside a coil would be decreased with addition of a loading sample. *Disclaimer: The mention of commercial products, their sources, or their use in connection with material reported herein is not to be con- strued as either an actual or implied endorsement of such products by the Department of Health and Human Services. #Corresponding author. Copyright © 2013 SciRes. JEMAA  Analysis of Conservative and Magnetically Induced Electric Fields in a Low-Frequency Birdcage Coil 272 Conversely, the hypothesis driving the proposed study was that the electric field decreases only within the load- ing sample, but it is the same or higher in the space be- tween coil and sample. Changes in electric field between coil and sample may cause increased power deposition in the subject skin, with possible related thermal injury [10]. Moreover, changes in electric field may also affect the RF-induced currents in external leads used for physio- logical recording during MRI (e.g., ECG or EEG leads). Additionally, there have been some suggestions that c may play a significant role in the total sample loss, al- though it is generally believed that almost all of the sample loss is magnetically-induced [12]. The study was conducted by means of numerical simu- lations conducting a systematic analysis of the electro- magnetic field, including c and i generated by the birdcage coil within and surrounding the load. The study took advantage of a recently developed method based on quasi-static approximation that allows separating nu- merically-calculated E-field distributions into conserva- tive and magnetically-induced portions [3]. We performed numerical electromagnetic field simulations within and surrounding a high pass (HP) birdcage coil combined with a cylindrical conductive phantom and a human head model at different frequencies. Additionally, the volume charge density (ρυ) distribution generating the scalar elec- tric potential and c was calculated to support the ex- planation of electromagnetic field variations. Results were analyzed to evaluate the contribution of c , i and RF magnetic field to the total electromagnetic field distribution. 1 B Conservative and Magnetically-Induced Electric Field The power loss (P) can be calculated as [8]: 2 1d 2total vol PE v (1) where σ is the conductivity (S/m) and total total EE is the amplitude of the total electric field total E (V/m), which can be separated as two components: totali c t A EE (2) where is the vector magnetic potential (Wb/m) and is the scalar electric potential (V), respectively. In order to reduce the total power absorbed by the sample, the Etotal should be minimized, which means minimizing the components c and/or i . 2. Materials and Methods 2.1. Birdcage Head Coil A high-pass (HP) birdcage head coil was modeled using 12 rods of 300 mm of length, disposed circularly with an inner diameter (ID) of 290 mm. To accurately simulate the field distribution generated by an ideal high-pass birdcage coil, 12 sinusoidal voltage sources of 1 V am- plitude in series with a 50 Ω resistor were placed in both the top and bottom rings, in the middle of each of the segments between the rods of the coil (Figure 1). Each source was assigned a phase-shift equal to the azimuthal position of the segment (i.e., 30˚C) between voltages in adjacent end ring segments, and with sources in opposite end rings having opposite orientation. The following frequencies were modeled: 12.8, 64, and 128 MHz, cor- responding to 0.3, 1.5 and 3.0 T for water proton MRI. 2.2. Load: Phantom and Head Model The birdcage head coil was loaded with a cylindrical sample having ID of 200 mm and length of 300 mm with a 5 mm resolution. Three different electrical properties for the phantom were simulated, namely: a) conductive sample (σ = 0.2 S/m, εr = 1), b) dielectric sample (σ = 0 S/m, εr = 78), and weak saline (σ = 0.2 S/m, εr = 78) [6]. Simulations were also performed with an anatomi- cally-precise human head model (Figure 1). The human head model was created by segmenting the digital photo- graphic data of the National Library of Medicine’s Visi- ble Human Project [13, 14], and then transforming these segmented images into a 3D grid of Yee cell cubes [15]. The human head model had a 5 × 5 × 5 mm3 isotropic resolution and contained 20 tissue types [16,17] having different conductivity (σ) and relative permittivity (εr) values. 2.3. Numerical Simulations and Data Processing All simulations were performed using commercially available software (xFDTD, Remcom, Inc, State College, PA) and analysis of results was performed in Matlab (The MathWorks, Inc., Natick, MA). Simulation results of electromagnetic fields were normalized so that 14T B at the coil center corresponding to a 1.5 ms (a) (b) Figure 1. Geometry of high pass (HP) birdcage coil (yellow), sample (green, (a)) and head model (b) used for numerical simulations. Copyright © 2013 SciRes. JEMAA 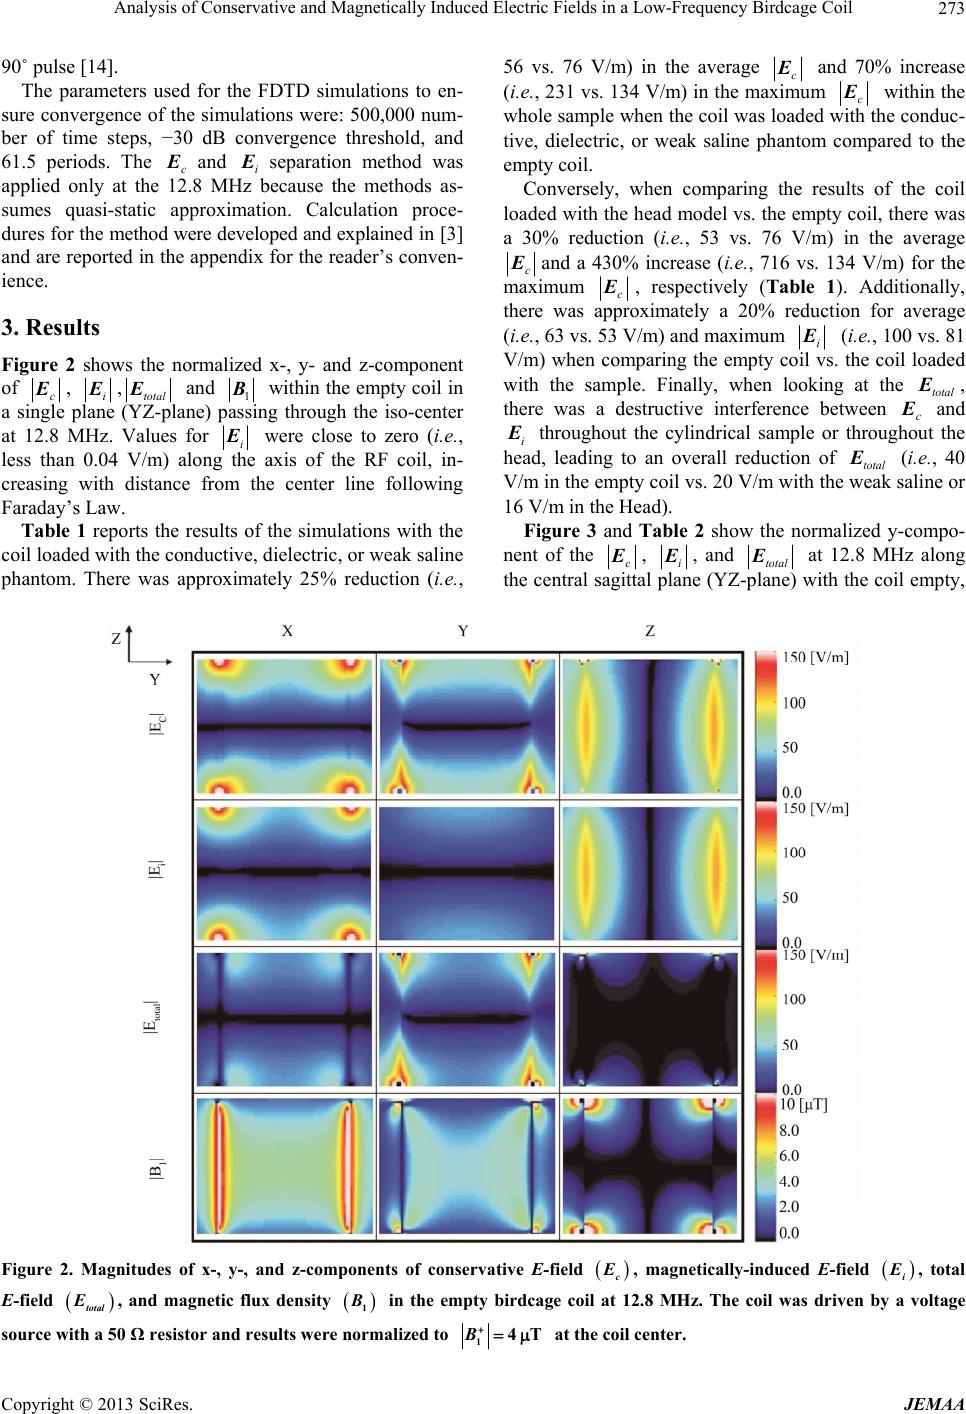 Analysis of Conservative and Magnetically Induced Electric Fields in a Low-Frequency Birdcage Coil Copyright © 2013 SciRes. JEMAA 273 90˚ pulse [14]. 56 vs. 76 V/m) in the average c and 70% increase (i.e., 231 vs. 134 V/m) in the maximum c within the whole sample when the coil was loaded with the conduc- tive, dielectric, or weak saline phantom compared to the empty coil. The parameters used for the FDTD simulations to en- sure convergence of the simulations were: 500,000 num- ber of time steps, −30 dB convergence threshold, and 61.5 periods. The c and i separation method was applied only at the 12.8 MHz because the methods as- sumes quasi-static approximation. Calculation proce- dures for the method were developed and explained in [3] and are reported in the appendix for the reader’s conven- ience. Conversely, when comparing the results of the coil loaded with the head model vs. the empty coil, there was a 30% reduction (i.e., 53 vs. 76 V/m) in the average c and a 430% increase (i.e., 716 vs. 134 V/m) for the maximum c , respectively (Table 1). Additionally, there was approximately a 20% reduction for average (i.e., 63 vs. 53 V/m) and maximum i (i.e., 100 vs. 81 V/m) when comparing the empty coil vs. the coil loaded with the sample. Finally, when looking at the total , there was a destructive interference between c E and i throughout the cylindrical sample or throughout the head, leading to an overall reduction of total (i.e., 40 V/m in the empty coil vs. 20 V/m with the weak saline or 16 V/m in the Head). E 3. Results Figure 2 shows the normalized x-, y- and z-component of c , i ,total E and 1 B within the empty coil in a single plane (YZ-plane) passing through the iso-center at 12.8 MHz. Values for i were close to zero (i.e. , less than 0.04 V/m) along the axis of the RF coil, in- creasing with distance from the center line following Faraday’s Law. Figure 3 and Table 2 show the normalized y-compo- nent of the c , i , and total E at 12.8 MHz along the central sagittal plane (YZ-plane) with the coil empty, Table 1 reports the results of the simulations with the coil loaded with the conductive, dielectric, or weak saline phantom. There was approximately 25% reduction (i.e., Figure 2. Magnitudes of x-, y-, and z-components of conservative E-field c , magnetically-induced E-field i , total E-field , and magnetic flux density in the empty birdcage coil at 12.8 MHz. The coil was driven by a voltage source with a 50 Ω resistor and results were normalized to total E B1 B14T at the coil center. 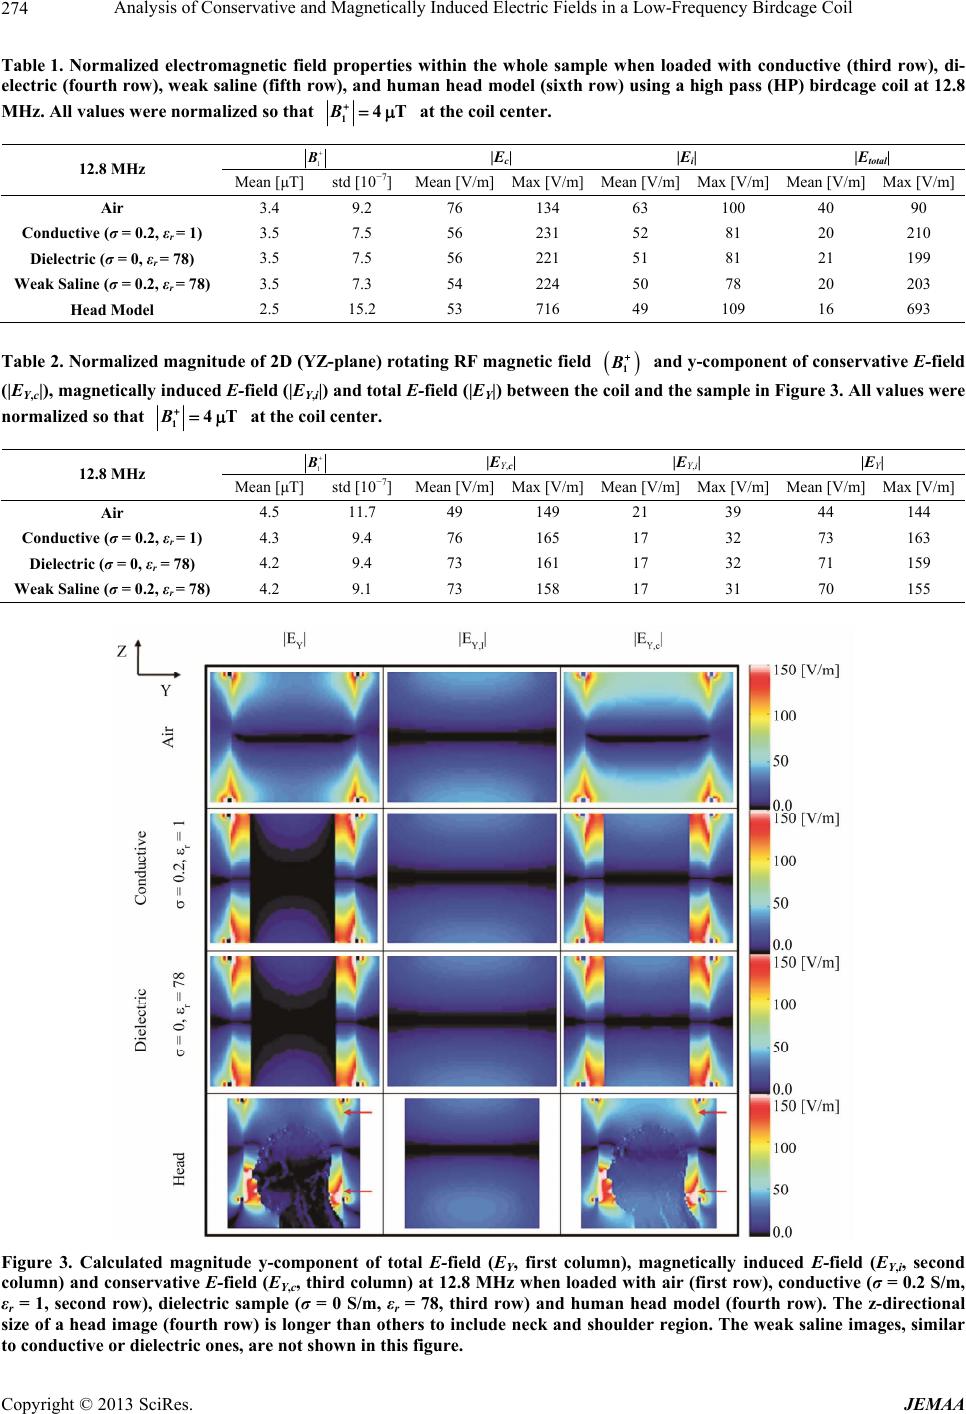 Analysis of Conservative and Magnetically Induced Electric Fields in a Low-Frequency Birdcage Coil 274 Table 1. Normalized electromagnetic field properties within the whole sample when loaded with conductive (third row), di- electric (fourth row), weak saline (fifth row), and human head model (sixth row) using a high pass (HP) birdcage coil at 12.8 MHz. All values were normalized so that B14T at the coil center. 1 |Ec| |Ei| |Etotal| 12.8 MHz Mean [μT] std [10−7]Mean [V/m]Max [V/m]Mean [V/m]Max [V/m] Mean [V/m] Max [V/m] Air 3.4 9.2 76 134 63 100 40 90 Conductive (σ = 0.2, εr = 1) 3.5 7.5 56 231 52 81 20 210 Dielectric (σ = 0, εr = 78) 3.5 7.5 56 221 51 81 21 199 Weak Saline (σ = 0.2, εr = 78) 3.5 7.3 54 224 50 78 20 203 Head Model 2.5 15.2 53 716 49 109 16 693 Table 2. Normalized magnitude of 2D (YZ-plane) rotating RF magnetic field B1 and y-component of conservative E-field (|EY,c|), magnetically induced E-field (|EY,i|) and total E-field (|EY|) between the coil and the sample in Figure 3. All values were normalized so that B14T at the coil center. 1 |EY,c| |EY,i| |EY| 12.8 MHz Mean [μT] std [10−7]Mean [V/m]Max [V/m]Mean [V/m]Max [V/m] Mean [V/m] Max [V/m] Air 4.5 11.7 49 149 21 39 44 144 Conductive (σ = 0.2, εr = 1) 4.3 9.4 76 165 17 32 73 163 Dielectric (σ = 0, εr = 78) 4.2 9.4 73 161 17 32 71 159 Weak Saline (σ = 0.2, εr = 78) 4.2 9.1 73 158 17 31 70 155 Figure 3. Calculated magnitude y-component of total E-field (EY, first column), magnetically induced E-field (EY,i, second column) and conservative E-field (EY,c, third column) at 12.8 MHz when loaded with air (first row), conductive (σ = 0.2 S/m, εr = 1, second row), dielectric sample (σ = 0 S/m, εr = 78, third row) and human head model (fourth row). The z-directional size of a head image (fourth row) is longer than others to include neck and shoulder region. The weak saline images, similar o conductive or dielectric ones, are not shown in this figure. t Copyright © 2013 SciRes. JEMAA 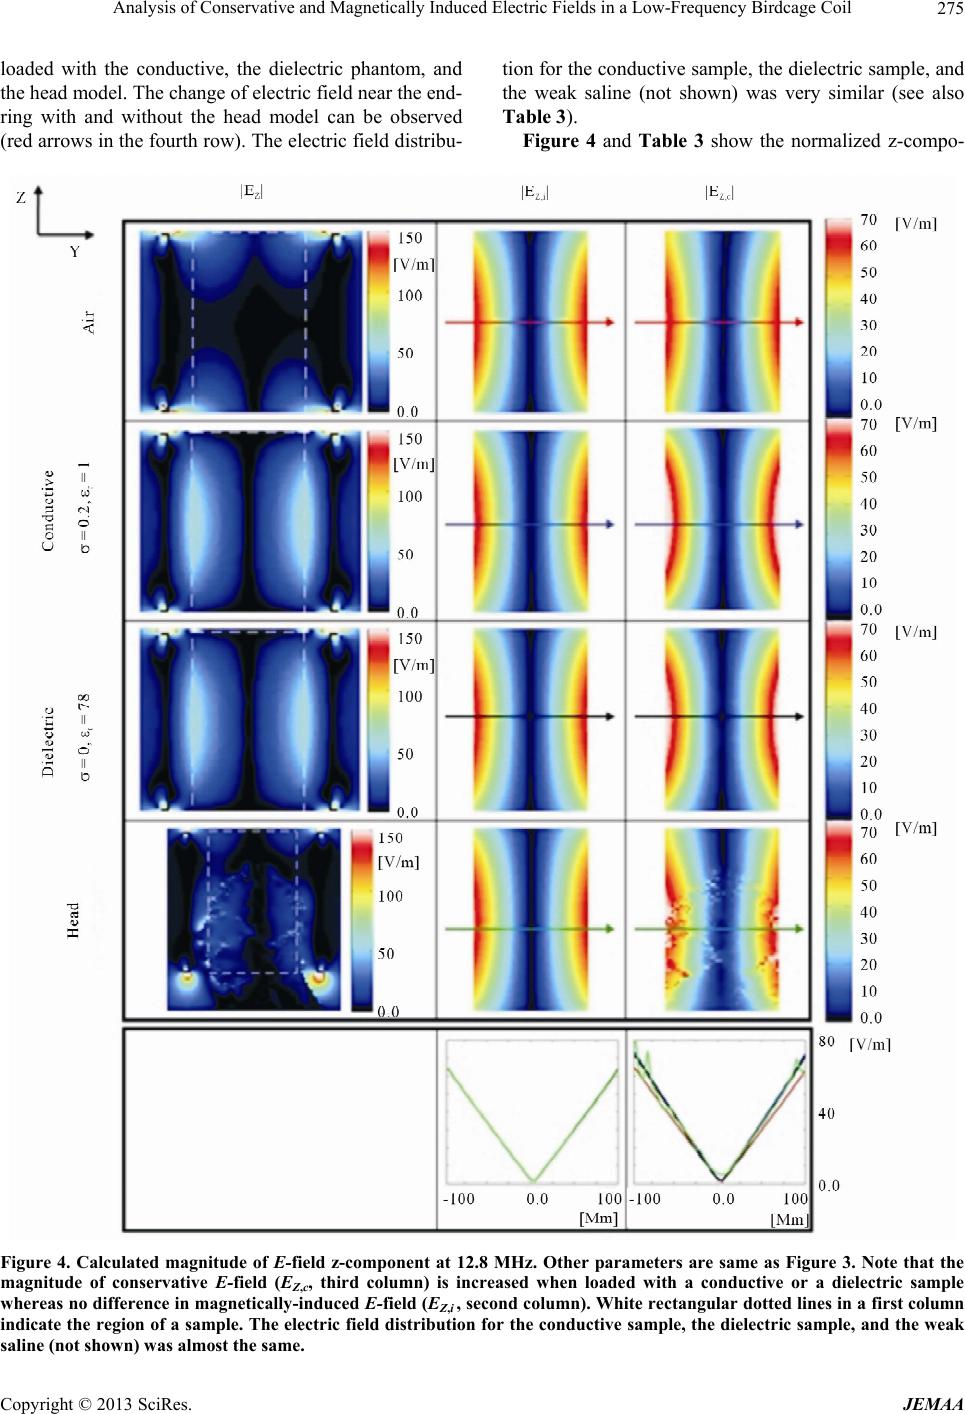 Analysis of Conservative and Magnetically Induced Electric Fields in a Low-Frequency Birdcage Coil Copyright © 2013 SciRes. JEMAA 275 loaded with the conductive, the dielectric phantom, and the head model. The change of electric field near the end- ring with and without the head model can be observed (red arrows in the fourth row). The electric field distribu- tion for the conductive sample, the dielectric sample, and the weak saline (not shown) was very similar (see also Table 3). Figure 4 and Table 3 show the normalized z-compo- Figure 4. Calculated magnitude of E-field z-component at 12.8 MHz. Other parameters are same as Figure 3. Note that the magnitude of conservative E-field (EZ,c, third column) is increased when loaded with a conductive or a dielectric sample whereas no difference in magnetically-induced E-field (EZ,i , second column). White rectangular dotted lines in a first column indicate the region of a sample. The electric field distribution for the conductive sample, the dielectric sample, and the weak saline (not shown) was almost the same.  Analysis of Conservative and Magnetically Induced Electric Fields in a Low-Frequency Birdcage Coil 276 Table 3. Normalized magnitude of 2D (YZ-plane) rotating RF magnetic field B1 and z-component of conservative E-field (EZ,c), magnetically induced E-field (EZ,i) and total E-field (EZ) within the sample in Figure 4. Other parameters are same as Table 2. 1 |EZ,c| |EZ,i| |EZ| 12.8 MHz Mean [μT] std [10−7]Mean [V/m]Max [V/m]Mean [V/m]Max [V/m] Mean [V/m] Max [V/m] Air 3.3 9.0 29 67 29 67 4 31 Conductive (σ = 0.2, εr = 1) 3.4 7.3 32 105 29 67 10 83 Dielectric (σ = 0, εr = 78) 3.4 7.3 31 100 29 67 10 77 Weak Saline (σ = 0.2, εr = 78) 3.4 7.1 31 105 29 67 10 83 nent of c , i , and total E at 12.8 MHz along the central sagittal plane (YZ-plane). The z-component of c within the sample was increased of about 10% in average and 55% in maximum (Table 3) with addition of a conductive sample, a dielectric sample or a weak saline (not shown), whereas no changes were observed in the z-component of i . Figure 5 shows the total magnitude of c , i , and total and rotating RF magnetic field (1, fourth row) after normalization for the coil empty (first column), loaded with conductive cylinder (second column), di- electric cylinder (third column) and human head model (fourth column). For the coil loaded with conductive sample, dielectric sample, and weak saline (not shown), the EB c and total Edecreased within the sample, but increased in the space between sample and coil. Figure 6 and Table 4 show the electromagnetic field as a function of frequency (12.8 MHz, 64 MHz, and 128 MHz) for the empty coil (first row), and the coil loaded with a weak-saline cylindrical sample (second row) and a head model (third row). As frequency increased from 12.8 MHz to 128 MHz, the average magnitude of total electric field within the weak saline sample (i.e., mean ||E||sample) increased of about 390% (i.e., 20 vs. 98 V/m ). The fields for the coil loaded with a conductive or di- electric sample (not shown) were similar to the ones of the coil loaded with weak saline. Figure 7 shows the calculated volume charge density ( ,where is the electric flux density) at the frequencies of 12.8 (first column), 64 (second column), and 128 MHz (third column) with different loading con- ditions. The charge density was highly concentrated on the surface of the sample or the head model regardless of the operating frequencies. D 4. Discussion For the empty coil, the z-component of the i —mainly caused by the currents flowing along the rungs-is domi- nant because i is perpendicular to the magnetic flux density following Faraday’s Law (Figure 2). On B the sagittal plane (YZ-plane) the x-component of i mainly caused by the end-ring currents-was higher than the y-component; the comparison was reversed on the coronal planes. The value of i at the center was zero (Figures 2-5), as expected given the specific electrical configuration of the coil and can be explained by means of the magnetic vector potential , proportional to the current density (Equation (3)). Because opposite sides of a bird- cage coil in ideal mode 1 resonance have equal flowing in the opposite direction and generating an op- posing , the two having same amplitude and op- posite direction cancel each other out at the center. In these results, the value of electric field in the iso-center of the coil was very close to zero but not exactly zero (i.e., 0.04 V/m, less than 0.2% of average total electric field within the whole sample). The c was signifi- cantly different when the coil was loaded with a conduc- tive, a dielectric, a weak-saline sample, or a human head model, with approximately a 25% - 30% change in the average c and up to 430% change in maximum c within the whole sample (Table 1). This was due to the additional scalar potential (ϕ) within and sur- rounding the sample, as shown in Figure 3. When a conductive, dielectric, or weak-saline sample is located within the electric field generated by the RF coil, charged particles within the sample are moved to the boundaries of the sample, resulting in a polarization field which ei- ther has same or opposite direction of the original field depending on the specific region considered and on the components of the coil. Because of such polarization effects, the z-component of c (|EZ,c|) within the sample increased (Figure 4 and Table 3); however, because the additional scalar electric potential had opposite direction of the original one, the y-component of c (|EY,c|) de- creased within the sample. Moreover, because |EY,c| was the dominant component of the total , this resulted in an overall reduction in the total and an increase of mag- netic field homogeneity within the sample (Figure 3, Tables 1 and 2). These results are in line with published literature [8,9,11]. However, the |EY,c| between a coil and E E Copyright © 2013 SciRes. JEMAA  Analysis of Conservative and Magnetically Induced Electric Fields in a Low-Frequency Birdcage Coil 277 Figure 5. Total magnitude of conservative E-field (Ec , first row), magnetically-induced E-field (Ei , second row), total E-field (Etotal , third row) and rotating RF magnetic field (B1 , fourth row) after normalization when loaded with air (first column), conductive sample (second column), dielectric sample (third column) and human head model (fourth column). The z-directional size of a head image (fourth column) is longer than others to include neck and shoulder region. The electric field distribution for the conductive sample, the dielectric sample, and the weak saline (not shown) was almost the same. Table 4. Results of the 3D electromagnetic simulations within the sample at the different frequencies evaluated in this study. Mean and standard deviation (std) of circularly polarized RF magnetic field B1 and total electric field (|E|) when loaded with air, weak saline and human head model at three different frequencies of 12.8, 64, and 128 MHz. 1Sample B Mean [μT] std [10−7] Mean |E|Sample [V/m] Air (12.8 MHz) 3.4 9.2 40 Weak Saline (12.8 MHz) 3.5 7.3 20 Head (12.8 MHz) 2.5 15.2 16 Air (64 MHz) 3.6 6.9 159 Weak Saline (64 MHz) 2.9 7.1 85 Head (64 MHz) 2.3 14.4 75 Air (128 MHz) 3.6 6.4 315 Weak Saline (128 MHz) 1.5 8.4 98 Head (128 MHz) 1.9 12.7 119 a sample was increased because the additional scalar electric potential-due to the presence of the sample-had the same direction of the original one. This result extends previous published literature showing that the total elec- tric field would decrease within the sample when the coil is loaded with a conductive or a dielectric sample (as shown in (9,11)) (Table 1) and additionally demonstrate- ing that the electric field increases between coil and the sample (Table 2). This result may have consequences on subject safety. For example, the accumulation of charge Copyright © 2013 SciRes. JEMAA 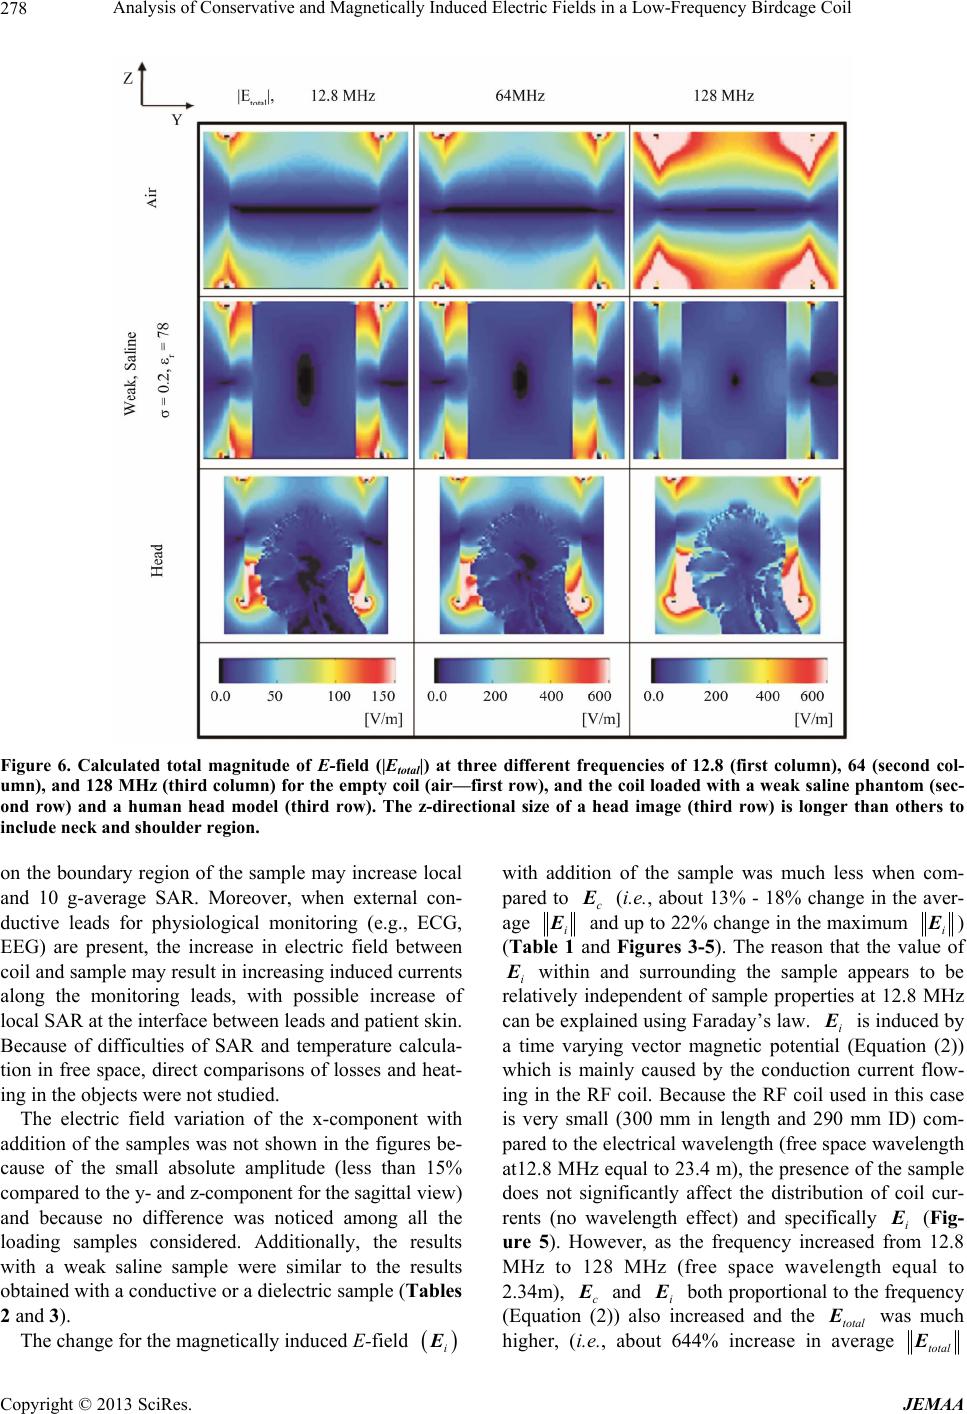 Analysis of Conservative and Magnetically Induced Electric Fields in a Low-Frequency Birdcage Coil 278 Figure 6. Calculated total magnitude of E-field (|Etotal|) at three different frequencies of 12.8 (first column), 64 (second col- umn), and 128 MHz (third column) for the empty coil (air—first row), and the coil loaded with a weak saline phantom (sec- ond row) and a human head model (third row). The z-directional size of a head image (third row) is longer than others to include neck and shoulder region. on the boundary region of the sample may increase local and 10 g-average SAR. Moreover, when external con- ductive leads for physiological monitoring (e.g., ECG, EEG) are present, the increase in electric field between coil and sample may result in increasing induced currents along the monitoring leads, with possible increase of local SAR at the interface between leads and patient skin. Because of difficulties of SAR and temperature calcula- tion in free space, direct comparisons of losses and heat- ing in the objects were not studied. The electric field variation of the x-component with addition of the samples was not shown in the figures be- cause of the small absolute amplitude (less than 15% compared to the y- and z-component for the sagittal view) and because no difference was noticed among all the loading samples considered. Additionally, the results with a weak saline sample were similar to the results obtained with a conductive or a dielectric sample (Tables 2 and 3). The change for the magnetically induced E-field i with addition of the sample was much less when com- pared to c (i.e., about 13% - 18% change in the aver- age i and up to 22% change in the maximum i ) (Table 1 and Figures 3-5). The reason that the value of i within and surrounding the sample appears to be relatively independent of sample properties at 12.8 MHz can be explained using Faraday’s law. i is induced by a time varying vector magnetic potential (Equation (2)) which is mainly caused by the conduction current flow- ing in the RF coil. Because the RF coil used in this case is very small (300 mm in length and 290 mm ID) com- pared to the electrical wavelength (free space wavelength at12.8 MHz equal to 23.4 m), the presence of the sample does not significantly affect the distribution of coil cur- rents (no wavelength effect) and specifically i (Fig- ure 5). However, as the frequency increased from 12.8 MHz to 128 MHz (free space wavelength equal to 2.34m), c and i both proportional to the frequency (Equation (2)) also increased and the total was much higher, (i.e., about 644% increase in average E total E Copyright © 2013 SciRes. JEMAA 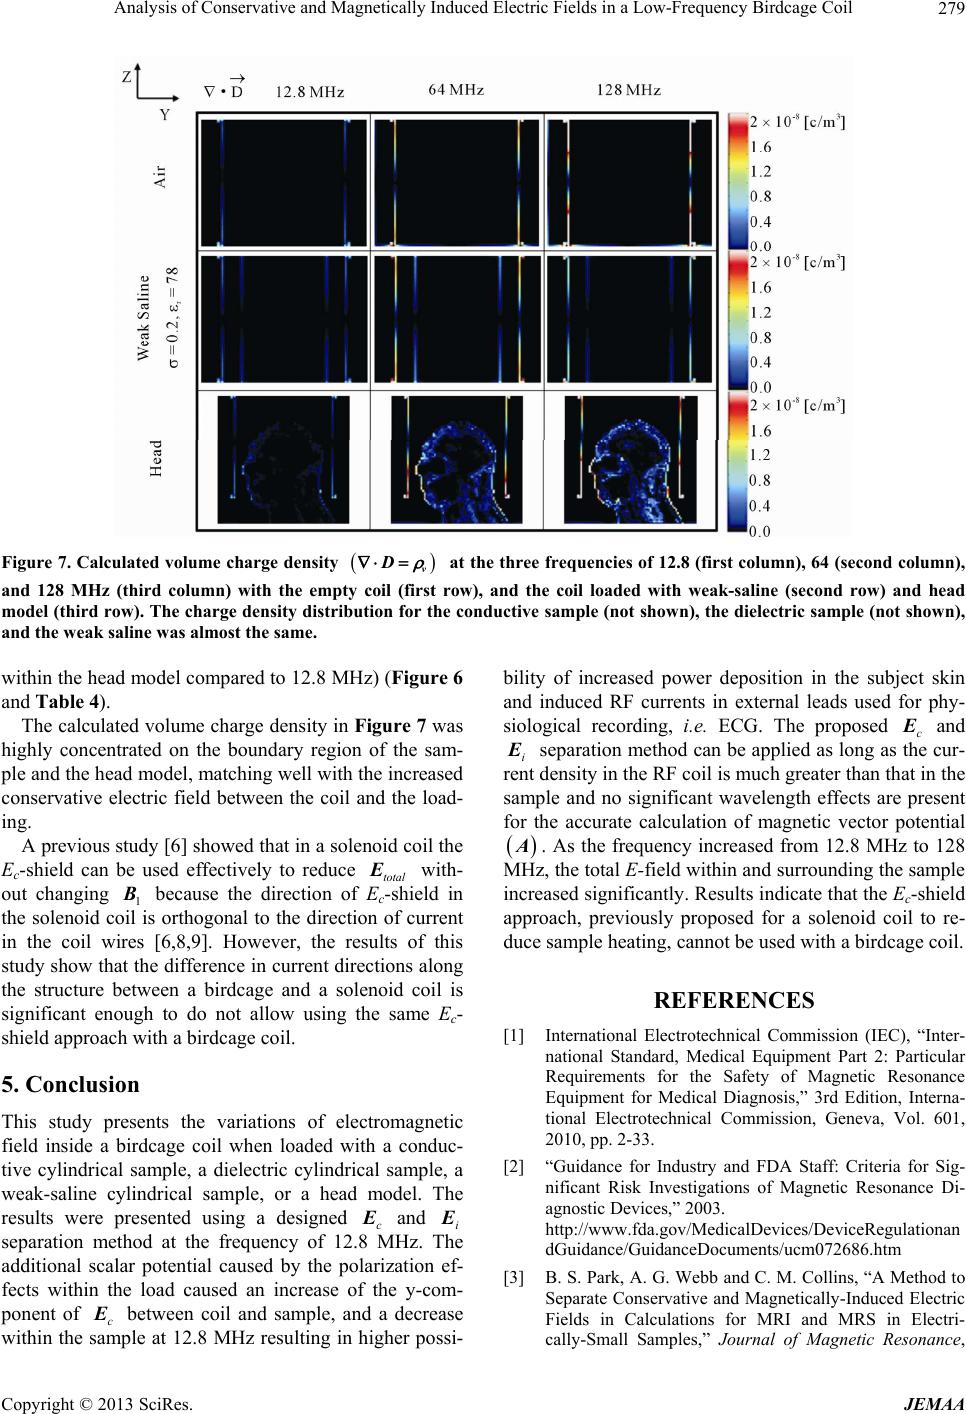 Analysis of Conservative and Magnetically Induced Electric Fields in a Low-Frequency Birdcage Coil 279 Figure 7. Calculated volume charge density v D at the three frequencies of 12.8 (first column), 64 (second column), and 128 MHz (third column) with the empty coil (first row), and the coil loaded with weak-saline (second row) and head model (third row). The charge density distribution for the conductive sample (not shown), the dielectric sample (not shown), and the weak saline was almost the same. within the head model compared to 12.8 MHz) (Figure 6 and Table 4). The calculated volume charge density in Figure 7 was highly concentrated on the boundary region of the sam- ple and the head model, matching well with the increased conservative electric field between the coil and the load- ing. A previous study [6] showed that in a solenoid coil the Ec-shield can be used effectively to reduce total with- out changing 1 E because the direction of Ec-shield in the solenoid coil is orthogonal to the direction of current in the coil wires [6,8,9]. However, the results of this study show that the difference in current directions along the structure between a birdcage and a solenoid coil is significant enough to do not allow using the same Ec- shield approach with a birdcage coil. 5. Conclusion This study presents the variations of electromagnetic field inside a birdcage coil when loaded with a conduc- tive cylindrical sample, a dielectric cylindrical sample, a weak-saline cylindrical sample, or a head model. The results were presented using a designed c and i separation method at the frequency of 12.8 MHz. The additional scalar potential caused by the polarization ef- fects within the load caused an increase of the y-com- ponent of c between coil and sample, and a decrease within the sample at 12.8 MHz resulting in higher possi- bility of increased power deposition in the subject skin and induced RF currents in external leads used for phy- siological recording, i.e. ECG. The proposed c and i separation method can be applied as long as the cur- rent density in the RF coil is much greater than that in the sample and no significant wavelength effects are present for the accurate calculation of magnetic vector potential . As the frequency increased from 12.8 MHz to 128 MHz, the total E-field within and surrounding the sample increased significantly. Results indicate that the Ec-shield approach, previously proposed for a solenoid coil to re- duce sample heating, cannot be used with a birdcage coil. REFERENCES [1] International Electrotechnical Commission (IEC), “Inter- national Standard, Medical Equipment Part 2: Particular Requirements for the Safety of Magnetic Resonance Equipment for Medical Diagnosis,” 3rd Edition, Interna- tional Electrotechnical Commission, Geneva, Vol. 601, 2010, pp. 2-33. [2] “Guidance for Industry and FDA Staff: Criteria for Sig- nificant Risk Investigations of Magnetic Resonance Di- agnostic Devices,” 2003. http://www.fda.gov/MedicalDevices/DeviceRegulationan dGuidance/GuidanceDocuments/ucm072686.htm [3] B. S. Park, A. G. Webb and C. M. Collins, “A Method to Separate Conservative and Magnetically-Induced Electric Fields in Calculations for MRI and MRS in Electri- cally-Small Samples,” Journal of Magnetic Resonance, Copyright © 2013 SciRes. JEMAA  Analysis of Conservative and Magnetically Induced Electric Fields in a Low-Frequency Birdcage Coil 280 Vol. 199, No. 2, 2009, pp. 233-237. doi:10.1016/j.jmr.2009.05.007 [4] D. I. Hoult and P. C. Lauterbur, “The Sensitivity of the Zeugmatographic Experiment Involving Human Sam- ples,” Journal of Magnetic Resonance, Vol. 34, No. 2, 1979, pp. 425-433. [5] W. Mao, B. A. Chronik, R. E. Feldman, M. B. Smith and C. M. Collins, “Consideration of Magnetically-Induced and Conservative Electric Fields within a Loaded Gradi- ent Coil,” Magnetic Resonance in Medicine, Vol. 55, No. 6, 2006, pp. 1424-1432. doi:10.1002/mrm.20897 [6] B. S. Park, T. Neuberger, A. G. Webb, D. C. Bigler and C. M. Collins, “Faraday Shields within a Solenoidal Coil to Reduce Sample Heating: Numerical Comparison of De- signs and Experimental Verification,” Journal of Mag- netic Resonance, Vol. 202, No. 1, 2010, pp. 72-77. doi:10.1016/j.jmr.2009.09.023 [7] D. G. Gadian and F. N. H. Robinson, “Radiofrequency Losses on NMR Experiments on Electrically Conducting Samples,” Journal of Magnetic Resonance, Vol. 34, No. 2, 1979, pp. 449-455. [8] A. Krahn, U. Priller, L. Emsley and F. Engelke, “Reso- nator with Reduced Sample Heating and Increased Ho- mogeneity for Solid-State NMR,” Journal of Magnetic Resonance, Vol. 191 No. 1, 2008, pp. 78-92. doi:10.1016/j.jmr.2007.12.004 [9] F. D. Doty, J. Kulkarni, C. Turner, G. Entzminger and A. Bielecki, “Using a Cross-Coil to Reduce RF Heating by an Order of Magnitude in Triple-Resonance Multinuclear MAS at High Fields,” Journal of Magnetic Resonance, Vol. 128 No. 2, 2006, pp. 239-253. doi:10.1016/j.jmr.2006.06.031 [10] P. T. Hardy Jr. and K. M. Weil, “A Review of Thermal MR Injuries,” Radiologic Technology, Vol. 81, No. 6, 2010, pp. 606-609. [11] Q. X. Yang, “A Method of Utilization of High Dielectric Constant (HDC) Materials for Reducing SAR and En- hancing SNR in MRI,” US Patent No. 20,110,152,670, 2011. [12] K. R. Minard and R. A. Wind, “Solenoidal Microcoil design-Part II: Optimizing Winding Parameters for Maximum Signal-to-Noise Performance,” Nuclear Mag- netic Resonance, Vol. 13 No. 3, 2001, pp. 190-210. doi:10.1002/cmr.1008 [13] C. M. Collins and M. B. Smith, “Calculations of B1 Dis- tribution, SNR and SAR for a Surface Coil Adjacent to an Anatomically-Accurate Human Body Model,” Magnetic Resonance in Medicine, Vol. 45, No. 4, 2001, pp. 692- 699. doi:10.1002/mrm.1092 [14] C. M. Collins and M. B. Smith, “Signal-to-Noise Ratio and Absorbed Power as Functions of Main Magnetic Field Strength, and Definition of ‘90˚’ RF Pulse for the Head in the Birdcage Coil,” Magnetic Resonance in Medicine, Vol. 45, No. 4, 2001, pp. 684-691. doi:10.1002/mrm.1091 [15] K. Yee, “Numerical Solution of Initial Boundary Value Problems Involving Maxwell’s Equations in Isotropic media,” IEEE Transactions on Antennas and Propagation, Vol. 14, No. 3, 1966, pp. 302-307. doi:10.1109/TAP.1966.1138693 [16] C. Gabriel, T. Y. A. Chan and E. H. Grant, “Admittance Models for Open Ended Coaxial Probes and Their Place in Dielectric Spectroscopy,” Physics in Medicine and Bi- ology, Vol. 39, No. 12, 1994, pp. 2183-2200. doi:10.1088/0031-9155/39/12/004 [17] Federal Communication Commission (FCC), “Body Tis- sue Dielectric Parameters,” 2010. http://transition.fcc.gov/oet/rfsafety/dielectric.html Copyright © 2013 SciRes. JEMAA
|