Paper Menu >>
Journal Menu >>
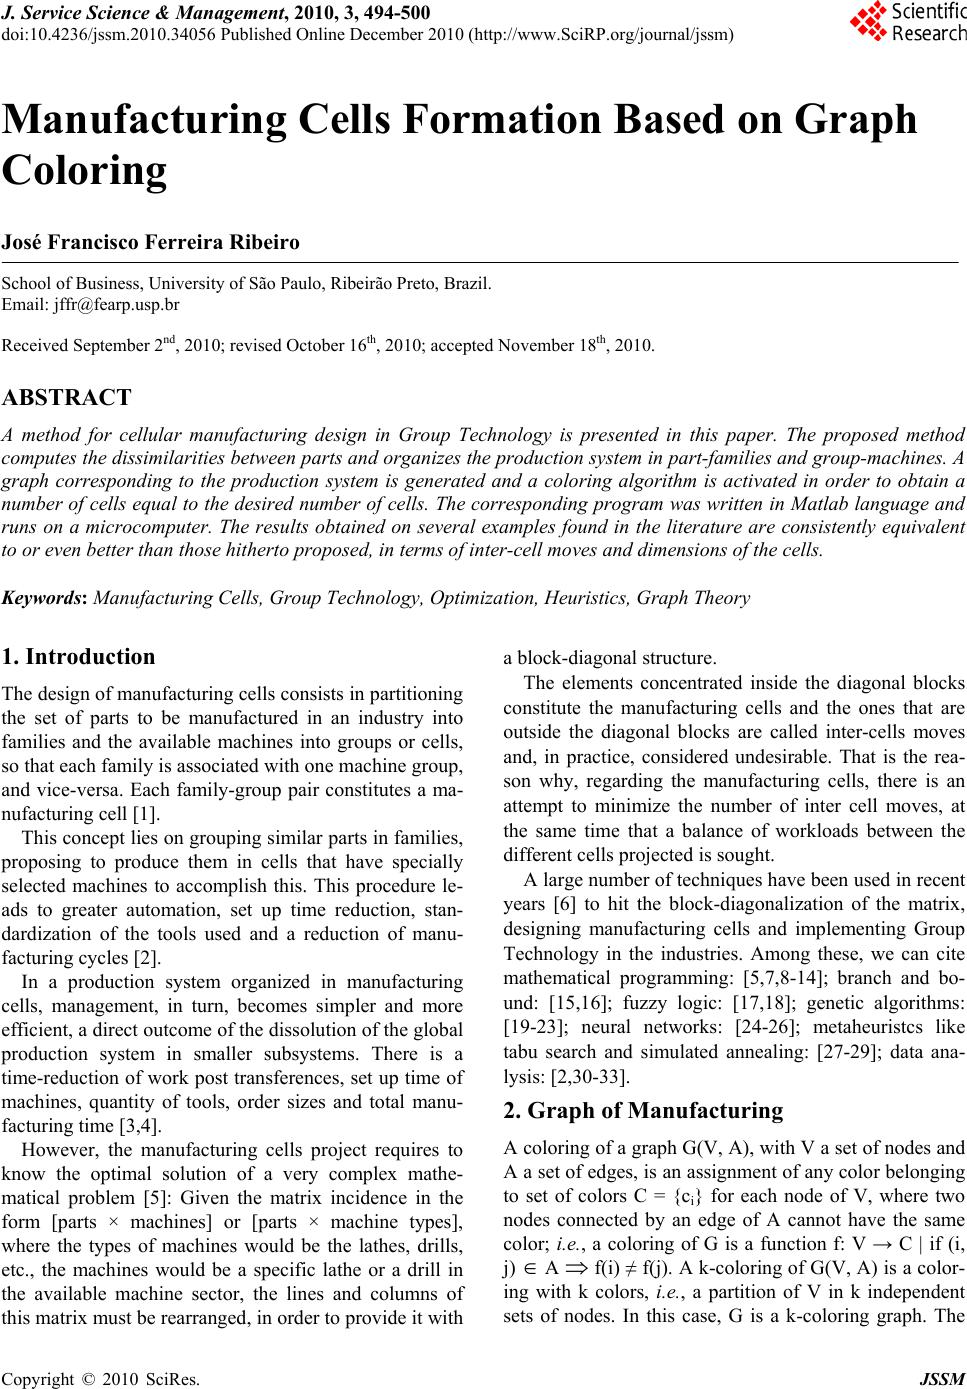 J. Service Science & Management, 2010, 3, 494-500 doi:10.4236/jssm.2010.34056 Published Online December 2010 (http://www.SciRP.org/journal/jssm) Copyright © 2010 SciRes. JSSM Manufacturing Cells Formation Based on Graph Coloring José Francisco Ferreira Ribeiro School of Business, University of São Paulo, Ribeirão Preto, Brazil. Email: jffr@fearp.usp.br Received September 2nd, 2010; revised October 16th, 2010; accepted November 18th, 2010. ABSTRACT A method for cellular manufacturing design in Group Technology is presented in this paper. The proposed method computes the dissimilarities between pa rts and or ganizes the produ ction system in pa rt-families a nd group-ma chin es. A graph corresponding to the production system is generated and a coloring algorithm is activated in order to obtain a number of cells equal to the desired number of cells. The corresp onding program was written in Matlab language and runs on a microcomputer. The results obtained on several examples found in the literature are consistently equivalent to or even better than those hitherto proposed, in terms of inter-cell moves and dimensions of the cells. Keywords: Manufacturing Cells, Group Technology, Optimization, Heuristics, Graph Theory 1. Introduction The design of manufacturing cells consists in partitioning the set of parts to be manufactured in an industry into families and the available machines into groups or cells, so that each family is associated with one machine group, and vice-versa. Each family-group pair constitutes a ma- nufacturing cell [1]. This concept lies on grouping similar parts in families, proposing to produce them in cells that have specially selected machines to accomplish this. This procedure le- ads to greater automation, set up time reduction, stan- dardization of the tools used and a reduction of manu- facturing cycles [2]. In a production system organized in manufacturing cells, management, in turn, becomes simpler and more efficient, a direct outcome of the dissolution of the global production system in smaller subsystems. There is a time-reduction of work post transferences, set up time of machines, quantity of tools, order sizes and total manu- facturing time [3,4]. However, the manufacturing cells project requires to know the optimal solution of a very complex mathe- matical problem [5]: Given the matrix incidence in the form [parts × machines] or [parts × machine types], where the types of machines would be the lathes, drills, etc., the machines would be a specific lathe or a drill in the available machine sector, the lines and columns of this matrix must be rearranged, in order to provide it with a block-diagonal structure. The elements concentrated inside the diagonal blocks constitute the manufacturing cells and the ones that are outside the diagonal blocks are called inter-cells moves and, in practice, considered undesirable. That is the rea- son why, regarding the manufacturing cells, there is an attempt to minimize the number of inter cell moves, at the same time that a balance of workloads between the different cells projected is sought. A large number of techniques have been used in recent years [6] to hit the block-diagonalization of the matrix, designing manufacturing cells and implementing Group Technology in the industries. Among these, we can cite mathematical programming: [5,7,8-14]; branch and bo- und: [15,16]; fuzzy logic: [17,18]; genetic algorithms: [19-23]; neural networks: [24-26]; metaheuristcs like tabu search and simulated annealing: [27-29]; data ana- lysis: [2,30-33]. 2. Graph of Manufacturing A coloring of a graph G(V, A), with V a set of nodes and A a set of edges, is an assignment of any color belonging to set of colors C = {ci} for each node of V, where two nodes connected by an edge of A cannot have the same color; i.e., a coloring of G is a function f: V → C | if (i, j)A f(i) ≠ f(j). A k-coloring of G(V, A) is a color- ing with k colors, i.e., a partition of V in k independent sets of nodes. In this case, G is a k-coloring graph. The 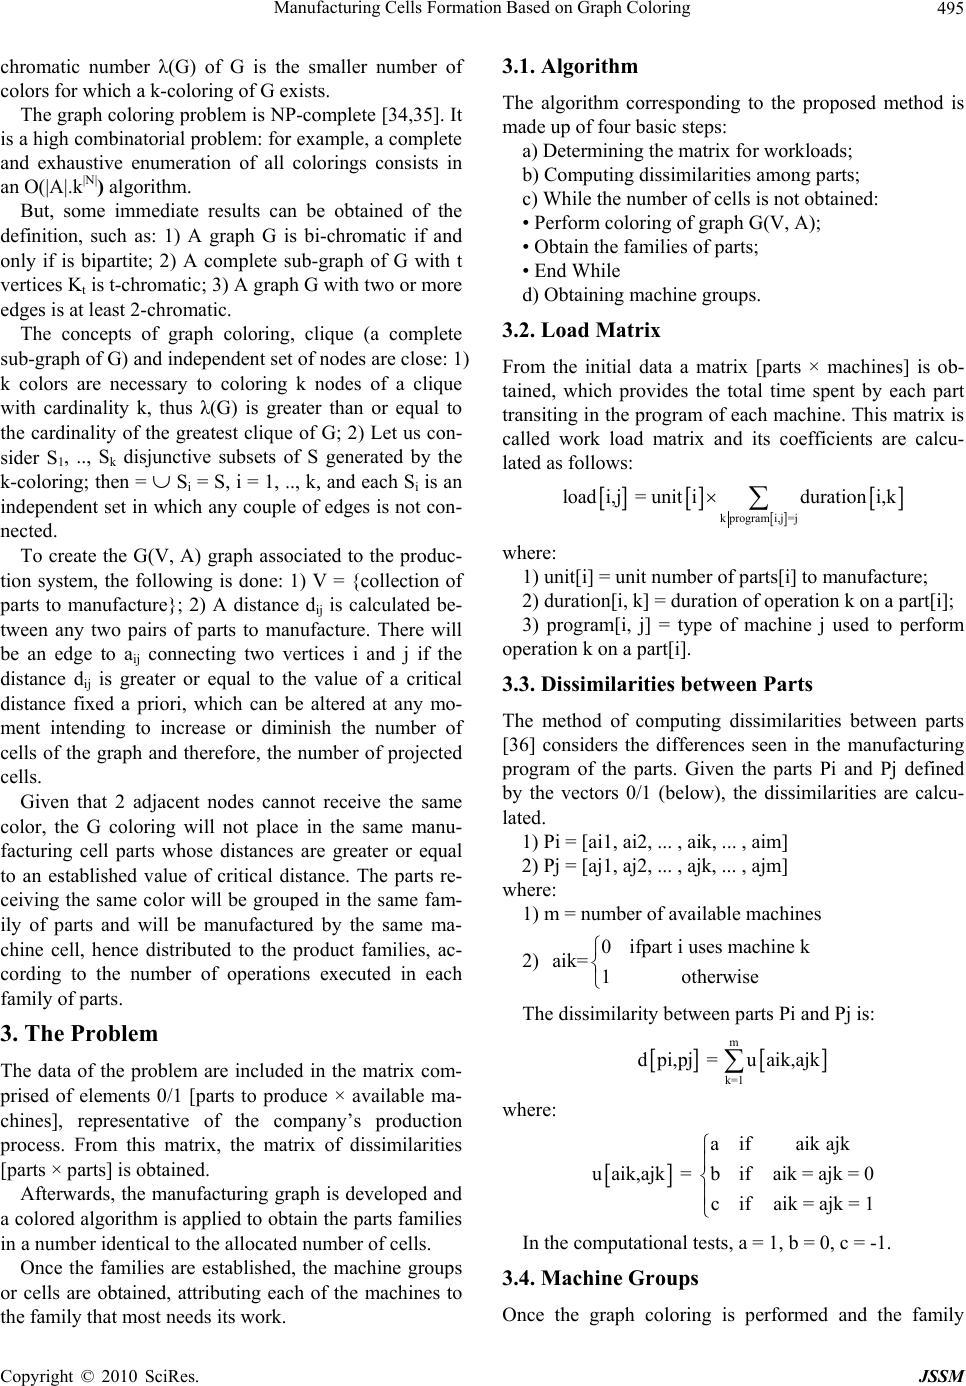 Manufacturing Cells Formation Based on Graph Coloring495 chromatic number λ(G) of G is the smaller number of colors for which a k-coloring of G exists. The graph coloring problem is NP-complete [34,35]. It is a high combinatorial problem: for example, a complete and exhaustive enumeration of all colorings consists in an O(|A|.k|N|) algorithm. But, some immediate results can be obtained of the definition, such as: 1) A graph G is bi-chromatic if and only if is bipartite; 2) A complete sub-graph of G with t vertices Kt is t-chromatic; 3) A graph G with two or more edges is at least 2-chromatic. The concepts of graph coloring, clique (a complete sub-graph of G) and independent set of nodes are close: 1) k colors are necessary to coloring k nodes of a clique with cardinality k, thus λ(G) is greater than or equal to the cardinality of the greatest clique of G; 2) Let us con- sider S1, .., Sk disjunctive subsets of S generated by the k-coloring; then = Si = S, i = 1, .., k, and each Si is an independent set in which any couple of edges is not con- nected. To create the G(V, A) graph associated to the produc- tion system, the following is done: 1) V = {collection of parts to manufacture}; 2) A distance dij is calculated be- tween any two pairs of parts to manufacture. There will be an edge to aij connecting two vertices i and j if the distance dij is greater or equal to the value of a critical distance fixed a priori, which can be altered at any mo- ment intending to increase or diminish the number of cells of the graph and therefore, the number of projected cells. Given that 2 adjacent nodes cannot receive the same color, the G coloring will not place in the same manu- facturing cell parts whose distances are greater or equal to an established value of critical distance. The parts re- ceiving the same color will be grouped in the same fam- ily of parts and will be manufactured by the same ma- chine cell, hence distributed to the product families, ac- cording to the number of operations executed in each family of parts. 3. The Problem The data of the problem are included in the matrix com- prised of elements 0/1 [parts to produce × available ma- chines], representative of the company’s production process. From this matrix, the matrix of dissimilarities [parts × parts] is obtained. Afterwards, the manufacturing graph is developed and a colored algorithm is applied to obtain the parts families in a number identical to the allocated number of cells. Once the families are established, the machine groups or cells are obtained, attributing each of the machines to the family that most needs its work. 3.1. Algorithm The algorithm corresponding to the proposed method is made up of four basic steps: a) Determining the matrix for workloads; b) Computing dissimilarities among parts; c) While the number of cells is not obtained: • Perform coloring of graph G(V, A); • Obtain the families of parts; • End While d) Obtaining machine groups. 3.2. Load Matrix From the initial data a matrix [parts × machines] is ob- tained, which provides the total time spent by each part transiting in the program of each machine. This matrix is called work load matrix and its coefficients are calcu- lated as follows: k programi,j=j loadi,j = unitidurationi,k where: 1) unit[i] = unit number of parts[i] to manufacture; 2) duration[i, k] = duration of operation k on a part[i]; 3) program[i, j] = type of machine j used to perform operation k on a part[i]. 3.3. Dissimilarities between Parts The method of computing dissimilarities between parts [36] considers the differences seen in the manufacturing program of the parts. Given the parts Pi and Pj defined by the vectors 0/1 (below), the dissimilarities are calcu- lated. 1) Pi = [ai1, ai2, ... , aik, ... , aim] 2) Pj = [aj1, aj2, ... , ajk, ... , ajm] where: 1) m = number of available machines 2) 0ifpart i uses machine k aik= 1otherwise The dissimilarity between parts Pi and Pj is: m k=1 dpi,pj = uaik,ajk where: aif aikajk uaik,ajk = bifaik = ajk = 0 cifaik = ajk = 1 In the computational tests, a = 1, b = 0, c = -1. 3.4. Machine Groups Once the graph coloring is performed and the family Copyright © 2010 SciRes. JSSM 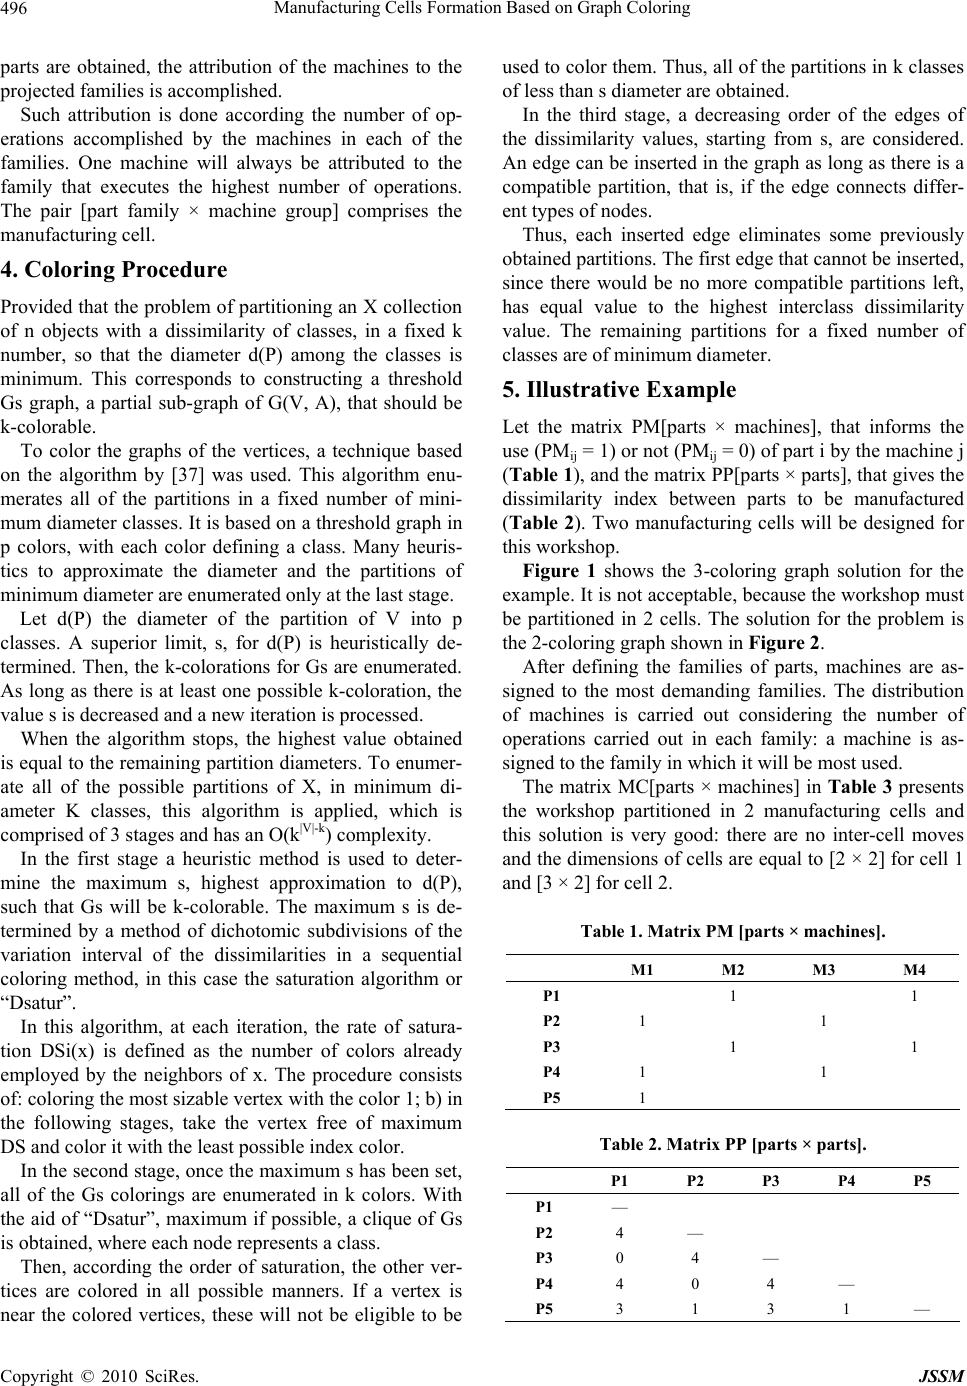 Manufacturing Cells Formation Based on Graph Coloring 496 parts are obtained, the attribution of the machines to the projected families is accomplished. Such attribution is done according the number of op- erations accomplished by the machines in each of the families. One machine will always be attributed to the family that executes the highest number of operations. The pair [part family × machine group] comprises the manufacturing cell. 4. Coloring Procedure Provided that the problem of partitioning an X collection of n objects with a dissimilarity of classes, in a fixed k number, so that the diameter d(P) among the classes is minimum. This corresponds to constructing a threshold Gs graph, a partial sub-graph of G(V, A), that should be k-colorable. To color the graphs of the vertices, a technique based on the algorithm by [37] was used. This algorithm enu- merates all of the partitions in a fixed number of mini- mum diameter classes. It is based on a threshold graph in p colors, with each color defining a class. Many heuris- tics to approximate the diameter and the partitions of minimum diameter are enumerated only at the last stage. Let d(P) the diameter of the partition of V into p classes. A superior limit, s, for d(P) is heuristically de- termined. Then, the k-colorations for Gs are enumerated. As long as there is at least one possible k-coloration, the value s is decreased and a new iteration is processed. When the algorithm stops, the highest value obtained is equal to the remaining partition diameters. To enumer- ate all of the possible partitions of X, in minimum di- ameter K classes, this algorithm is applied, which is comprised of 3 stages and has an O(k|V|-k) complexity. In the first stage a heuristic method is used to deter- mine the maximum s, highest approximation to d(P), such that Gs will be k-colorable. The maximum s is de- termined by a method of dichotomic subdivisions of the variation interval of the dissimilarities in a sequential coloring method, in this case the saturation algorithm or “Dsatur”. In this algorithm, at each iteration, the rate of satura- tion DSi(x) is defined as the number of colors already employed by the neighbors of x. The procedure consists of: coloring the most sizable vertex with the color 1; b) in the following stages, take the vertex free of maximum DS and color it with the least possible index color. In the second stage, once the maximum s has been set, all of the Gs colorings are enumerated in k colors. With the aid of “Dsatur”, maximum if possible, a clique of Gs is obtained, where each node represents a class. Then, according the order of saturation, the other ver- tices are colored in all possible manners. If a vertex is near the colored vertices, these will not be eligible to be used to color them. Thus, all of the partitions in k classes of less than s diameter are obtained. In the third stage, a decreasing order of the edges of the dissimilarity values, starting from s, are considered. An edge can be inserted in the graph as long as there is a compatible partition, that is, if the edge connects differ- ent types of nodes. Thus, each inserted edge eliminates some previously obtained partitions. The first edge that cannot be inserted, since there would be no more compatible partitions left, has equal value to the highest interclass dissimilarity value. The remaining partitions for a fixed number of classes are of minimum diameter. 5. Illustrative Example Let the matrix PM[parts × machines], that informs the use (PMij = 1) or not (PMij = 0) of part i by the machine j (Table 1), and the matrix PP[parts × parts], that gives the dissimilarity index between parts to be manufactured (Table 2). Two manufacturing cells will be designed for this workshop. Figure 1 shows the 3-coloring graph solution for the example. It is not acceptable, because the workshop must be partitioned in 2 cells. The solution for the problem is the 2-coloring graph shown in Figure 2. After defining the families of parts, machines are as- signed to the most demanding families. The distribution of machines is carried out considering the number of operations carried out in each family: a machine is as- signed to the family in which it will be most used. The matrix MC[parts × machines] in Table 3 presents the workshop partitioned in 2 manufacturing cells and this solution is very good: there are no inter-cell moves and the dimensions of cells are equal to [2 × 2] for cell 1 and [3 × 2] for cell 2. Table 1. Matrix PM [parts × machines]. M1 M2 M3 M4 P1 1 1 P2 1 1 P3 1 1 P4 1 1 P5 1 Table 2. Matrix PP [parts × parts]. P1 P2 P3 P4 P5 P1 — P2 4 — P3 0 4 — P4 4 0 4 — P5 3 1 3 1 — Copyright © 2010 SciRes. JSSM  Manufacturing Cells Formation Based on Graph Coloring497 Figure 1. Three-coloring graph. Figure 2. Two-coloring graph. Table 3. Matrix MC [parts × machines]. M2 M4 M1 M3 P1 1 1 P3 1 1 P2 1 1 P4 1 1 P5 1 6. Computational Results The corresponding program to the method presented was written in Matlab language and is incorporated in a mi- crocomputer: program MCF (Manufacturing Cells For- mation). Up to now, the results obtained about literature exam- ples (E) are equivalent or better than those proposed, with regards to the number of inter-cells movements (I) and the dimensions of the cells (D). Table 4 summarizes 15 tests conducted on classical examples extracted from literature. The results obtained (S) induced a diminishing of the number of inter-cell moves for the first 3 examples of Table 4, at the same time that the cell dimensions continued the same or prac- tically the same up to what is currently known. The computational time (T) required to solve all the problems dealt always under 10 seconds. The time mea- surements were done in a Pentium 2.20 GHz, 1.99 GB. In addition to testing the 15 examples in order to compare the results, we generated 1000 random samples with 10 to 100 machines and 10 to 1000 parts, for per- formance tests. Figures 3 and Figure 4 show the per- formance of the method in terms of inter-cell movements (maximum = 243) and computational time (maximum = 12 minutes). Table 4. Tests. E S I D 1 [32] [32] MCF 4 2 4 × 6, 5 × 6 4 × 6, 5 × 6 2 [31] [31] MCF 24 16 5 × 4, 10 × 6, 15 × 6 5 × 3, 10 × 6, 15 × 7 3 [31] [31] MCF 15 14 6 × 5, 4 × 4, 4 × 5, 3 × 3, 3 × 3 5 × 4, 4 × 3, 4 × 5, 3 × 4, 4 × 4 4 [31] [31] MCF 1 1 7 × 7, 6 × 5, 4 × 5, 3 × 3 7 × 7, 6 × 5, 4 × 5, 3 × 3 5 [38] [38] MCF 0 0 2 × 5, 3 × 3, 2 × 6, 3 × 6 2 × 5, 3 × 3, 2 × 6, 3 × 6 6 [1] [32] MCF 0 0 16 × 8, 7 × 4, 20 × 8 16 × 8, 7 × 4, 20 × 8 7 [1] [32] MCF 1 1 — 13 × 5, 7 × 4, 23 × 10 8 [39] [39] MCF 6 6 — 12 × 9, 10 × 8, 19 × 13 9 [39] [40] MCF 3 3 — 25 × 19, 16 × 11 10 [31] [31] MCF 0 0 6 × 4, 9 × 5, 5 × 3 6 × 4, 9 × 5, 5 × 3 11 [41] [41] MCF 0 0 4 × 5, 3 × 5, 3 × 5 4 × 5, 3 × 5, 3 × 5 12 [32] [32] MCF 1 1 4 × 3, 3 × 4 3 × 3, 4 × 4 13 [5] [5] MCF 0 0 2 × 2, 3 × 2 2 × 2, 3 × 2 14 [42] [42] MCF 2 2 3 × 2, 4 × 3 3 × 2, 4 × 3 15 [43] [43] MCF 2 2 3 × 2, 4 × 3 3 × 2, 4 × 3 Figure 3. Inter-cell moves. Copyright © 2010 SciRes. JSSM  Manufacturing Cells Formation Based on Graph Coloring Copyright © 2010 SciRes. JSSM 498 7. Conclusions A method of coloring graphs to assist the manufacturing cells project was presented and discussed in the present article. The method is grounded on a procedure that un- derstands computing dissimilarities among parts and the coloring of a threshold graph, which aims at grouping the parts in families and the machines in subsets, so that a single subset of machines corresponds to each family of parts and vice versa. The obtained solution tries to minimize the number of inter-cell moves, to the extent that it tries to group the parts with closely corresponding manufacturing pro- grams and separate the parts with different programs. Figure 4. Computational time. Table 5. Manufacturing cells (I = 2). M 1 M 2 M 4 M 6 M 8 M 11 M 3 M 5 M 7 M 9 M 10 M 12 P1 1 1 1 1 1 P2 1 1 1 1 1 P3 1 1 1 1 P5 1 1 1 1 1 P6 1 1 1 1 1 P4 1 1 1 1 P7 1 1 1 P8 1 1 1 P9 1 1 1 1 1 Table 6. Manufacturing cells (I = 0). M 3 M 5 M 7 M 9 M 10 M 11 M 1 M 2 M 4 M 6 M 8 M 12 P4 1 1 1 1 P5 1 1 1 1 1 P7 1 1 1 P8 1 1 1 P1 1 1 1 1 1 P2 1 1 1 1 1 P3 1 1 1 1 P6 1 1 1 1 1 P9 1 1 1 1 1 REFERENCES The examples here dealt with (Table 4, Figure 3 and Figure 4) show the method’s efficiency in the quality of the obtained solutions (the number of inter-cell move- ments was reduced in 3 cases from literature) as well as computational time, or in memory space taken up in the machine, therefore, becoming accessible to a great num- ber of companies, especially the small and mid-sized ones. [1] J. L. Burbidge, “The Introduction of Group Technology,” John Wiley, 1975. [2] J. F. F. Ribeiro and S. Meguelati, “Organização de um Sistema de Produção em Células de Fabricação,” Revista Gestão e Produção, Vol. 9, No. 1, 2002, pp. 62-77. [3] N. L. Hyer and U. Wemmerlow, “GT in US Manufactur- ing Industry,” International Journal of Production Re- search, Vol. 27, No. 8, 1989, pp. 1287-1304. Table 5 an d Table 6 present two solutions found by the presented method for the workshop proposed by [2]. The first solution presents 2 inter-cell moves and the second 0 inter-cell moves. [4] F. Mahmoodi, K. J. Dooley and P. J. Starr, “An Investi- gation of Dynamic Group Scheduling Heuristics in a Job Shop Manufacturing Cell,” International Journal of Pro-  Manufacturing Cells Formation Based on Graph Coloring499 duction Research, Vol. 28, No. 9, 1990, pp. 1695-1711. [5] A. Kusiak, “The Generalized Group Technology Con- cept,” International Journal of Production Research, Vol. 25, No. 4, 1987, pp. 561-569. [6] N. Singh, “Design of Cellular Manufacturing Systems: An Invited Review,” European Journal of Operational Research, Vol. 69, No. 3, 1993, pp. 284-291. [7] F. F. Boctor, “A Linear Formulation of the Machine–Part Cell Formation Problem,” International Journal of Pro- duction Research, Vol. 29, No. 2, 1991, pp. 343-356. [8] F. F. Boctor, “The Minimum Cost - Machine–Part Cell Formation,” International Journal of Production Re- search, Vol. 34, No. 4, 1996, pp. 1045-1063. [9] S. Oliveira, J. F. F. Ribeiro and S. C. Seok, “A Spectral Clustering Algorithm for Manufacturing Cell Formation,” Computers and Industrial Engineering, Vol. 57, No. 3, 2009, pp. 1008-1014. [10] V. Ramabhatta and R. Nagi, “An Integrated Formulation of Manufacturing Cell Formation,” Operations Research, Vol. 77, No. 1, 1998, pp. 79-95. [11] S. M. Shafer and G. M. Kern, “A Mathematical Pro- gramming Approach for Dealing with Exceptional Ele- ments in Cellular Manufacturing,” International Journal of Production Research, Vol. 30, No. 5, 1992, pp. 1029- 1036. [12] J. Slomp, B. V. Chowdary and N. Suresh, “Design of Virtual Manufacturing Cells: A Mathematical Program- ming Approach,” Robotics and Computer Integrated Manufacturing, Vol. 21, No. 3, 2005, pp. 273-288. [13] S. Viswanathan, “Configuring Cellular Manufacturing Systems: A Quadratic Integer Programming Formulation and A Simple Interchange Heuristic,” International Journal of Production Research, Vol. 33, No. 2, 1995, pp. 361-376. [14] Y. Won, “Two–Phase Approach to GT Cell Formation Using Efficient P–Median Formulations,” International Journal of Production Research, Vol. 38, No. 7, 2000, pp. 1601-1613. [15] M. Boulif and K. Atif, “A New Branch–And–Bound En- hanced Genetic Algorithm for the Manufacturing Cell Formation,” Computers and Operations Research, Vol. 33, No. 8, 2006, pp. 2219-2245. [16] I. Al-Qattan-Al, “Designing Flexible Manufacturing Cells Using a Branch–and–Bound Method,” International Journal of Production Research, Vol. 28, No. 2, 1990, pp. 325-336. [17] C. H. Chu and J. C. Hayya, “A Fuzzy Clustering Ap- proach to Manufacturing Cell Formation,” International Industrial Engineering Conference, Orlando, 1991, pp. 495-500. [18] H. Xu and H. P. Wang, “Part-Family Formation for Group Technology Applications Based on Fuzzy Mathe- matics,” International Journal of Production Research, Vol. 27, No. 9, 1989, pp. 1637-1651. [19] C. Dimipoulos and N. A. Mort, “Hierarchical Clustering Methodology Based on Genetic Programming for the So- lution of Simple Cell–Formation Problems,” Interna- tional Journal of Production Research, Vol. 39, No. 17, 2001, pp. 1-19. [20] G. Jeon and H. R. Leep, “Forming Part Families by Using Genetic Algorithm and Designing Machine Cells under Demand Changes,” Computers and Operations Research, Vol. 33, No. 1, 2006, pp. 263-283. [21] A. Rajagopalan and D. J. Fonseca, “Volume Sensitivity Analysis for Manufacturing Cells: A Genetic Algorithm,” Journal of Advanced Manufacturing Systems, Vol. 4, No. 2, 2005, pp. 167-183. [22] V. Venugopal and T. T. Narendran, “Cell Formation in Manufacturing Systems through Simulated Annealing: An Experimental Evaluation,” European Journal of Op- erational Research, Vol. 63, No. 2, 1992, pp. 409-422. [23] C. Zhao and Z. A. Wu, “Genetic Algorithm for Manufac- turing Cell Formation with Multiple Routes and Multiples Objectives,” International Journal of Production Re- search, Vol. 38, No. 1, 2000, pp. 385-395. [24] A. Kusiak and Y. Chung, “GT/ART: Using Neural Net- works to Form Machine Cells,” Manufacturing Review, Vol. 4, No. 4, 1991, pp. 293-301. [25] H. Lee, C. O. Malave and S. Ramachandran, “Neural Network–Based Design of Cellular Manufacturing Sys- tems,” Journal of Intelligent Manufacturing, Vol. 3, 1992, pp. 325-332. [26] Y. B. Moon and S. C. Chi, “Generalized Part–Family Formation Using Neural Network Techniques,” Journal of Manufacturing Systems, Vol. 11, No. 3, 1992, pp. 149- 159. [27] G. K. Adil, D. Rajanani and D. Strong, “Assignment Al- location and Simulated Annealing Algorithms for Cell Formation,” IIE Transactions, Vol. 29, No. 1, 1997, pp. 53-67. [28] S. Sofianopoulou, “Manufacturing Cell Design with Al- ternative Process Plans and/or Replicate Machines,” In- ternational Journal of Production Research, Vol. 37, No. 3, 1999, pp. 707-720. [29] V. Venugopal and T. T. Narendran, “A Genetic Algo- rithm Approach to the Machine–Component Grouping Problem with Multiple Objectives,” Computers and In- dustrial Engineering, Vol. 22, No. 4, 1992, pp. 469-480. [30] S. J. Deutsch, S. F. Freeman and M. Helander, “Manu- facturing Cell Formation Using an Improved P–Median Model,” Computers and Industrial Engineering, Vol. 34, No. 1, 1998, pp. 135-146. [31] G. Harhalalkis, R. Nagi and J. M. Proth, “An Efficient Heuristic in Manufacturing Cell Formation for Group Technology Applications,” International Journal of Pro- duction Research, Vol. 28, No. 1, 1990, pp. 185-198. [32] S. Meguelati, “Methodes de Classification Pour la Con- stitution d’ilots de Fabrication,” Rapport LAAS 98175, Toulouse, 1998. [33] J. F. F. Ribeiro and B. Pradin, “A Methodology for Cel- lular Manufacturing Design,” International Journal of Production Research, Vol. 31, No. 1, 1993, pp. 235-250. Copyright © 2010 SciRes. JSSM  Manufacturing Cells Formation Based on Graph Coloring Copyright © 2010 SciRes. JSSM 500 [34] A. Aho, J. Hopcroft and J. Ullman, “Data Structure and Algorithms,” Addison Wesley, Massachusetts, 1983. [35] M. R. Garey and D. S. Johnson, “Computers and Intrac- tability,” Freeman, 1979. [36] S. Oliveira, J. F. F. Ribeiro and S. C. Seok, “A Compara- tive Study of Similarity Measures for Manufacturing Cell Formation,” Journal of Manufacturing Systems, Vol. 27, No. 1, 2008, pp. 19-25. [37] A. Guenoche, “Enumeration des Partitions de Diametre Minimum,” Discrete Mathematics, Vol. 111, No. 1-3, 1993, pp. 227-287. [38] G. Srinivasan, “An Assignment Model for the Part-Fami- lies Problem in Group Technology,” International Jour- nal of Production Research, Vol. 28, No. 1, 1990, pp. 145-152. [39] K. R. Kumar and A. Vanelli, “Strategic Subcontratcting for Efficient Disaggregated Manufacturing,” Interna- tional Journal of Production Research, Vol. 25, No. 12, 1987, pp. 1715-1728. [40] J. C. Wei and G. M. Kern, “Commonality Analysis: A linear Cell Clustering Algorithm for Group Technology,” International Journal of Production Research, Vol. 27, No. 12, 1989, pp. 2053-2062. [41] H. M. Chan and D. A. Milner, “Direct Cluster Algorithm for Group Formation in Cellular Manufacture,” Journal of Manufacturing Systems, Vol. 1, 1981, pp. 235-242. [42] A. Ballakur and H. J. Steudel, “A within Cell Based Heu- ristic for Designing Cellular Manufacturing Systems,” International Journal of Production Research, Vol. 25, No. 5, 1987, pp. 639-665. [43] P. H. Waghodekar and S. Sahu, “Machine-Component Cell Formation in Group Technology: MACE,” Interna- tional Journal of Production Research, Vol. 22, No. 6, 1984, pp. 937-948. |