 Food and Nutrition Sciences, 2013, 4, 113-123 http://dx.doi.org/10.4236/fns.2013.47A014 Published Online July 2013 (http://www.scirp.org/journal/fns) Milk Spoilage: Methods and Practices of Detecting Milk Quality Michael Lu, Yvonne Shiau, Jacklyn Wong, Raishay Lin, Hannah Kravis, Thomas Blackmon, Tanya Pakzad, Tiffany Jen, Amy Cheng, Jonathan Chang, Erin Ong, Nima Sarfaraz, Nam Sun Wang* Department of Chemical & Biomolecular Engineering, University of Maryland, College Park, USA. Email: *nsw@umd.edu Received March 28th, 2013; revised April 28th, 2013; accepted May 5th, 2013 Copyright © 2013 Michael Lu et al. This is an open access article distributed under the Creative Commons Attribution License, which permits unrestricted use, distribution, and reproduction in any medium, provided the original work is properly cited. ABSTRACT Milk spoilage is an indefinite term and difficult to measure with accuracy. This uncertainty can cause suffering for both milk manufacturers and consumers. Consumers who have been misled by ambiguous expiration dates on milk cartons waste resources by disposing of unspoiled milk or experience discomfort from drinking spoiled milk. Consumers are often unwilling to purchase products close to their inaccurate expiration dates. This consumer behavior has a negative financial impact on milk producers. Inaccurate milk spoilage detection methods also force milk producers to use overly conservative expiration dates in an effort to avoid the legal and economic consequences of consumers experiencing ill- ness from drinking spoiled milk. Over the last decade, new methods have been researched with the purpose of develop- ing more accurate and efficient means of detecting milk spoilage. These methods include indicators based on pH bacte- ria counts and gas-sensor arrays. This article explores various methods of spoilage detection designed to prevent such consequences. The respective level of effectiveness of each method is discussed, as well as several further approaches to contain freshness regardless of detection. Keywords: Milk Spoilage; Detection; pH; pH Detection; Methylene Blue Reduction; Amperometric Sensor; Magnetoelastic; Gas Sensor Array; Infrared Spectroscopy; Lipid/Fat Count 1. Introduction Consumers currently determine milk spoilage by check- ing the “sell by” and “best if used by” dates on milk car- tons provided by suppliers. These dates are simple esti- mates of milk shelf life and are often inaccurate due to the variable processing, shipping, and storage conditions of the milk [1]. Retailers and consumers discard billions of pounds of unspoiled milk each year while relying on inaccurate printed expiration dates. Conversely, milk may spoil before the printed expiration, and spoiled milk can lead to food poisoning if consumed [2]. Another is- sue demonstrating the urgency of developing more accu- rate milk packaging is that unless there are local restric- tions for dairy products, the manufacturer determines the date; if an established regulation does not exist, manu- facturers can legally sell the expired product past the posted date. The cities or processors that do have regula- tions have different sets of rules. For example, until 2010, milk could only be legally sold in New York City up to 96 hours after 6:00 AM on the day after pasteurization [3] [4]. Dairylea Cooperative, Inc., the biggest processor in the region, allows milk to be sold 10 to 12 days after pasteurization [5]. Researchers have recently begun investigating appli- cations of current technologies for the detection of milk spoilage. While the meat, fish, and fruit industries have continually advanced new methods of packaging, pack- aging innovation in the milk packaging industry has re- mained stagnant [6]. Although a handful of packaging companies have proposed ideas for updated milk pack- aging designs, none of the proposed alternatives have succeeded in the market. Food industries and consumers have shown a trend of increasing interest in environmen- tally friendly, health-conscious intelligent packaging, and these market trends indicate the need to invest heavily in these novel developments [7]. Innovative milk packaging will further revolutionize the packaging industry and transform the way consumers think about packaging. The aims of this article are to review the current state of the intelligent food packaging industry and present an *Corresponding author. Copyright © 2013 SciRes. FNS  Milk Spoilage: Methods and Practices of Detecting Milk Quality 114 update on the considerations that intelligent food pack- aging developers may contemplate for further advance- ment in this field. 2. Current Methods of Milk Spoilage Detection 2.1. Utilizing pH Indicators as a Measure of Spoilage Bacteria growth varies from one species of bacteria to another. While one bacteria species may prosper under certain conditions, another species may weaken. These conditions are interdependent and include nutrient avail- ability, moisture, oxygen levels and the level of other gases, the presence of inhibitors, temperature, and pH [8]. The pH of unspoiled milk is approximately 6.7, a level at which many forms of bacteria thrive [9]. At lower pH levels of 4.0 - 5.0, lactic acid bacteria can grow and pro- duce lactic acid. While these organisms inhibit the growth of many pathogenic bacteria and are also inten- tionally employed to ferment milk to make other dairy products such as yogurt and cheese, they can also induce undesirable spoilage in certain products. Coliforms, a common form of bacteria, have been an indicator of the presence of pathogens in assessing the contamination of water as well as dairy products [10]. Coliforms can cause rapid spoilage in milk because they ferment lactose with the production of acid and gas, and they can also degrade milk proteins. Escherichia coli is a well-known example of a coliform [11]. Studies have shown that other properties of milk also promote bacteria growth, such as the high availability of moisture and dissolved oxygen which supports both aerobic and facul- tative anaerobic microorganisms [12]. Temperature is frequently controlled to limit bacteria growth. Extreme heat is lethal to many organisms, such as coliforms, which explains the process of milk pasteurization (63˚C for 30 minutes). Two types of bacteria exist in pasteur- ized milk: thermoduric bacteria, which are capable of surviving the extreme heat during pasteurization, and bacteria that originate from unsanitary conditions post- pasteurization [13]. Psychrotrophs comprise the largest percentage of bacteria in milk and cause spoilage in re- frigerator temperatures at or below 7˚C [14]. Acidity increases as milk spoils; thus, acidity can be quantified to measure milk quality. Acidity in dairy prod- ucts can be expressed in two ways: 1) titratable acidity, which shows total acidity but not acid strength; and 2) hydrogen ion concentration or pH, which indicates acid strength. The natural acidity of milk is 0.16% - 0.18%, and samples with higher figures indicate developed acid- ity [15]. At normal levels of pH, the main protein in milk, casein, remains evenly dispersed. At lower levels of pH below 4.6, the protein can no longer remain in solution, so it coagulates due to acid generated from fermentation. Two studies confirm the link between pH change in milk and spoilage: Fromm and Boor (2004) researched the attributes of pasteurized fluid milk (2% High Tem- perature/Short Time, HTST milk) during its shelf life. Milk samples were randomly collected from three fluid milk processing plants in the state of New York. A group of 13 panelists evaluated 2% HTST processed fluid milk products based on a quantitative descriptive analysis. They tasted and scored the perceived intensity of the aroma, taste, and aftertaste of milk samples varying in degree of freshness using a numeric scale ranging from 0 to 15 and the descriptive terms listed in Table 1. The free fatty acid (FFA) content of the samples sig- nificantly increased throughout shelf life. Though not significantly different between day one and day seven, the FFA content drastically increased between days four- teen to seventeen due to milkfat lipolysis. The higher the FFA, the more likely sensory panelists were able to de- tect lipolyzed or rancid off-flavors in 2% fat milk [16]. Casein levels in all milk samples also decreased ap- proximately 2% at a relatively rapid rate following sev- Table 1. Descriptors of attributes of pasteurized fluid milk by Fromm and Boor (2004). Descriptors CategoryAttribute Reference for intensity of attribute Cheese Colby cheese Cooked Freshly pasteurized milk (79˚C/18s) Cream Heavy cream Hay/grain Hay Sulfur Boiled egg Sour/fermented Sauerkraut Aroma Putrid Limburger cheese Baby formulaBaby formula Butter Butter Cooked Freshly pasteurized milk (79˚C/18s) Flat 2% fat milk with 3% added water Nutty Peanuts Rancid Strong provolone cheese Taste Sweet 1:1 100% lactose free Lactaid and 2% fat milk Cardboard Cardboard box Sweet 1:1 100% lactose free Lactaid and 2% fat milk Sour Cultured buttermilk Metallic FeSO4 (0.445 g/L) Drying Unsweetened tea Aftertaste Lingering - Copyright © 2013 SciRes. FNS  Milk Spoilage: Methods and Practices of Detecting Milk Quality Copyright © 2013 SciRes. FNS 115 enteen days of refrigeration. This is associated with off- flavors in fluid milk, particularly bitterness. This study concludes that each processing plant has different microflora species and needs to have plant- specific strategies to identify and reduce sources of con- tamination. However, these species, while different, all cause milk to decrease in pH. Increases in FFA and drops in casein levels correlate with a decrease in pH. This suggests that pH can serve as a measurement not only of milk spoilage but also of milk edibility, since panelists determined FFA and casein levels affect rancidity and off flavors in fluid milk [17]. This specific study, however, does not establish a lactic acid level and corresponding pH at which milk remains drinkable. Though pH meters are available, modern versions are inconvenient and cum- bersome for individual consumers. Ostlie, Helland, and Narvhus (2003) conducted a study to analyze the amount of metabolic products produced by five specific probiotic strains in ultra-high temperature (UHT) treated milk [18]. The study used a pH meter with a combined glass electrode and temperature probe to measure pH during fermentation. Volatile compounds were analyzed with headspace gas chromatography and organic acids were analyzed with high pressure liquid chromatography. Quantitative analysis of carbon dioxide production was determined with an infrared CO2 gas analyzer. Below, Table 2 shows the results of survival and storage stability: Preliminary studies showed that the growth varied considerably with the concentration of the added sup- plements. After 6 - 16 hours of incubation, all strains at- tained viable cell numbers above 8.7 - 9.18 log CFU/mL. Depending on the probiotic strain used, the pH of the ultra-high temperature milk decreased from 6.7 initially to 3.9 - 4.4 after 24 hours of incubation. A disadvantage of the study was that in fortified milk, the various probiotic strains possessed different meta- bolic profiles, which affected the sensory quality of products containing these different organisms. The in- crease in strain growth (cell numbers), led to an increase in the amount of lactic acid produced. This increase in lactic acid in turn led to a drop in pH. Whereas the earlier methodology correlated levels of pH with amounts of protein, this study correlated pH directly with the number of bacteria cells. These studies conclude pH is quantifiable and can measure spoilage in milk. However, there must be further research to address the shift in metabolism of probiotic bacteria in response to environmental changes, as well as the effect of different milk treatment regimes on the me- tabolism of probiotic bacteria in milk. In addition, the pH range where milk meets the definition of “spoiled” does not coincide with the colloquial definition of spoilage. As in the earlier study, most consumers consider milk to be inedible at those pH levels. For the future development of pH as an indicator of milk quality, a more accurate pH range must be established to define the point at which milk is no longer drinkable. This goal can be accom- plished by combining Fromm and Boor’s methodology involving a group of panelists to determine the level of consumable spoilage with Ostlie, Helland, and Narvhus’ study of pH values and acidic byproducts. There are currently a few devices that can determine the acidity levels of milk. These are typically used as a means of quality control by manufacturers, rather than by end consumers. Many pH electrodes/meters and titra- tors/meters quickly and accurately measure pH of dairy products. A prototype, the Milkmaid smart jug, is a new product that detects when milk starts to spoil with a pH sensor in the base. The jug informs users of spoilage via a change in the color of the jug’s light-emitting diode lights. This product is not yet sold and the price has not yet been determined. A disadvantage of this design is that consumers must pour milk into a separate container, because the pH sensor is not incorporated into the plastic container milk is sold in. Thus, while the Milkmaid jug shows that detecting spoilage with pH is applicable to commercial products, it remains to be seen if this par- ticular design becomes commercially successful. Table 2. Viable pH counts in UHT milk (log·cfu·ml−1)2. Time of freezing 0 hour 1 day 1 month 6 months Sucrose (%) Strain 0 0 5 10 0 5 10 0 5 10 Lb. acidophilus La5 8.78 8.63 8.70 8.76 8.79 8.84 8.81 8.70 8.79 8.80 Lb. acidophilus 1748 10.11 - - - 10.18 - - - - - Lb. rhamnosus GG 9.08 9.04 9.06 9.09 9.15 9.05 9.08 9.17 9.16 9.25 Lb. reuteri SD 2112 9.17 9.05 9.08 9.02 9.15 9.05 9.08 9.17 9.16 9.25 B. animalis BB12 8.86 8.84 8.83 8.80 8.93 8.93 8.87 8.75 8.71 8.76  Milk Spoilage: Methods and Practices of Detecting Milk Quality 116 2.2. Electrical Methods for the Detection of Bacteria Some traditional methods of detection involve bacterial enumeration, in which spoilage is detected when in- creased metabolism caused by multiplying bacteria ren- ders a colored solution colorless. The methylene blue reduction test is such an example; however, known flaws of this test include time-consuming and redundant pro- cedures, as well as an inability to discriminate between bacterial types [19]. Lee et al. (2009) sought to improve upon the methylene blue reduction method while main- taining its advantages by supplementing it with an am- perometric sensor. An amperometric sensor, composed of a circuit with a potentiostat and a pair of electrodes, measures current change [20]. Amperometric sensors are small and inexpensive and have been tested in a variety of media to detect changes in bacteria such as E. coli. Lee et al. inoculated with milk E. coli and Ent. aero- genes, two types of coliforms that indicate the sanitary condition. A third sample contained milk and methylene blue. Methylene blue is blue until the metabolic activity of bacteria causes it to lose color. Consequently, the bac- terial metabolism of the E. coli caused the reduction of methylene blue in the three samples and also resulted in a current change. Any current change of more than 0.05 μA was detected with the amperometric sensor and re- corded. The study tracked detection time and provided an estimate of the approximate number of microorganisms initially in the sample. Results had R2 of 0.9192, cor- roborating high accuracy in an inverse linear relationship between the log of the bacterial concentration against the detection time. The increase of microbial organisms ex- ponentially related to the time from inoculation to the initial small change in current. Results were favorable. Advantages to this method in- clude a detection time 0.5 - 2 hours shorter than that ob- tained with the methylene blue reduction method and a very broad detection range of 102 - 104 CFU/mL. Fur- thermore, whereas the methylene blue reduction method required constant supervision and sampling at a 30-min- ute interval, the amperometric sensor could independ- ently record the data. The latter procedure was relatively simple and inexpensive; accuracy was also a non-issue. However, this method cannot discriminate between viable and non-viable cells. Furthermore, type of bacteria detection was lacking. The amperometric sensor could only detect E. coli and Ent. aerogenes coliforms; when other bacteria such as B. subtilis, Lactobacillus sp., Sac- charomyces sp., and Staph. aureus were tested upon, they produced a negligible current change. 2.3. Wireless Detection and Monitoring of Milk Spoilage Application of remote-query technology to detect milk spoilage is an emerging field of experimentation. The remote-query magnetoelastic sensor platform is a free standing, ribbon-like magnetoelastic thick-film coupled with a chemical or biochemical sensing layer such as an enzyme that vibrates at a characteristic resonance fre- quency. A pickup coil is then used to remotely detect the magnetic field generated by the mechanical oscillations. Magnetoelastic sensors have already been developed and tried in a number of different types of analyses; past re- search has used it for the analysis of glucose concentra- tion, blood clotting, and detection of Escherichia coli as well as Salmonella typhimurium [21-24]. However, it has not directly been applied to the detection of milk spoil- age. Huang et al. (2008) tested a remote-query magnetoe- lastic sensing platform to quantify the bacterial count of Staphylococcus aureus ssp. anaerobius (S. aureus) in milk. S. aureus is a bacterium that resides in milk and multiplies as milk spoils; infection with S. aureus can result in such human diseases as toxic shock syndrome, endocarditis, and septicemia [25]. Culture media of S. aureus were prepared, and resonance characteristics were measured with a magnetoelastic sensor fabricated from Metglas alloy ribbon. Because the sensor responds to mass loading due to bacterial adhesion and changes in solution viscosity, Huang et al. increased the viscosity of one of the culture media—one a nutrient broth and one a tryptic soy broth—through different trials; ultimately, the sensor showed a higher sensitivity in the milk than in the culture medium because of the higher viscosity of milk. Results concluded that the sensor platform is feasible for use in the remote detection of spoiled milk samples. Remote-query detection is, overall, an effective me- thod. Typically, material costs are low; disposable mag- netoelastic sensors, for example, can be fabricated from strips costing $300 per kilometer, while the combination of an amperometric sensor with methylene blue also in- volves low costs. However, deficiencies in this method continue to surface. As bacteria detection becomes com- plex, as with the ATP (adenosine triphosphate) biolumi- nescence method and the PCR (polymerase chain reac- tion) method, speed becomes an issue [26,27]. The sim- ple methylene blue reduction method was ponderous as bacteria detection requires constant supervision. The two methods presented attempts to improve upon these inefficiencies. Not only does Lee et al.’s experi- mentation with the amperometric sensor provide a broad detection range between 102 - 104 CFU/mL, electro- chemical techniques are easier to apply and have lower costs. Lee’s method solved the problem of speed and, more importantly, provided a user-friendly procedure. 2.4. Gas-Sensor Arrays Haugen, Knut, Langsrud, and Bredholt (2006) attempted Copyright © 2013 SciRes. FNS  Milk Spoilage: Methods and Practices of Detecting Milk Quality 117 to predict the shelf-life of milk with gas-sensor arrays. In their experiment, a commercial solid-state gas-sensor array system monitored the growth of disinfectant-resis- tant bacteria in milk known to cause spoilage, namely Serratia marcescens, Serratia proteamacufans, and Pseu- domonas putida. The Haugen study identified the quality and amount of major volatile microbial metabolites using gas chroma- tography and mass spectroscopy, and also analyzed and correlated microbiological data through statistical tests. Haugen et al. patterned and fingerprinted complicated odors with gas sensor arrays in order to determine the correlation between secondary volatile metabolites from the milk and the microorganisms that produced these compounds. This method allows the determination of organisms responsible for spoilage, quality of the milk, and length of shelf life based on objective criteria [28]. Twenty-six Gram-negative bacteria were selected and identified based on cellular fatty acid analysis, and three spoilage-inducing isolates (Cedcea sp., Serratia sp., and Pseudomonas sp.) that proliferate in milk were chosen for experimentation. Aside from the CO2 signal, which stayed constant at baseline level, the sensor signals decreased during the first 6 - 7 hours because background volatile compounds from the medium were extracted dynamically from the cultures during each measurement. The production of volatile secondary bacterial metabolites started to exceed the background volatiles and increased significantly around 7 - 8 hours (excluding the pure Pseudomonas culture). This increase in signal coincided with the onset of the exponential growth phase. At 18 - 20 hours, a peak in CO2 production corresponded to a plateau in S. mar- cescens N9, S. proteamaculans O6A and the mixed cul- tures. The sensor signals from the pure cultures showed significant correlation with the cell counts. This gas-sensor array system successfully detected major volatile metabolites produced by bacteria during growth. A significant majority of the contributions to the sensor response signals were ascribed to the major vola- tile compounds except for acetate. Haugen et al. investi- gated the possibility of developing a system that detects and monitors growth of undesirable bacteria. The high correlation between the sensor readings and the cell counts of the pure cultures suggests that gas-sensor mea- surements can predict bacterial cell numbers in pure cul- tures. Therefore, a design of specific sensors can be adapted to follow the development of spoilage organisms in specific food products. Secondary compounds identified by gas chromatogra- phy and mass spectroscopy comprised of fermentation products produced by Serratia, Enterobacter, and Er- winia. Both Enterobacteriaceae and Ps. putida produced spoilage off-odors in pasteurized milk, but the Ps. pu tida culture contributed a far lower production of volatiles and CO2 than the Serratia strains at 25˚C. At less than 10˚C, Ps. putida would have been the major spoilage organism in milk [29]. Therefore, sensors must be se- lected and developed to provide indicators of typical tar- get organisms in different food products under specified temperature, pH, and water activity conditions. However, there are constraints to detecting bacterial strains in complex cultures based on temporal gas sensor response patterns from single strains. In particular, Ps. Putida produced secondary volatile metabolites and only contributed to less than 0.1% of the temporal response pattern, even though the Ps. putida reached a significant concentration in the mixed culture. Therefore, for the applied experimental conditions, the gas sensors were not sufficiently sensitive to detect Ps. putida in the mixed culture, because the vapor phase was masked by the volatile metabolites generated by S. marcescens N9. The sensors also have a certain extent of cross-sensitivity, so it is important to select sensors with high sensitivity for detection of strain specific metabolites, especially when the spoilage bacteria constitute a lesser percentage of the total flora. Gas sensors can be designed to detect the characteris- tic metabolites of specific bacteria in specific food prod- ucts and can offer rapid, accurate determinations of shelf life. To detect correctly target strains of bacteria, it is ne- cessary for sufficient strain specific volatile compounds to be present. Thus, a drawback of gas sensor technology is its great potential for strains where the strain specific metabolites represent the major volatile compounds in the vapor phase. When bacteria do not produce many volatile compounds, more sensitive sensors are needed to detect their characteristic metabolites. 2.5. Infrared Spectroscopy as Spoilage Indicator Spectroscopy is a nondestructive technique, where spec- tral features provide biochemical information regarding the molecular interactions between, and the composition and structure of, different cells and tissues. This method was first widely applied in the food industry to detect spoilage in beef, rainbow trout fillets, and other meat products [30,31]. However, this method had not been experimented on milk until Al-Qadiri, M. Lin, Al-Holy et al. in 2008. To do so, they evaluated visible and short wavelength near-infrared diffuse reflectance spectros- copy (SW-NIR) as a technique to detect milk spoilage in pasteurized skim milk. They wanted to see the feasibility of applying visible and SW-NIR spectroscopy to monitor spoilage of pasteurized skim milk in industrial settings. In doing so, Al-Qadiri et al. first took the total aerobic plate count and pH measurements. They then examined the milk samples at 22˚C to correct for spectral changes that could result from temperature differences during Copyright © 2013 SciRes. FNS  Milk Spoilage: Methods and Practices of Detecting Milk Quality 118 spectral collection. The mean pH measurement for con- trol milk samples was 6.66, and they found no obvious pH decrease for milk samples stored at 6˚C after 30 hours of storage. In experimental samples, the visible and SW-NIR diffuse spectroscopy detected the formation of metabolic byproducts from proteolysis and lipolysis caused by bacterial cell growth, which led to a reduction in pH [32]. This method was effective, but costly. Fur- ther work will be needed to identify which biochemical changes in spoilage microorganismss correlate with spe- cific SW-NIR spectral features. Nicolaou et al. (2012) attempted to take infrared spec- troscopy further with matrix-assisted laser desorption/ ionization time-of-flight mass spectrometry (MALDI- TOF-MS). MALDI-TOF-MS has already been used in protein and peptide identification and quantification; however, Nicolaou wanted to see if it was useful for mi- crobial spoilage assessment because techniques for iden- tifying and quantifying spoilage bacteria in pasteurized milk are time-consuming. Their methodology included incubating milk samples and raw pork meat samples at 15˚C and at room temperature, and then analyzing them with MALDI-TOF-MS at a rate of 4-minute intervals. MALDI-TOF-MS has many advantages, particularly in terms of sensitivity, accuracy, and speed. Spectrum can be generated within minutes following sample prepa- ration. Its most comparable technology is fourier trans- form infrared (FT-IR) spectroscopy; however, MS allows more equivocal identification of important proteins while FT-IR spectroscopy does not, or does so at best only em- pirically through peak assignments [33]. Furthermore, MALDI-TOF-MS has minimal sample preparation, which contributes to the rapid speed of data collection. Typical sample speed is 4 minutes per sample, which is consid- erably faster than classical microbiological plating ap- proaches that can take up to 2 days. Drawbacks, how- ever, include the limited use of infrared spectroscopy in the field. The technology is perceived as a tool for as- sessing protein qualitatively rather than for measuring microbial bacterial count quantitatively. Familiarization of MALDI-TOF-MS can help change perceptions and lead to use of this technology in the dairy industry. However, the technical difficulty of this method renders it unsuitable for consumer use. 2.6. Protein or Fat Count Detection Several studies correlate bacteria that are known to be involved in the spoilage of pasteurized milk with varia- tions in the levels of lipids and proteins that are present in milk. Yagoub, Bellow, and El Zubeir (2008) con- cluded that the lowest percentages of lipid and protein in milk occur when Pseudomonas levels are at their highest. High Pseudomonas levels cause high levels of proteolytic activity in all food systems. Lipases and proteases break down lipids and proteins, which lowers lipid and protein levels. The by-products of these hydrolysis reactions in- crease milk acidity and directly correlate to milk spoilage. Additionally, the bacteria Pseudomonas aeruginosa chan- ge the constituents of milk, thereby spoiling it [34]. There are many common industry practices that in- corporate this method into testing milk properties. Pro- tein levels are typically determined by the standard Kjeldahl method or the more favorable Dumas method [35]. The Kjeldahl method measures nitrogen levels by using a fitting titration technique. There are three steps involved: digestion, neutralization, and titration. The pro- tein content is calculated from the nitrogen concentration in the milk. This standard method does not directly meas- ure protein content and thus needs a conversion factor (which varies among different proteins) to convert meas- ured nitrogen concentration to a protein concentration. This conversion can lead to inaccuracies. Another disad- vantage is the amount of time (1 - 2 hours) required to perform this test. The Dumas method, a similar but enhanced version of Kjeldahl method, is an automated instrumental technique that combusts in the presence of oxygen a sample of known mass in a high temperature chamber. By-products CO2 and H2O are filtered out, leaving only N2 or nitrogen content to be read by a thermal conductivity detector. This test is can be done in fewer than 4 minutes. Like the Kjeldahl method, the Dumas method also needs to con- vert nitrogen content to protein content, as it does not truly measure the protein. The method also carries high initial costs and can make it difficult to obtain a repre- sentative sample. Alternate methods of protein counts are time consuming and require extensive sample prepara- tion before analysis. Lipid or fat content is primarily determined by Gerber method in Europe, or the very similar Babcock method in the United States. The Gerber method requires adding dairy product into a butyrometer and adding concentrated sulfuric acid and amyl alcohol to dissolve the non-fat milk solids [36]. The mixture is centrifuged for a set time at 1100 rpm and placed in a water bath to standardize the samples before reading the fat content off the calibrated scale of the butyrometer. The method is fast, low cost, and suitable for high volumes of sample. However, dis- advantages include not being able to automatically de- termine levels and the risk of handling highly concen- trated sulfuric acid. In addition, reading the butyrometer takes acquired skill, so the method cannot be used by average consumers. Sorhaug and Stepaniak (1998) showed that psychotro- pic Bacillus spp. are resistant to heat treatment and se- cretes extracellular proteinases, lipases, and phosopli- pases. Other bacteria that survive the pasteurization proc- ess also produce these proteins. Additionally, the quality of dairy products can decrease due to heat-resistant en- Copyright © 2013 SciRes. FNS  Milk Spoilage: Methods and Practices of Detecting Milk Quality 119 zymes that are secreted by psychrotrophs in raw milk before heat treatment, or produced by psychrotrophs grow- ing during the cold refrigeration of dairy products [37]. Prior studies also show that up to 20% of all psychrotro- phic bacteria isolated from raw milk possess proteolytic and lipolytic enzymatic activities [38]. Sorhaug and Ste- paniak determined the average psychrotroph count for different dairy types at the time of spoilage for Pasteur- ized milk to be 6 - 7.5 CFU/mL, but they did not record the protein level. For this method to be used as a spoilage detector, more testing is needed to determine the equiva- lent protein level at the psychrotroph count of 6 - 7.5 CFU/mL and the precise correlation between protein count and spoilage. Average consumers cannot perform a protein or fat count due to the method’s required know-how, needed time, and financial costs. Thus, it is impractical to incor- porate this method into commercially sold products for consumers, even in light of the fact that levels of post- pasteurization contamination correlate extremely well with shelf life, and protein and fat count is arguably the most accurate indicator of expected shelf life of pasteur- ized milks for milk processors. Yagoub, Bellow, and El Zubeir (2008) also determined that the byproducts of lipid and protein breakdown induce increased acidity. 3. Comparison of Milk Spoilage Detection Methods Accuracy, range, usability, speed, and cost are of par- ticular importance when choosing a milk spoilage detec- tion method because these factors impact the feasibility and marketability of packaging products. Table 3 com- pares available milk spoilage detection methods in terms of those five characteristics: 4. Current Real-World Applications of Milk Spoilage Prevention While the milk packaging industry has lagged woefully behind in milk spoilage detection, there has been a recent push towards innovation in regards to spoilage preven- tion. These efforts do not eliminate the need for future research into milk spoilage detection methods, but could serve as substitute solutions to the problems previously discussed in this paper. Detailed below are some exam- ples of these recent innovations. 4.1. Tetra Pak USA Tetra Pak is a leading food processing and packaging solutions company in the world that emphasizes innova- tion and environmental friendliness in their products. In the general food industry, they have introduced the Tetra Recart, which is the first retortable carton package de- signed for shelf-stable products traditionally filled in cans, glass jars, or pouches. The Tetra Recart guarantees freshness for up to 24 months. This product is currently available for use only with shelf-stable products, but the company has announced further plans to begin develop- ment on a similar type of carton for milk which would guarantee freshness for up to 6 months [39]. 4.2. Evergreen Packaging, Inc. Evergreen Packaging, Inc. specializes in dairy, juice, and liquid packaging and caters to customers specific needs. Evergreen Packaging focused their milk carton design on preventing light and temperature changes since dairy products are sensitive to these changes and milk reacts negatively to increases in temperature and light exposure. Evergreen Packaging claims their fiber-based packaging keeps light and oxygen out while retaining vitamins and taste, which helps lock in freshness. Specifically, they have patented their superior oxygen and moisture-barrier technology [40]. 4.3. TempTime Corporation The TempTime Corporation is an international manufac- turer specializing in time-temperature sensitive indicators for food products. Their product, Fresh-Check, is at- tached to the outside packaging of temperature-sensitive food products and pharmaceuticals. The World Health Organization was one of the first users of time tempera- ture indicators when they applied this technology to en- sure the effectiveness of their vaccines in Africa. Since then, this technology has transformed the administration of vaccines and has been recently applied to the food industry by the TempTime Corporation [41]. Approxi- mately the size of a quarter, the Fresh-Check changes color when the food product on which it is attached is exposed to unfavorable temperature and is no longer fit for consumption. A study conducted by the National Veterinary and Food Research Institute in Finland deter- mined that a correlation exists between the color change of the indicator and the sensory and microbiological quality of the food product tested [42]. Typically priced between $0.025 and $0.035 per package, the Fresh- Check indicators are a more accurate representation of the quality of the food than the use-by-date, which can- not account for abuses that may have occurred during the cold chain process [43]. 5. Comparison of Intelligent Packaging Designs for Milk Intelligent packaging comes with advantages and disad- vantages. For milk packaging, issues of freshness and per-carton cost are of particular interest. Table 4 evalu- ates three intelligent milk packaging designs. Copyright © 2013 SciRes. FNS 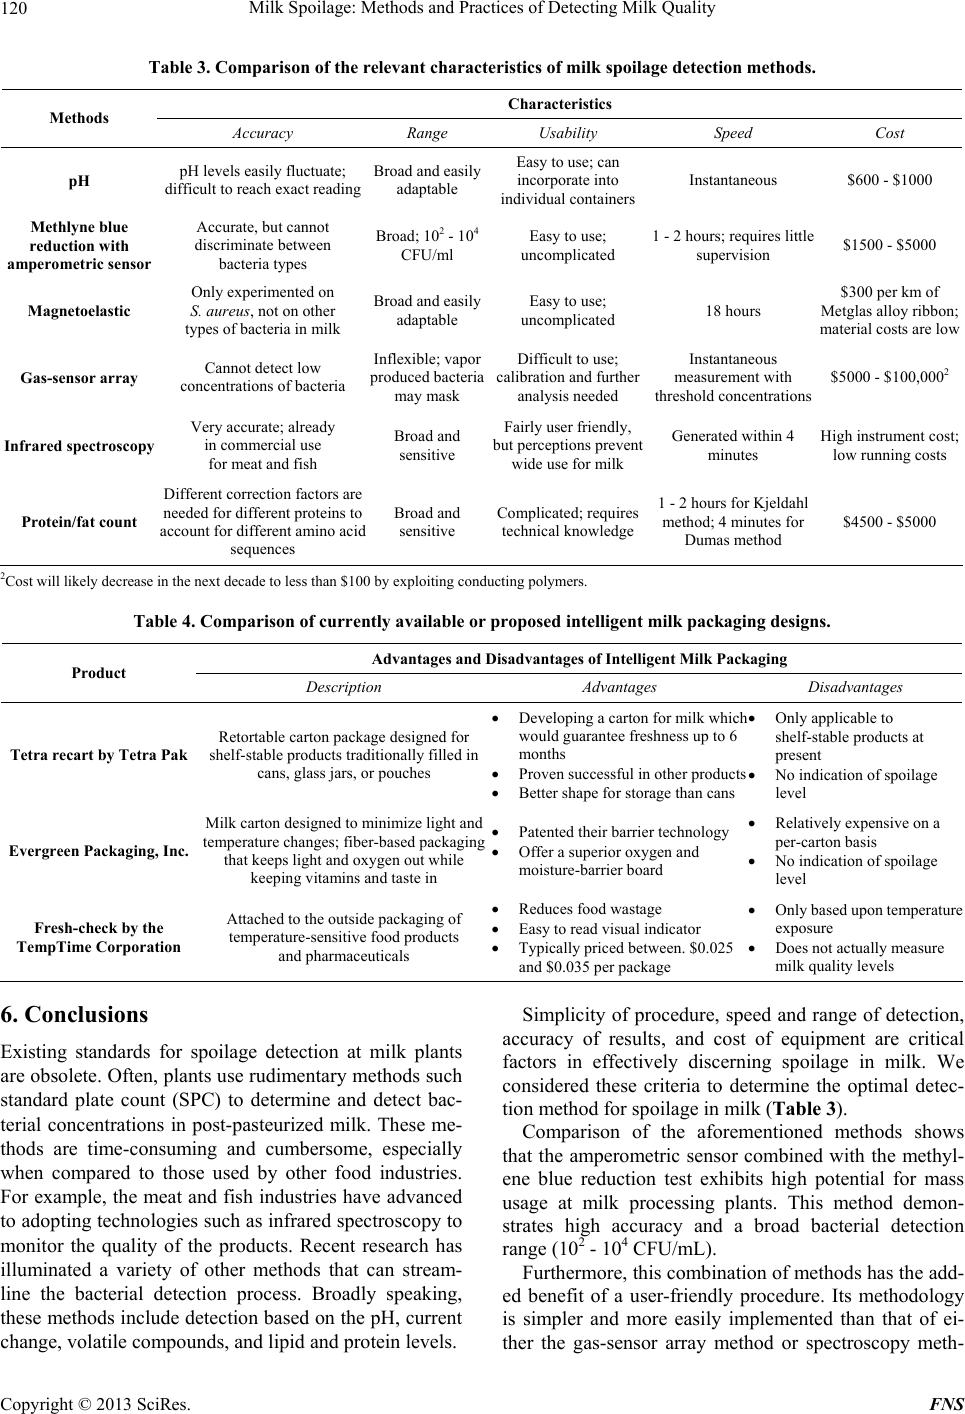 Milk Spoilage: Methods and Practices of Detecting Milk Quality Copyright © 2013 SciRes. FNS 120 Table 3. Comparison of the relevant characteristics of milk spoilage detection methods. Characteristics Methods Accuracy Range Usability Speed Cost pH pH levels easily fluctuate; difficult to reach exact reading Broad and easily adaptable Easy to use; can incorporate into individual containers Instantaneous $600 - $1000 Methlyne blue reduction with amperometric sensor Accurate, but cannot discriminate between bacteria types Broad; 102 - 104 CFU/ml Easy to use; uncomplicated 1 - 2 hours; requires little supervision $1500 - $5000 Magnetoelastic Only experimented on S. aureus, not on other types of bacteria in milk Broad and easily adaptable Easy to use; uncomplicated 18 hours $300 per km of Metglas alloy ribbon; material costs are low Gas-sensor array Cannot detect low concentrations of bacteria Inflexible; vapor produced bacteria may mask Difficult to use; calibration and further analysis needed Instantaneous measurement with threshold concentrations $5000 - $100,0002 Infrared spectroscopy Very accurate; already in commercial use for meat and fish Broad and sensitive Fairly user friendly, but perceptions prevent wide use for milk Generated within 4 minutes High instrument cost; low running costs Protein/fat count Different correction factors are needed for different proteins to account for different amino acid sequences Broad and sensitive Complicated; requires technical knowledge 1 - 2 hours for Kjeldahl method; 4 minutes for Dumas method $4500 - $5000 2Cost will likely decrease in the next decade to less than $100 by exploiting conducting polymers. Table 4. Comparison of currently available or proposed intelligent milk packaging designs. Advantages and Disadvantages of Intelligent Milk Packaging Product Description Advantages Disadvantages Tetra recart by Tetra Pak Retortable carton package designed for shelf-stable products traditionally filled in cans, glass jars, or pouches Developing a carton for milk which would guarantee freshness up to 6 months Proven successful in other products Better shape for storage than cans Only applicable to shelf-stable products at present No indication of spoilage level Evergreen Packaging, Inc. Milk carton designed to minimize light and temperature changes; fiber-based packaging that keeps light and oxygen out while keeping vitamins and taste in Patented their barrier technology Offer a superior oxygen and moisture-barrier board Relatively expensive on a per-carton basis No indication of spoilage level Fresh-check by the TempTime Corporation Attached to the outside packaging of temperature-sensitive food products and pharmaceuticals Reduces food wastage Easy to read visual indicator Typically priced between. $0.025 and $0.035 per package Only based upon temperature exposure Does not actually measure milk quality levels 6. Conclusions Existing standards for spoilage detection at milk plants are obsolete. Often, plants use rudimentary methods such standard plate count (SPC) to determine and detect bac- terial concentrations in post-pasteurized milk. These me- thods are time-consuming and cumbersome, especially when compared to those used by other food industries. For example, the meat and fish industries have advanced to adopting technologies such as infrared spectroscopy to monitor the quality of the products. Recent research has illuminated a variety of other methods that can stream- line the bacterial detection process. Broadly speaking, these methods include detection based on the pH, current change, volatile compounds, and lipid and protein levels. Simplicity of procedure, speed and range of detection, accuracy of results, and cost of equipment are critical factors in effectively discerning spoilage in milk. We considered these criteria to determine the optimal detec- tion method for spoilage in milk (Table 3). Comparison of the aforementioned methods shows that the amperometric sensor combined with the methyl- ene blue reduction test exhibits high potential for mass usage at milk processing plants. This method demon- strates high accuracy and a broad bacterial detection range (102 - 104 CFU/mL). Furthermore, this combination of methods has the add- ed benefit of a user-friendly procedure. Its methodology is simpler and more easily implemented than that of ei- ther the gas-sensor array method or spectroscopy meth-  Milk Spoilage: Methods and Practices of Detecting Milk Quality 121 ods. While theoretically the lipid and protein method is simplistic in nature, actual application generates com- plexities and safety hazards become a problem. pH is also a user-friendly method, but its shortcomings in accuracy would likely be a significant cause for con- cern among milk plants and manufacturers. Still, pH can and should be considered for commercial individual use of spoilage detection because of its low cost and ease-of- incorporation. Although pH tests have less than perfect accuracy, they are still reliable indicators of milk shelf- life. Theoretically, this method can replace expiration dates as measures of milk spoilage. At the reasonable price of approximately $3000, the amperometric sensor compares favorably to the gas-sen- sor array and the lipid and protein count apparatus. This price can be considered mid-range, and comprises a one- time, fixed cost investment for a milk plant. A major disadvantage of the amperometric sensor is that it cannot continuously monitor the bacteria growth of the same sample over time; rather, the sensor can de- tect only bacteria concentration of the initial sample. However, this is not a major factor from the perspective of milk processing plants, which only need to conduct quality control tests to meet industry standards and then quickly distribute their pasteurized milk to retailers. Overall, for simplicity, pH and amperometric sensors are the optimal methods of milk spoilage detection, but the success of each method depends on the user’s needs. For increased reliability, a combination of more than one method is advised for milk processors. At this moment, simple indicators continue to evade consumers. 7. Acknowledgements This study was financially supported by the Gemstone Program at the University of Maryland, Maryland Tech- nology Enterprise Institute, and Atlantic Coast Confer- ence Inter-institutional Academic Collaborative. Addi- tional thanks to Professor David Bigio of the Department of Mechanical Engineering. REFERENCES [1] J. Kim, D. Twede and J. Lichty, “Consumer Attitudes About Open Dating Techniques for Packaged Foods and Over-the-Counter Drugs,” Journal of Food Products Mar- keting, Vol. 4, No. 1, 1997, pp. 17-30. doi:10.1300/J038v04n01_03 [2] United States Food and Drug Administration, “Foodborne Illness-Causing Organisms in the U.S.—What You Need to Know,” 2008. http://www.fda.gov/downloads/food/resourcesforyou/con sumers/ucm187482.pdf [3] E. B. Hager, “Removing Mysterious Sell-By Date from Milk Cartons,” The New York Times, 15 June 2010. http://cityroom.blogs.nytimes.com/2010/06/15/removing- a-mysterious-sell-by-date-from-milk-cartons/ [4] T. Fleischer, “NYC May Expire Milk Date Rules,” ABC News, 14 June 2010. http://abclocal.go.com/wabc/story?section=news/consum er&id=7497226 [5] F. Fabricant, “Freshness of Milk Products,” The New York Times, 10 March 1982. http://www.nytimes.com/1982/03/10/garden/freshness-of- milk-products.html [6] I. N. A. Ashie, J. P. Smith, B. K. Simpson and N. F. Haard, “Spoilage and Shelf-Life Extension of Fresh Fish and Shellfish,” Critical Reviews in Food Science & Nu- trition, Vol. 36, No. 1-2, 1996, pp. 87-121. doi:10.1080/10408399609527720 [7] D. Restuccia, et al., “New EU Regulation Aspects and Global Market of Active and Intelligent Packaging for Food Industry Applications,” Food Control, Vol. 21, No. 11, 2010, pp. 1425-1435. doi:10.1016/j.foodcont.2010.04.028 [8] J. D. Eifert, C. Gennings, W. H. Carter, S. E. Duncan and C. R. Hackney, “Predictive Model with Improved Statis- tical Analysis of Interactive Factors Affecting the Growth of Staphylococcus aureus,” Journal of Food Protection, Vol. 59, No. 6, 1996, pp. 608-614. [9] T. R. Klaenhammer, “Bacteriocins of Lactic Acid Bacte- ria,” Biochimie, Vol. 70, No. 3, 1988, pp. 337-349. doi:10.1016/0300-9084(88)90206-4 [10] J. L. Kornacki and J. L. Johnson, “Enterobacteriaceae, Coliforms, and Escherichia coli as Quality and Safety In- dicators,” Compendium of Methods for the Microbiologi- cal Examination of Foods, Vol. 4, 2001, pp. 69-82. [11] United States Department of Agriculture Agricultural Marketing Service, “Commodity Areas,” 2013. http://www.ams.usda.gov/AMSv1.0/dairy [12] R. P. Singh and B. A. Anderson, “The Major Types of Food Spoilage: An Overview,” In: R. Steele, Ed., Under- standing and Measuring the Shelf-Life of Food, CRC Press, Boca Raton, 2004, pp. 3-23. doi:10.1533/9781855739024.1.3 [13] D. R. Sepulveda, M. M. Góngora-Nieto, J. A. Guerrero and G. V. Barbosa-Cánovas, “Production of Extended- Shelf Life Milk by Processing Pasteurized Milk with Pulsed Electric Fields,” Journal of Food Engineering, Vol. 67, No. 1, 2005, pp. 81-86. doi:10.1016/j.jfoodeng.2004.05.056 [14] E. Lopez and R. Lopez, “Demand for Differentiated Milk Products: Implications for Price Competition,” Agribusi- ness, Vol. 25, No. 4, 2009, pp. 453-465. doi:10.1002/agr.20219 [15] Ministry of Agriculture, “Training Programme for Small Scale Dairy Sector and Dairy Training Institute,” In: Milk Processing Guide Series 2: Milk Testing and Quality Control, FAO/TCP/KEN/6611 Project, Naivasha, 2013. http://www.fao.org/ag/againfo/resources/documents/MPG uide/mpguide2.htm [16] H. I. Fromm and K. J. Boor, “Characterization of Pas- teurized Fluid Milk Shelf-Life Attributes,” Journal of Food Science, Vol. 69, No. 8, 2013, pp. 207-214. Copyright © 2013 SciRes. FNS  Milk Spoilage: Methods and Practices of Detecting Milk Quality 122 doi:10.1111/j.1365-2621.2004.tb09889.x [17] M. V. Santos, Y. Ma, Z. Caplan and D. M. Barbano, “Sensory Threshold of Off-Flavors Caused by Proteolysis and Lipolysis in Milk,” Journal of Dairy Science, Vol. 86, No. 5, 2003, pp. 1601-1607. doi:10.3168/jds.S0022-0302(03)73745-X [18] H. M. Ostlie, M. H. Helland, M. H. and J. A. Narvhus, “Growth and Metabolism of Selected Strains of Probiotic Bacteria in Milk,” International Journal of Food Micro- biology, Vol. 87, No. 1-2, 2003, pp. 17-27. doi:10.1016/S0168-1605(03)00044-8 [19] H. V. Atherton and J. A. Newlander, “Chemistry and Testing of Dairy Products,” 4th Edition, AVI Publishing Co. Inc., Madison, 1977. [20] Y. G. Lee, H. Y. Wu, C. L. Hsu, C. J. Liang, H. D. Yuan. “A Rapid and Selective Method for Monitoring the Growth of Coliforms in Milk Using the Combination of Amperometric Sensor and Reducing of Methylene Blue,” Sensors and Actuators B: Chemical, Vol. 141, No. 2, 2009, pp. 575-580. doi:10.1016/j.snb.2009.06.028 [21] Q. Cai, K. Zeng, C. Ruan, T. A. Desai and C. A. Grimes, “A Wireless, Remote Query Glucose Biosensor Based on a pH-Sensitive Polymer,” Analytical Chemistry, Vol. 76, No. 14, 2004, pp. 4038-4043. doi:10.1021/ac0498516 [22] L. G. Puckett, G. Barrett, D. Kouzoudis, C. A. Grimes and L. G. Bachas, “Monitoring Blood Coagulation with Magnetoelastic Sensors,” Biosensors and Bioelectronics, Vol. 18, No. 5-6, 2003, pp. 675-681. doi:10.1016/S0956-5663(03)00033-2 [23] C. Ruan, K. Zeng, O. K. Varghese and C. A. Grimes, “Magnetoelastic Immunosensors: Amplified Mass Immu- nosorbent Assay for Detection of Escherichia coli O157: H7,” Analytical Chemistry, Vol. 75, No. 23, 2003, pp. 6494-6498. doi:10.1021/ac034562n [24] R. Guntupalli, R.S. Lakshmanan, J. Hu, T. S. Huang, J. M. Barbaree, V. Vodyanoy and B. A. Chin, “Rapid and Sen- sitive Magnetoelastic Biosensors for the Detection of Salmonella typhimurium in a Mixed Microbial Popula- tion,” Journal of Microbiological Methods, Vol. 70, No. 1, 2007, pp. 112-118. doi:10.1016/j.mimet.2007.04.001 [25] S. Huang, S. Ge, L. He, Q. Cai and C. A. Grimes, “A Remote-Query Sensor for Predictive Indication of Milk Spoilage,” Biosensors and Bioelectronics, Vol. 23, No. 11, 2008, pp. 1745-1748. doi:10.1016/j.bios.2008.01.036 [26] P. D. Costa, N. J. De Andrade, F. J. V. Passos, S. C. C. Brandão and C. G. F. Rodrigues, “ATP-Bioluminescence as a Technique to Evaluate the Microbiological Quality of Water in Food Industry,” Brazilian Archives of Biology and Technology, Vol. 47, No. 3, 2004, pp. 399-405. doi:10.1590/S1516-89132004000300010 [27] N. Ahmed, A. K. Mohanty, U. Mukhopadhyay, V. K. Batish and S. Grover, “PCR-based Rapid Detection of Mycobacterium Tuberculosis in Blood from Immuno- competent Patients with Pulmonary Tuberculosis,” Jour- nal of Clinical Microbiology, Vol. 36, No. 10, 1998, pp. 3094-3096. [28] J. Haugen, R. Knut, S. Langsrud and S. Bredholt, “Ap- plication of Gas-Sensor Array Technology for Detection and Monitoring of Growth of Spoilage Bacteria in Milk: A Model Study,” Analytica Chimica Acta, Vol. 565, No. 1, 2006, pp. 10-16. doi:10.1016/j.aca.2006.02.016 [29] M. Hébraud and P. Potier, “Cold Shock Response and Low Temperature Adaptation in Psychrotrophic Bacte- ria,” Journal of Molecular Microbiology and Biotech- nology, Vol. 1, No. 2, 1999, pp. 211-219. [30] Y. Liu, et al., “Prediction of Color, Texture, and Sensory Characteristics of Beef Steaks by Visible and Near Infra- red Reflectance Spectroscopy. A Feasibility Study,” Meat Science, Vol. 65, No. 3, 2003, pp. 1107-1115. doi:10.1016/S0309-1740(02)00328-5 [31] M. Lin, M. Mousavi, M. Al-Holy, A. G. Cavinato and B. A. Rasco, “Rapid Near Infrared Spectroscopic Method for the Detection of Spoilage in Rainbow Trout (Oncorhyn- chus mykiss) Fillet,” Journal of Food Science, Vol. 71, No. 1, 2006, pp. S18-S23. doi:10.1111/j.1365-2621.2006.tb12400.x [32] H. M. Al-Qadiri, M. Lin, M. A. Al-Holy, A. G. Cavinato and B. A. Rasco, “Monitoring Quality Loss of Pasteur- ized Skim Milk Using Visible and Short Wavelength Near-Infrared Spectroscopy and Multivariate Analysis,” Journal of Dairy Science, Vol. 91, No. 3, 2008, pp. 950- 958. doi:10.3168/jds.2007-0618 [33] N. Nicolaou, Y. Xu and R. Goodacre, “Fourier Transform Infrared Spectroscopy and Multivariate Analysis for the Detection and Quantification of Different Milk Species,” Journal of Dairy Science, Vol. 93, No. 12, 2010, pp. 5651-5660. doi:10.3168/jds.2010-3619 [34] S. O. Yagoub, F. A. Bellow and I. El Zubeir, “Effect of Temperature and Storage Period on the Constituents of Milk Inoculated with Pseudomonas aeruginosa,” Re- search Journal of Microbiology, Vol. 3, No. 1, 2008, pp. 30-34. [35] E. Chiacchierini, F. D. Ascenzo, D. Restuccia and G. Vinci, “Milk Soluble Whey Proteins: Fast and Precise Determination with Dumas Method,” Analytical Letters, Vol. 36, No. 11, 2003, p. 2473. doi:10.1081/AL-120024336 [36] D. H. Kleyn, J. M. Lynch, D. M. Barbano, M. J. Bloom and M. W. Mitchell, “Determination of Fat in Raw and Processed Milks by the Gerber Method: Collaborative Study,” Journal of AOAC International, Vol. 84, No. 5, 2001, pp. 1499-1508. [37] E. H. Zacharov and M. Halpern, “Culturable Psychrotro- phic Bacterial Communities in Raw Milk and Their Pro- teolytic and Lipolytic Traits,” Applied and Environmental Microbiology, Vol. 73, No. 22, 2007, pp. 7162-7168. doi:10.1128/AEM.00866-07 [38] D. D. Muir, “The Shelf-Life of Dairy Products: 1. Factors Influencing Raw Milk and Fresh Products,” International Journal of Dairy Technology, Vol. 49, No. 1, 1996, pp. 24-32. doi:10.1111/j.1471-0307.1996.tb02616.x [39] Tetra Pack International S.A., “Tetra Pak—About Proc- essing, Packaging and Aseptic Technology,” 2013. http://www.tetrapak.com/packages/aseptic_packages/page s/default.aspx [40] Evergreen Packaging, “Packaging Innovation,” 2013. http://www.evergreenpackaging.com/fresh-by-design/inn ovation Copyright © 2013 SciRes. FNS  Milk Spoilage: Methods and Practices of Detecting Milk Quality Copyright © 2013 SciRes. FNS 123 [41] C. Kouki, E. Sakin, Z. Jemai and Y. Dallery, “Assessing the Impact of Perishability and the Use of Time Tem- perature Technologies on Inventory Management,” In- ternational Journal of Production Economics, Vol. 143, No. 1, 2013, pp. 72-85. [42] C. Fortin and H. L. Goodwin, “Valuation of Temp- Time’s Fresh Check Indicator on Perishable Food Prod- ucts in Belgium,” Selected Paper Prepared for Presenta- tion at the Southern Agricultural Economics Association Annual Meeting, Dallas, 2-5 February 2008, pp. 1-20. [43] TempTime Corporation, “Products Overview,” 2009. http://www.temptimecorp.com/publicpages/Products-Ove rview.aspx
|