 Food and Nutrition Sciences, 2013, 4, 99-105 http://dx.doi.org/10.4236/fns.2013.47A012 Published Online July 2013 (http://www.scirp.org/journal/fns) Training of Food Providers for Improved Environmental Conditions of Food Service Outlets in Urban Area Nigeria Motunrayo F. Olumakaiye, Kudirat O. Bakare Department of Family, Nutrition and Consumer Sciences, Faculty of Agriculture, Obafemi Awolowo University, Ile Ife, Nigeria. Email: tunrayomakaiye@yahoo.co.uk, bissibakare@oauife.edu.ng Received March 22nd, 2013; revised April 23rd, 2013; accepted April 30th, 2013 Copyright © 2013 Motunrayo F. Olumakaiye, Kudirat O. Bakare. This is an open access article distributed under the Creative Com- mons Attribution License, which permits unrestricted use, distribution, and reproduction in any medium, provided the original work is properly cited. ABSTRACT Environmental conditions and hygiene practices under which foods are prepared and served for public consumption are a matter of concern. The study was conducted to investigate the impact of training of food providers on environmental conditions of food service outlets (FSO) in and around a university community in Southwestern Nigeria. Structured questionnaire and “Spot Check Observation” (SCO) were used to assess the hygiene practices and environmental condi- tion of the FSO respectively. Sixteen (16) High Density Food Service Outlets (HDFSO) and twelve (12) Low Density Food Service Outlets (LDFSO) were investigated. From the findings, mean score of SCO for HDFSO was low (2.93 ± 0.09) compared to LDFSO (4.32 ± 0.56) (p = 0.014). There were significant differences in source of cooking water (p = 0.003), solid waste disposal method (p = 0.031), liquid waste disposal method (p = 0.023) and toilet facilities (p = 0.001) between HDFSO and LDFSO. Significant differences existed in the environmental hygiene between HDFSO and LDFSO (p < 0.05). A significant relationship existed between educational level (r = 0.789, p = 0.038), age (r = 0.631, p = 0.045), income (r = 0.623, p = 0.004) of food service providers and environmental condition. Service providers that were >40 years of age were more likely to score high in SCO in HDFSO than the other age groups (OR = 1.80, 95%CI = 1.21, 2.68). Those with tertiary education were twice more likely to score high in SCO compared to those with lower educational qualifications in LDFSO (OR = 2.03, 95%CI = 1.48 - 2.78). Those who earned above ₦40,000.00 were more likely to have higher SCO among both categories. A 3-day food safety workshop was organized among both groups at different times, three months later, SCO was conducted and scores improved greatly. Constant training of food service providers is important to improving the environmental condition of food service outlets in high-density urban areas in order to ensure food safety. Keywords: Food Service; Environment; Hygiene; Training; Nigeria 1. Introduction Eating away from home is becoming popular; it is an important feature of urban centers in many developing countries. Recently, food service outlets are widespread in Nigeria ranging from restaurants, “bukateria”, hotels, fast food centers, kiosks to counters where food and snacks are sold. This development could be attributed to increased industrialization and urbanization, thence make more people to eat out. The number of meals eaten at home has reduced; lighter meals appear to be taken in place of formal meals due to the nature of work schedule of individuals. However, effective cleaning and preven- tion of cross-contamination are both essential in ensuring that ready-to-eat food served by food vendors is safe to eat. Food safety is of utmost public health concern in the twenty-first century [1]. Food consumed at retail food service establishments including restaurants, clubs, schools, and university foodservice are sources of food borne illnesses and food handlers contribute to food borne illness outbreaks [2,3]. Every year in the United States an estimate of 48 million illnesses, 128,000 hospi- talizations, and 3000 deaths are the consequence of food- borne illnesses [4]. In the United States people are spend- ing approximately $580 million on purchasing food from retail foodservice operations [5]. According to the US [6], the top three factors contributing to foodborne illnesses in foodservice operations are: 1) poor personal/environ- mental hygiene; 2) cross contamination; and 3) time/tem- perature control. For the purpose of this study, environ- Copyright © 2013 SciRes. FNS 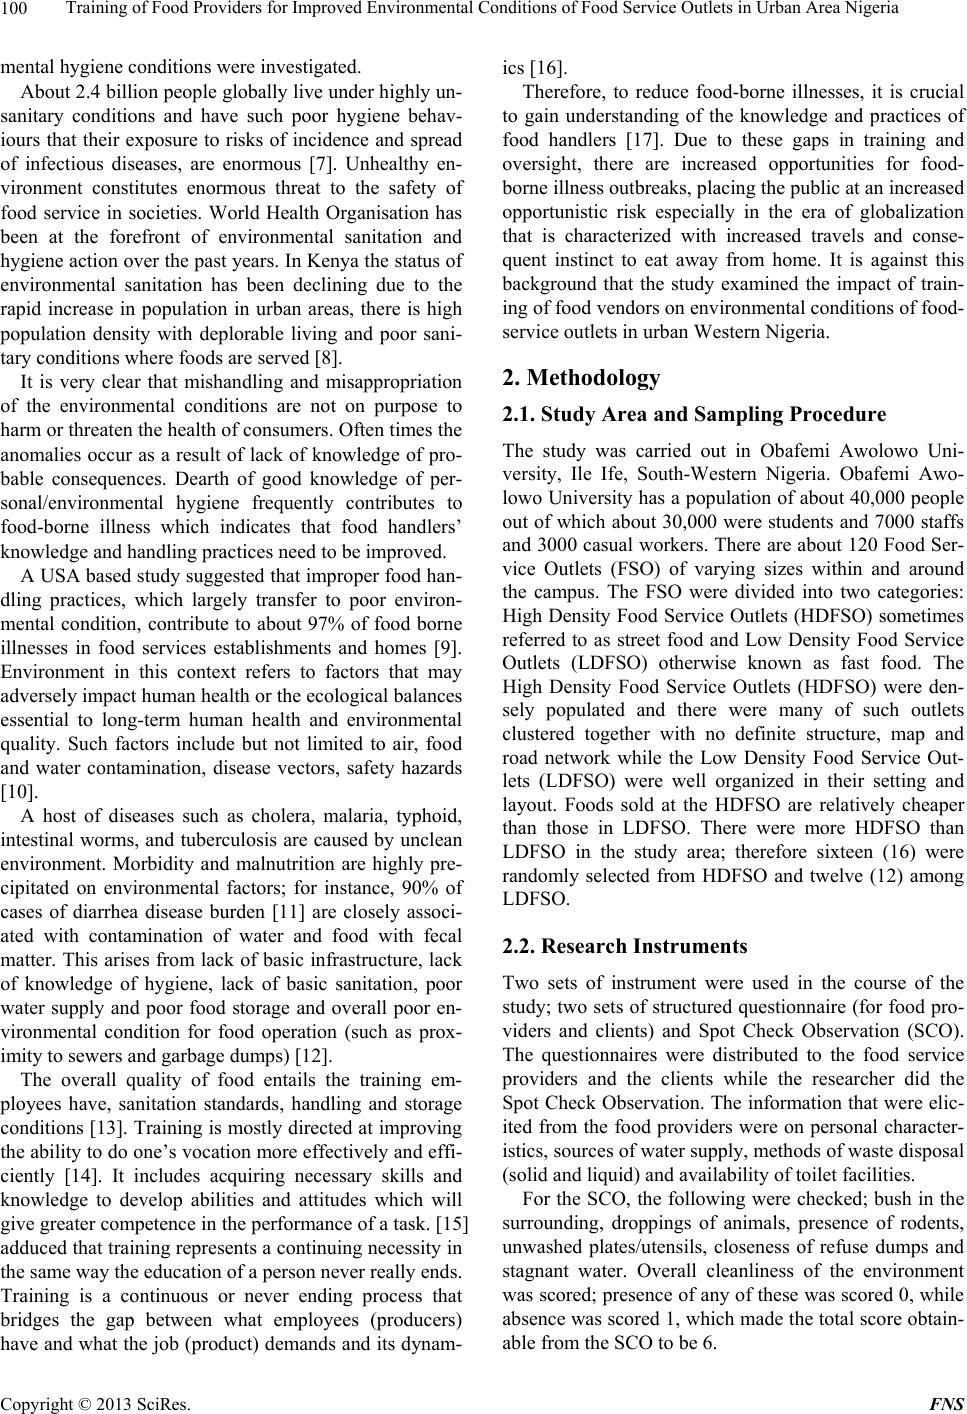 Training of Food Providers for Improved Environmental Conditions of Food Service Outlets in Urban Area Nigeria 100 mental hygiene conditions were investigated. About 2.4 billion people globally live under highly un- sanitary conditions and have such poor hygiene behav- iours that their exposure to risks of incidence and spread of infectious diseases, are enormous [7]. Unhealthy en- vironment constitutes enormous threat to the safety of food service in societies. World Health Organisation has been at the forefront of environmental sanitation and hygiene action over the past years. In Kenya the status of environmental sanitation has been declining due to the rapid increase in population in urban areas, there is high population density with deplorable living and poor sani- tary conditions where foods are served [8]. It is very clear that mishandling and misappropriation of the environmental conditions are not on purpose to harm or threaten the health of consumers. Often times the anomalies occur as a result of lack of knowledge of pro- bable consequences. Dearth of good knowledge of per- sonal/environmental hygiene frequently contributes to food-borne illness which indicates that food handlers’ knowledge and handling practices need to be improved. A USA based study suggested that improper food han- dling practices, which largely transfer to poor environ- mental condition, contribute to about 97% of food borne illnesses in food services establishments and homes [9]. Environment in this context refers to factors that may adversely impact human health or the ecological balances essential to long-term human health and environmental quality. Such factors include but not limited to air, food and water contamination, disease vectors, safety hazards [10]. A host of diseases such as cholera, malaria, typhoid, intestinal worms, and tuberculosis are caused by unclean environment. Morbidity and malnutrition are highly pre- cipitated on environmental factors; for instance, 90% of cases of diarrhea disease burden [11] are closely associ- ated with contamination of water and food with fecal matter. This arises from lack of basic infrastructure, lack of knowledge of hygiene, lack of basic sanitation, poor water supply and poor food storage and overall poor en- vironmental condition for food operation (such as prox- imity to sewers and garbage dumps) [12]. The overall quality of food entails the training em- ployees have, sanitation standards, handling and storage conditions [13]. Training is mostly directed at improving the ability to do one’s vocation more effectively and effi- ciently [14]. It includes acquiring necessary skills and knowledge to develop abilities and attitudes which will give greater competence in the performance of a task. [15] adduced that training represents a continuing necessity in the same way the education of a person never really ends. Training is a continuous or never ending process that bridges the gap between what employees (producers) have and what the job (product) demands and its dynam- ics [16]. Therefore, to reduce food-borne illnesses, it is crucial to gain understanding of the knowledge and practices of food handlers [17]. Due to these gaps in training and oversight, there are increased opportunities for food- borne illness outbreaks, placing the public at an increased opportunistic risk especially in the era of globalization that is characterized with increased travels and conse- quent instinct to eat away from home. It is against this background that the study examined the impact of train- ing of food vendors on environmental conditions of food- service outlets in urban Western Nigeria. 2. Methodology 2.1. Study Area and Sampling Procedure The study was carried out in Obafemi Awolowo Uni- versity, Ile Ife, South-Western Nigeria. Obafemi Awo- lowo University has a population of about 40,000 people out of which about 30,000 were students and 7000 staffs and 3000 casual workers. There are about 120 Food Ser- vice Outlets (FSO) of varying sizes within and around the campus. The FSO were divided into two categories: High Density Food Service Outlets (HDFSO) sometimes referred to as street food and Low Density Food Service Outlets (LDFSO) otherwise known as fast food. The High Density Food Service Outlets (HDFSO) were den- sely populated and there were many of such outlets clustered together with no definite structure, map and road network while the Low Density Food Service Out- lets (LDFSO) were well organized in their setting and layout. Foods sold at the HDFSO are relatively cheaper than those in LDFSO. There were more HDFSO than LDFSO in the study area; therefore sixteen (16) were randomly selected from HDFSO and twelve (12) among LDFSO. 2.2. Research Instruments Two sets of instrument were used in the course of the study; two sets of structured questionnaire (for food pro- viders and clients) and Spot Check Observation (SCO). The questionnaires were distributed to the food service providers and the clients while the researcher did the Spot Check Observation. The information that were elic- ited from the food providers were on personal character- istics, sources of water supply, methods of waste disposal (solid and liquid) and availability of toilet facilities. For the SCO, the following were checked; bush in the surrounding, droppings of animals, presence of rodents, unwashed plates/utensils, closeness of refuse dumps and stagnant water. Overall cleanliness of the environment was scored; presence of any of these was scored 0, while absence was scored 1, which made the total score obtain- able from the SCO to be 6. Copyright © 2013 SciRes. FNS 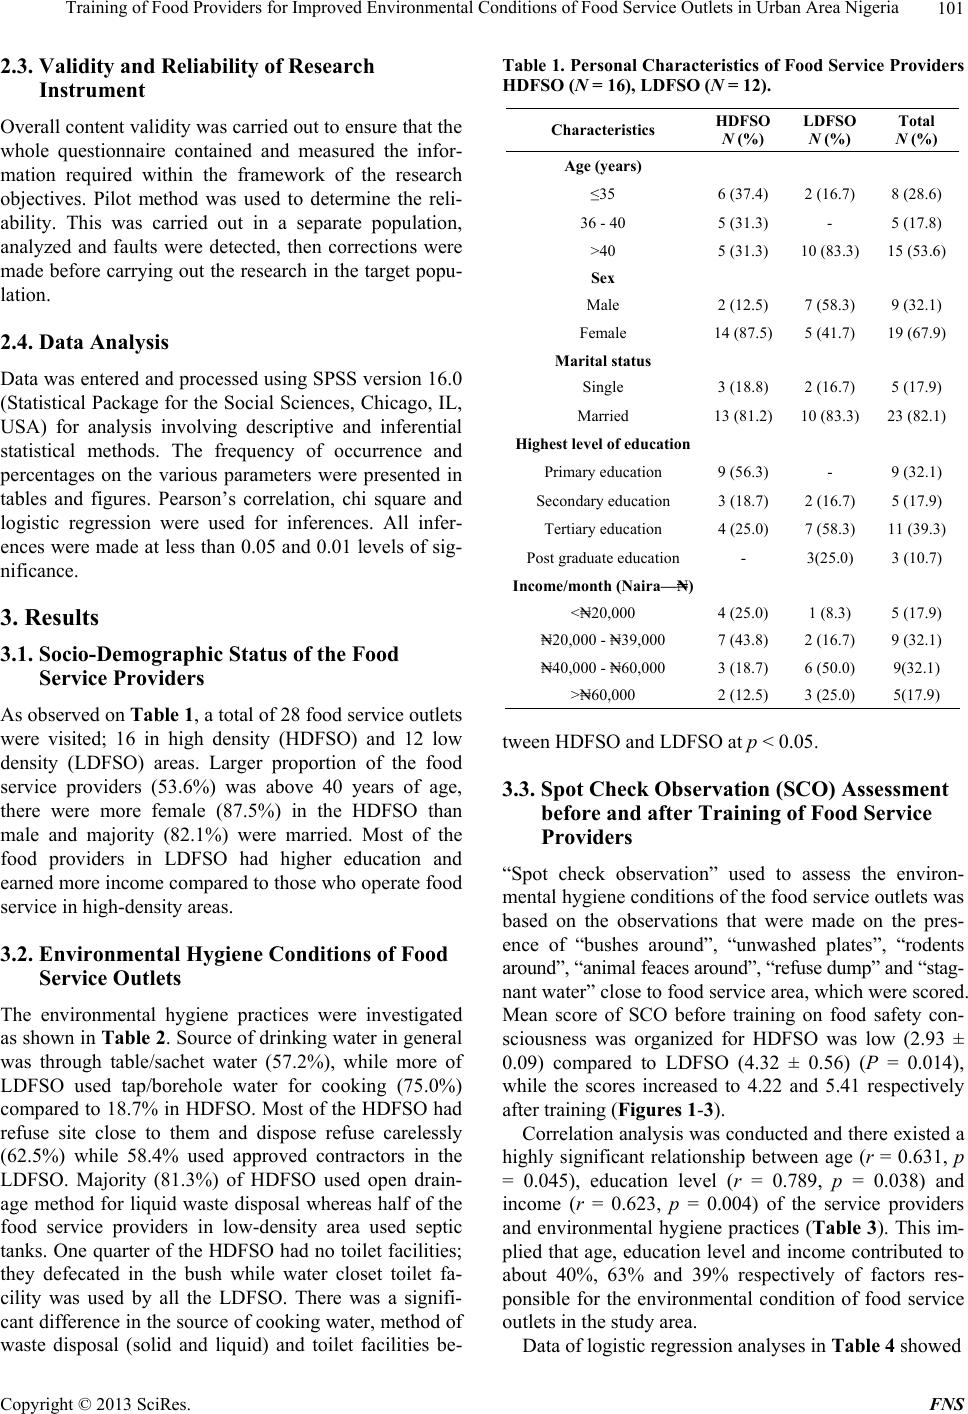 Training of Food Providers for Improved Environmental Conditions of Food Service Outlets in Urban Area Nigeria 101 2.3. Validity and Reliability of Research Instrument Overall content validity was carried out to ensure that the whole questionnaire contained and measured the infor- mation required within the framework of the research objectives. Pilot method was used to determine the reli- ability. This was carried out in a separate population, analyzed and faults were detected, then corrections were made before carrying out the research in the target popu- lation. 2.4. Data Analysis Data was entered and processed using SPSS version 16.0 (Statistical Package for the Social Sciences, Chicago, IL, USA) for analysis involving descriptive and inferential statistical methods. The frequency of occurrence and percentages on the various parameters were presented in tables and figures. Pearson’s correlation, chi square and logistic regression were used for inferences. All infer- ences were made at less than 0.05 and 0.01 levels of sig- nificance. 3. Results 3.1. Socio-Demographic Status of the Food Service Providers As observed on Table 1, a total of 28 food service outlets were visited; 16 in high density (HDFSO) and 12 low density (LDFSO) areas. Larger proportion of the food service providers (53.6%) was above 40 years of age, there were more female (87.5%) in the HDFSO than male and majority (82.1%) were married. Most of the food providers in LDFSO had higher education and earned more income compared to those who operate food service in high-density areas. 3.2. Environmental Hygiene Conditions of Food Service Outlets The environmental hygiene practices were investigated as shown in Table 2. Source of drinking water in general was through table/sachet water (57.2%), while more of LDFSO used tap/borehole water for cooking (75.0%) compared to 18.7% in HDFSO. Most of the HDFSO had refuse site close to them and dispose refuse carelessly (62.5%) while 58.4% used approved contractors in the LDFSO. Majority (81.3%) of HDFSO used open drain- age method for liquid waste disposal whereas half of the food service providers in low-density area used septic tanks. One quarter of the HDFSO had no toilet facilities; they defecated in the bush while water closet toilet fa- cility was used by all the LDFSO. There was a signifi- cant difference in the source of cooking water, method of waste disposal (solid and liquid) and toilet facilities be- Table 1. Personal Characteristics of Food Service Providers HDFSO (N = 16), LDFSO (N = 12). Characteristics HDFSO N (%) LDFSO N (%) Total N (%) Age (years) ≤35 6 (37.4) 2 (16.7) 8 (28.6) 36 - 40 5 (31.3) - 5 (17.8) >40 5 (31.3) 10 (83.3) 15 (53.6) Sex Male 2 (12.5) 7 (58.3) 9 (32.1) Female 14 (87.5) 5 (41.7) 19 (67.9) Marital status Single 3 (18.8) 2 (16.7) 5 (17.9) Married 13 (81.2) 10 (83.3) 23 (82.1) Highest level of education Primary education 9 (56.3) - 9 (32.1) Secondary education 3 (18.7) 2 (16.7) 5 (17.9) Tertiary education 4 (25.0) 7 (58.3) 11 (39.3) Post graduate education - 3(25.0) 3 (10.7) Income/month (Naira—₦) <₦20,000 4 (25.0) 1 (8.3) 5 (17.9) ₦20,000 - ₦39,000 7 (43.8) 2 (16.7) 9 (32.1) ₦40,000 - ₦60,000 3 (18.7) 6 (50.0) 9(32.1) >₦60,000 2 (12.5) 3 (25.0) 5(17.9) tween HDFSO and LDFSO at p < 0.05. 3.3. Spot Check Observation (SCO) Assessment before and after Training of Food Service Providers “Spot check observation” used to assess the environ- mental hygiene conditions of the food service outlets was based on the observations that were made on the pres- ence of “bushes around”, “unwashed plates”, “rodents around”, “animal feaces around”, “refuse dump” and “stag- nant water” close to food service area, which were scored. Mean score of SCO before training on food safety con- sciousness was organized for HDFSO was low (2.93 ± 0.09) compared to LDFSO (4.32 ± 0.56) (P = 0.014), while the scores increased to 4.22 and 5.41 respectively after training (Figures 1-3). Correlation analysis was conducted and there existed a highly significant relationship between age (r = 0.631, p = 0.045), education level (r = 0.789, p = 0.038) and income (r = 0.623, p = 0.004) of the service providers and environmental hygiene practices (Table 3). This im- plied that age, education level and income contributed to about 40%, 63% and 39% respectively of factors res- ponsible for the environmental condition of food service outlets in the study area. Data of logistic regression analyses in Table 4 showed Copyright © 2013 SciRes. FNS  Training of Food Providers for Improved Environmental Conditions of Food Service Outlets in Urban Area Nigeria 102 Table 2. Hygiene practices of food service outlets. Sources of water HDFSO N (%) LDFSO N (%) Total N (%)p-value Drinking water Well water 3 (18.7)- 3 (10.7) Tap water/bore hole 4 (25.0)5 (41.7) 9 (32.1)0.083 Table/sachets water 9 (56.3)7 (58.3) 16 (57.2) Cooking water Water vendor 4 (25.0)- 4 (14.4) Well water 9 (56.3)3 (25.0) 12 (42.8)0.003* Tap water/bore hole 3 (18.7)9 (75.0) 12 (42.8) Method of waste disposal Solid waste Open refuse dump 10 (62.5)1 (8.3) 11 (39.3) Burning 2 (12.5)3 (25.0) 5 (17.9)0.031* Burying - 1 (8.3) 1 (3.5) Approved contractors 4 (25.0)7(58.4) 11 (39.3) Liquid waste Open drainage 13 (81.3)2 (16.7) 15 (53.6) Covered drainage 3 (18.7)4 (33.3) 7 (25.0)0.022* Septic tank - 6 (50.0) 6 (21.4) Toilet facilities Latrine 10 (62.5)- 10 (35.7) Water closet 2 (12.5)12 (100.0) 14 (50.0)0.001* In the bush 4 (25.0)- 4 (14.3) HDFSO (N = 16), LDFSO (N = 12); *Significant differences existed be- tween HDFSO and LDFSO at p ≤ 0.05. Table 3. Correlation analysis showing the relationship be- tween environmental hygiene condition and selected vari- ables. Variables r r2 % determination p value Age 0.631 0.398 39.8 0.045 Education level 0.789 0.623 62.5 0.038 Income 0.623 0.388 38.8 0.004 Figure 1. Graph showing scores of spot check observation before and after training of food providers in HDFSO. Figure 2. Graph showing scores of spot check observation before and after training of food providers in LDFSO. Figure 3. Overall spot check observation score of food ser- vice outlets before and after training. Table 4. Multivariable odds ratios and environmental con- dition scores of food service providers. HDFSO LDFSO OR 95%CI OR 95%CI Age (years) ≤35 (ref) 1.00 1.00 36 - 40 1.18*1.21, 2.68 1.04 0.50, 2.17 >40 0.360.22, 0.61 2.18* 1.08, 4.40 Highest education level Primary education (ref)1.00 1.00 Secondary education 2.03*1.48, 2.78 1.25 0.50, 3.16 Tertiary education 0.250.09, 0.68 2.62* 1.14, 6.03 Post graduate education- - 0.72 0.01, 0.45 Income/month (Naira) <20,000 (ref) 1.00 1.00 20,000 - 39,000 0.170.23, 0.44 0.09 0.65, 2.27 40,000 - 60,000 1.28*0.95, 1.75 1.63 1.91, 2.27 >60,000 1.631.29, 2.06 5.02* 0.87, 4.21 *Estimate is significantly different from that of the reference group: p ≤ 0.05. that those who were 40 years and above were twice more likely to have better environmental hygiene condition among the LDFSO than those who were less than 35 years old (OR = 2.18, 95%CI = 1.08, 4.40), while those who had secondary education were also twice more likely than those with primary education to have better environmental hygiene condition among HDFSO (OR = 2.03, 95%CI = 1.48, 2.78). Similarly, those who earned Copyright © 2013 SciRes. FNS 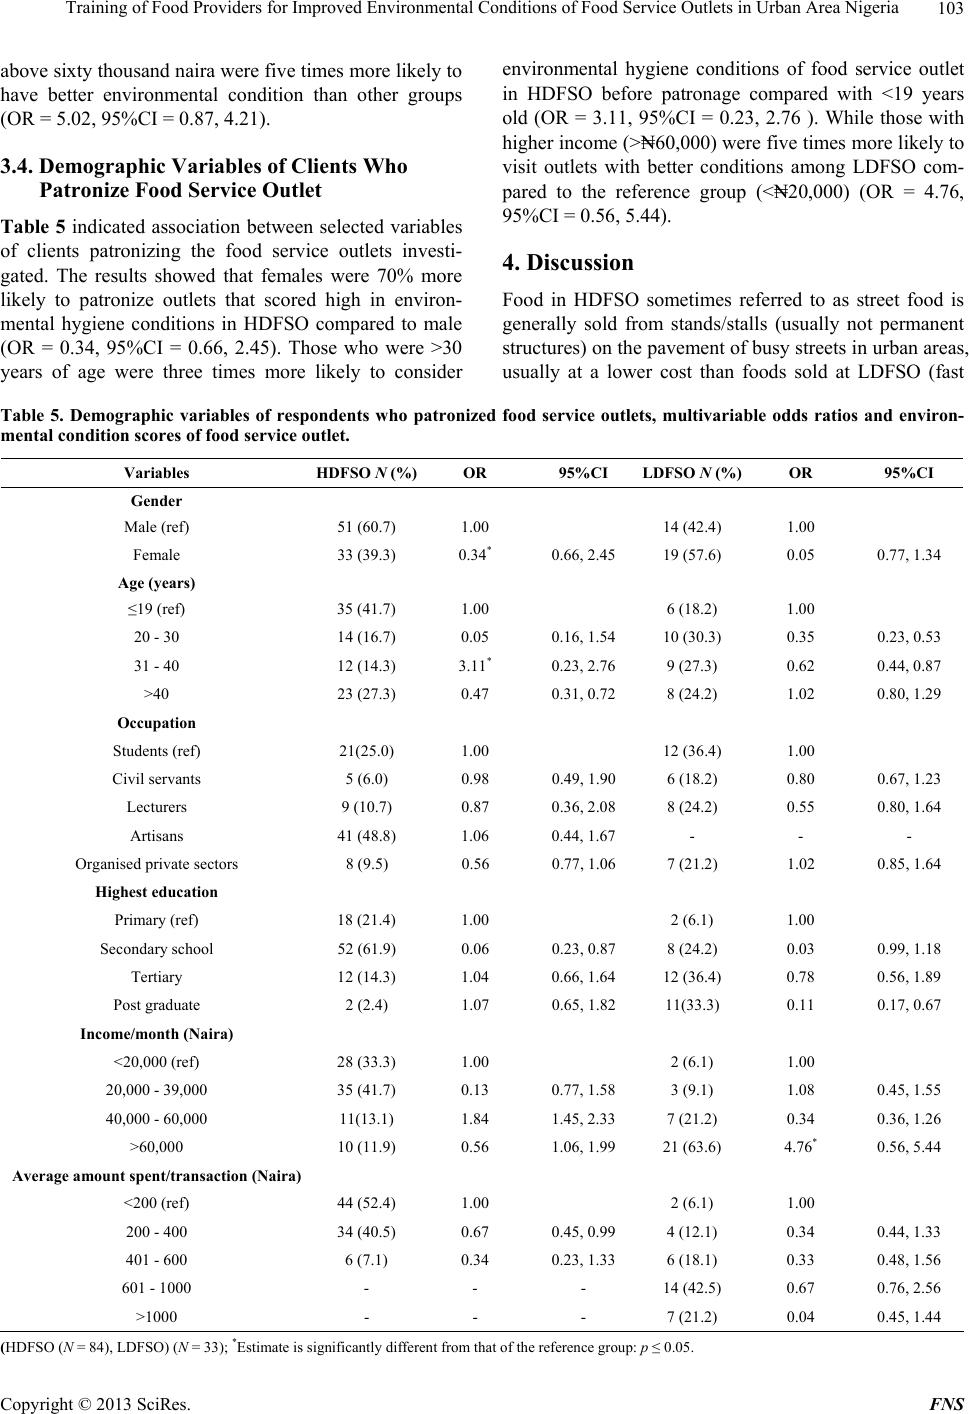 Training of Food Providers for Improved Environmental Conditions of Food Service Outlets in Urban Area Nigeria Copyright © 2013 SciRes. FNS 103 above sixty thousand naira were five times more likely to have better environmental condition than other groups (OR = 5.02, 95%CI = 0.87, 4.21). 3.4. Demographic Variables of Clients Who Patronize Food Service Outlet Table 5 indicated association between selected variables of clients patronizing the food service outlets investi- gated. The results showed that females were 70% more likely to patronize outlets that scored high in environ- mental hygiene conditions in HDFSO compared to male (OR = 0.34, 95%CI = 0.66, 2.45). Those who were >30 years of age were three times more likely to consider environmental hygiene conditions of food service outlet in HDFSO before patronage compared with <19 years old (OR = 3.11, 95%CI = 0.23, 2.76 ). While those with higher income (>₦60,000) were five times more likely to visit outlets with better conditions among LDFSO com- pared to the reference group (<₦20,000) (OR = 4.76, 95%CI = 0.56, 5.44). 4. Discussion Food in HDFSO sometimes referred to as street food is generally sold from stands/stalls (usually not permanent structures) on the pavement of busy streets in urban areas, usually at a lower cost than foods sold at LDFSO (fast Table 5. Demographic variables of respondents who patronized food service outlets, multivariable odds ratios and environ- mental condition scores of food service outlet. Variables HDFSO N (%)OR 95%CI LDFSO N (%) OR 95%CI Gender Male (ref) 51 (60.7) 1.00 14 (42.4) 1.00 Female 33 (39.3) 0.34* 0.66, 2.45 19 (57.6) 0.05 0.77, 1.34 Age (years) ≤19 (ref) 35 (41.7) 1.00 6 (18.2) 1.00 20 - 30 14 (16.7) 0.05 0.16, 1.54 10 (30.3) 0.35 0.23, 0.53 31 - 40 12 (14.3) 3.11* 0.23, 2.76 9 (27.3) 0.62 0.44, 0.87 >40 23 (27.3) 0.47 0.31, 0.72 8 (24.2) 1.02 0.80, 1.29 Occupation Students (ref) 21(25.0) 1.00 12 (36.4) 1.00 Civil servants 5 (6.0) 0.98 0.49, 1.90 6 (18.2) 0.80 0.67, 1.23 Lecturers 9 (10.7) 0.87 0.36, 2.08 8 (24.2) 0.55 0.80, 1.64 Artisans 41 (48.8) 1.06 0.44, 1.67 - - - Organised private sectors 8 (9.5) 0.56 0.77, 1.06 7 (21.2) 1.02 0.85, 1.64 Highest education Primary (ref) 18 (21.4) 1.00 2 (6.1) 1.00 Secondary school 52 (61.9) 0.06 0.23, 0.87 8 (24.2) 0.03 0.99, 1.18 Tertiary 12 (14.3) 1.04 0.66, 1.64 12 (36.4) 0.78 0.56, 1.89 Post graduate 2 (2.4) 1.07 0.65, 1.82 11(33.3) 0.11 0.17, 0.67 Income/month (Naira) <20,000 (ref) 28 (33.3) 1.00 2 (6.1) 1.00 20,000 - 39,000 35 (41.7) 0.13 0.77, 1.58 3 (9.1) 1.08 0.45, 1.55 40,000 - 60,000 11(13.1) 1.84 1.45, 2.33 7 (21.2) 0.34 0.36, 1.26 >60,000 10 (11.9) 0.56 1.06, 1.99 21 (63.6) 4.76* 0.56, 5.44 Average amount spent/transaction (Naira) <200 (ref) 44 (52.4) 1.00 2 (6.1) 1.00 200 - 400 34 (40.5) 0.67 0.45, 0.99 4 (12.1) 0.34 0.44, 1.33 401 - 600 6 (7.1) 0.34 0.23, 1.33 6 (18.1) 0.33 0.48, 1.56 601 - 1000 - - - 14 (42.5) 0.67 0.76, 2.56 >1000 - - - 7 (21.2) 0.04 0.45, 1.44 (HDFSO (N = 84), LDFSO) (N = 33); *Estimate is significantly different from that of the reference group: p ≤ 0.05.  Training of Food Providers for Improved Environmental Conditions of Food Service Outlets in Urban Area Nigeria 104 food). Hence they provide an accessible source of food to low income people whereas, in LDFSO, foods are sold in formal structures such as buildings and malls and fre- quently operate as franchise. The socio economic status of food service providers were investigated in the study and the findings indicated that majority of the food service providers were female. This corroborates the findings of [8] who opined that food vendors were majorly female in Nigeria, Ghana, Uganda and Kenya. The findings however, contradict the situation in Bangladesh and Botswana where the majority of street food vendors were men [18]. In Nairobi, street food vendors had basic hygiene knowledge, but were unable to translate this basic hy- giene knowledge into safe food practices [8]. Despite the fact that the educational level of the food service provid- ers was high in the study, the level of hygiene practices was somewhat low before they were formally trained on food safety knowledge. This could be attributed to the varied age and diverse personality of food service pro- viders without any formal training in food preparation for business or hygiene and sanitation issues. A study undertaken at three different shopping malls in Johannesburg included young adults who patronized fast food centers from three different socio-economic strata [19]. This contradicts findings in the study, which indicated that those who patronized HDFSO were young people (<19 years) while adults (>30 years) patronized LDFSO. Findings from the study revealed that people who earned higher income (>₦60,000) patronized LDFSO. This is in agreement with a study in South Africa by [20]. (2011), almost half of the participants who patronized fast food centers and not street foods earned less than R5000 (₦100,000) per month. As for the environmental condition of the food service, age of food providers, education and income were impor- tant determinants of the environmental condition of the food service outlets in the study area. This finding cor- roborates the findings in a similar study conducted in USA, which showed that age, education level, and in- come were found to be significant in assessing patronage of green restaurants [21]. However, younger consumer groups (<19 years) were less concerned about the envi- ronmental condition of food service outlets in this study. This could lead to incessant outbreaks of foodborne dis- ease among the adolescents, which may lead to the de- pletion of nutrient stores thereby predisposing them to malnutrition, especially among the female. Distinct gen- der roles has led most researchers to argue that women are more likely than men to be concerned with environ- mental condition because women will, as a result of so- cial development and sex role differences, more carefully consider the impact of their actions on others [22]. This is in line with this study that female were more likely than male to consider environment before patronizing a food service outlet especially among the older group. In conclusion, since formal training in food prepara- tion for business or hygiene and sanitation issues is im- portant in translating basic hygiene knowledge into safe food practices as depicted in this study, what is needed is to put in place constant vendors’ training and consumer sensitization programmes to ensure food safety and nu- tritional quality at all levels. 5. Acknowledgements We want to acknowledge the contributions of the stu- dents of the Department of Family, Nutrition and Con- sumer Sciences, Obafemi Awolowo University, Ile Ife, Nigeria who assisted in data collection. Also the Food Service Providers who voluntarily participated in the survey were appreciated. REFERENCES [1] D. Pattron, “Quality Assurance and Food Service,” Scien- tific Publishers, New York, 2004. [2] S. L. Olson, L. MacKinon, J. Goulding, N. Bean and L. Slutsker, “Surveillance for Foodborne Diseases Outbreaks— United States,” Morbidity and Mortality Weekly Report, Vol. 49, 1997, pp. 1-51. [3] J. Guzewich and M. Ross, “Evaluation of Risk Related to Microbiological Contamination of Ready-to-Eat Food by Food Preparation Works and the Effectiveness of Inter- ventions to Minimize Those Risks,” 1999. http://foodsafety.ksu.edu/articles/453/rte_fd_prep_risk_ev al.pdf [4] Center for Disease, Control, and Prevention, “Estimates of Foodborne Illnesses in the United States,” 2011. http://www.cdc.gov/Features/dsFoodborneEstimates/ [5] National Restaurant Association, “Restaurant Industry Fact Sheet,” 2010. http://www.franchisedirect.com/foodfranchises/2010foodf ranchiseindustryreport/14/267 [6] Food and Drug Administration, “FDA Report on the Oc- currence of Foodborne Illness Risk Factors in Selected Institutional Foodservice, Restaurants, and Retail Food Store Facility Types,” 2009. http://www.fda.gov/downloads/Food/FoodSafety/RetailFood Pro - t etion/Food bo r n e I l l n e s sandRisk FactorR edu c tio n / R e t a i lFoodRiskFactorStudies/UCM224682.pdf [7] R. N. Gent, D. R. Telford and Q. Syed, “An Outbreak of Camphylobacter Food Poisoning at a University Cam- pus,” Communicable Disease and Public Health, Vol. 2, No. 1, 1999, pp. 39-42. [8] A. Mwangi, “Nutritional, Hygienic and Socio Economic Dimensions of Street Foods in Urban Areas: The Case of Nairobi,” Wageningen University Dissertation No. 3157, 2010. [9] M. Howes, S. McEwen, M. Griffiths and L. Harris, “Food Handler Cortication by Home Study: Measuring Changes Copyright © 2013 SciRes. FNS  Training of Food Providers for Improved Environmental Conditions of Food Service Outlets in Urban Area Nigeria 105 in Knowledge and Behavior,” Dairy, Food Environ Sani- tation, Vol. 16, No. 11, 1996, pp. 737-744. [10] Association of Environmental Health Academic Programs (AEHAP), “What is Environmental Health?” 2012. http://aehap.org/about-aehap-2/what-is-environmental-he alth [11] W. N. Kung’u, P. M. Musau, Z. Ochieng, E. G. Wachira, R. T. Omol and J. Rakwar, “Diarrhoea Prevalence and Risk Factors in Slums,” Journal of the National Institute of Public Health, Vol. 51, No. 1, 2002, pp. 73-76. [12] J. E. Fielding, A. Aguirre and E. Palaiologos, “Effective- ness of Altered Incentives in a Food Safety Inspection Program,” Pr eventive Me dicine, Vol. 32, No. 3, 2001, pp. 239-244. doi:10.1006/pmed.2000.0796 [13] C. Benhura, S. F. Nyagura, V. Dakwa, P. E. Gombiro, P. Ngwenyama, R. Matanhire, A. Garamukanwa, N. Mudita, J. Zhangazha and W. Mashavira, “Food Service Quality Survey at the University of Zimbabwe Private Canteens,” Advanced Journal of Food Science Technology, Vol. 4, No. 5, 2012, pp. 281-285. [14] A. O. Ajayi and E. A. Laogun, “Priotising the Training Needs of Women Farmers for a Sustainable Agricultural Development in Nigeria in Gender, Sustainable Devel- opment and the Urban Poor in Nigeria,” In Y. Oruwari, Ed., HISIS Publishing Ltd., 1999. [15] R. Kalra and M. Bhatia, “Training Concepts and Meth- ods,” 2008. http://www.indianmba.com/faculty_column/Fc797/fc797. html [16] K. O. Bakare, “Training Needs of Hotel Employees as Cor- relates of Job Satisfaction in Ile-Ile, Osun State,” JABU International Journal of Social and Management Sci- ences, Vol. 4, No. 1, 2012, pp. 17-24. [17] World Health Organisation, 2012, http://www.who.int/water_sanitation_health/hygiene/envs an/en/ [18] O. Ohiokpehai, “Nutritional Aspects of Street Foods in Botswana,” Pakistan Journal of Nutrition, Vol. 2, No. 2, 2003, pp. 76-81. doi:10.3923/pjn.2003.76.81 [19] M. Van Zyl, N. P. Steyn and N. Marais, “Characteristics and Factors Influencing Fast Food Intake of Young Adult Consumers in Johannesburg South Africa,” South African Journal of Clinical Nutrition, Vol. 23, No. 3, 2010, pp. 118-130. [20] N. P. Steyn, D. Labadarios and J. H. Nel, “Factors Which Influence the Consumption of Street Foods and Fast Foods in South Africa—A National Survey,” Nutrition Journal, Vol. 10, 2011, p. 104. http://www.nutritionj.com/content/10/1/104 doi:10.1186/1475-2891-10-104 [21] H. Hu, H. G. Parsa and S. John, “The Dynamics of Green Restaurant Patronage,” Cornell Hospitality Quarterly, Vol. 51, No. 3, 2010, pp. 344-362. doi:10.1177/1938965510370564 [22] A. Gronhoj, and F. Olander, “A Gender Perspective on Environmentally Related Family Consumption,” Journal of Consumer Behaviour, Vol. 6, No.4, 2007, pp. 216-228. doi:10.1002/cb.216 Copyright © 2013 SciRes. FNS
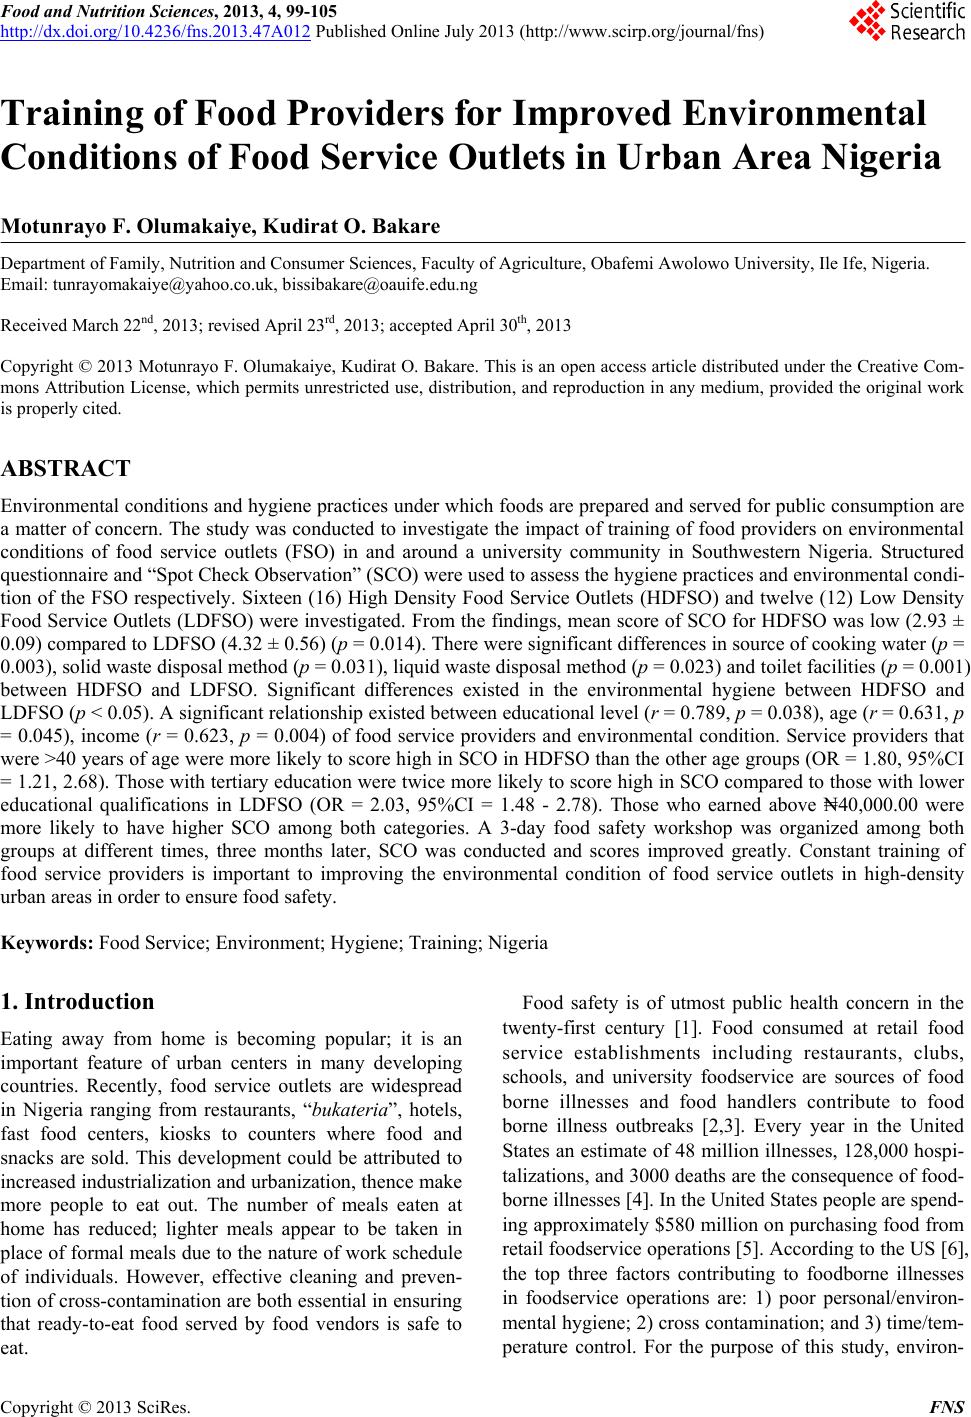
|