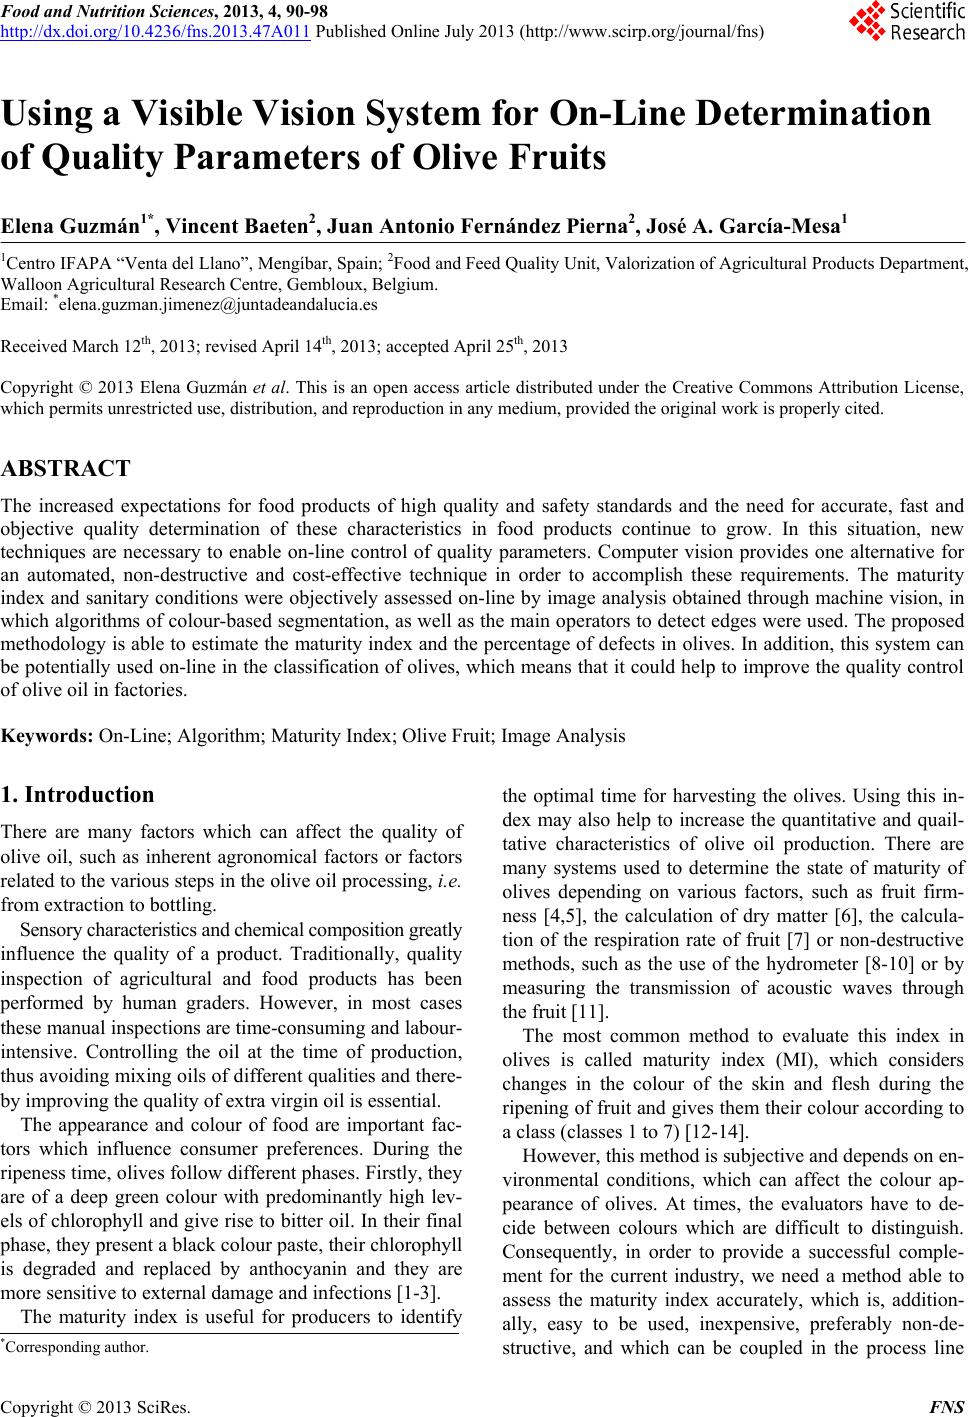
 Food and Nutrition Sciences, 2013, 4, 90-98 http://dx.doi.org/10.4236/fns.2013.47A011 Published Online July 2013 (http://www.scirp.org/journal/fns) Using a Visible Vision System for On-Line Determination of Quality Parameters of Olive Fruits Elena Guzmán1*, Vincent Baeten2, Juan Antonio Fernández Pierna2, José A. García-Mesa1 1Centro IFAPA “Venta del Llano”, Mengíbar, Spain; 2Food and Feed Quality Unit, Valorization of Agricultural Products Department, Walloon Agricultural Research Centre, Gembloux, Belgium. Email: *elena.guzman.jimenez@juntadeandalucia.es Received March 12th, 2013; revised April 14th, 2013; accepted April 25th, 2013 Copyright © 2013 Elena Guzmán et al. This is an open access article distributed under the Creative Commons Attribution License, which permits unrestricted use, distribution, and reproduction in any medium, provided the original work is properly cited. ABSTRACT The increased expectations for food products of high quality and safety standards and the need for accurate, fast and objective quality determination of these characteristics in food products continue to grow. In this situation, new techniques are necessary to enable on-line control of quality parameters. Computer vision provides one alternative for an automated, non-destructive and cost-effective technique in order to accomplish these requirements. The maturity index and sanitary conditions were objectively assessed on-line by image analysis obtained through machine vision, in which algorithms of colour-based segmentation, as well as the main operators to detect edges were used. The proposed methodology is able to estimate the maturity index and the percentage of defects in olives. In addition, this system can be potentially used on-lin e in the classification of olives, which means that it could help to improve the quality control of olive oil in factories. Keywords: On-Line; Algorithm; Maturity Index; Olive Fruit; Image Analysis 1. Introduction There are many factors which can affect the quality of olive oil, such as inherent agronomical factors or factors related to the various steps in the olive o il processing, i.e. from extraction to bottling. Sensory characteristics and chemical composition greatly influence the quality of a product. Traditionally, quality inspection of agricultural and food products has been performed by human graders. However, in most cases these manual inspections are time-consuming and labour- intensive. Controlling the oil at the time of production, thus avoiding mixing oils of different qu alities and there- by improving the quality of ex tra virgin oil is essential. The appearance and colour of food are important fac- tors which influence consumer preferences. During the ripeness time, olives follow different phases. Firstly, they are of a deep green colour with predominantly high lev- els of chlorophyll and give rise to bitter oil. In their final phase, they present a black colour paste, their chlorophyll is degraded and replaced by anthocyanin and they are more sensitive to external damage and infections [1-3]. The maturity index is useful for producers to identify the optimal time for harvesting the olives. Using this in- dex may also help to increase the quantitative and quail- tative characteristics of olive oil production. There are many systems used to determine the state of maturity of olives depending on various factors, such as fruit firm- ness [4,5], the calculation of dry matter [6], the calcula- tion of the respiration rate of fruit [7] or non-destructive methods, such as the use of the hydrometer [8-10] or by measuring the transmission of acoustic waves through the fruit [11]. The most common method to evaluate this index in olives is called maturity index (MI), which considers changes in the colour of the skin and flesh during the ripening of fruit and gives them their colour according to a class (classes 1 to 7) [12-14]. However, this method is subjective and depends on en- vironmental conditions, which can affect the colour ap- pearance of olives. At times, the evaluators have to de- cide between colours which are difficult to distinguish. Consequently, in order to provide a successful comple- ment for the current industry, we need a method able to assess the maturity index accurately, which is, addition- ally, easy to be used, inexpensive, preferably non-de- structive, and which can be coupled in the process line *Corresponding a uthor. Copyright © 2013 SciRes. FNS 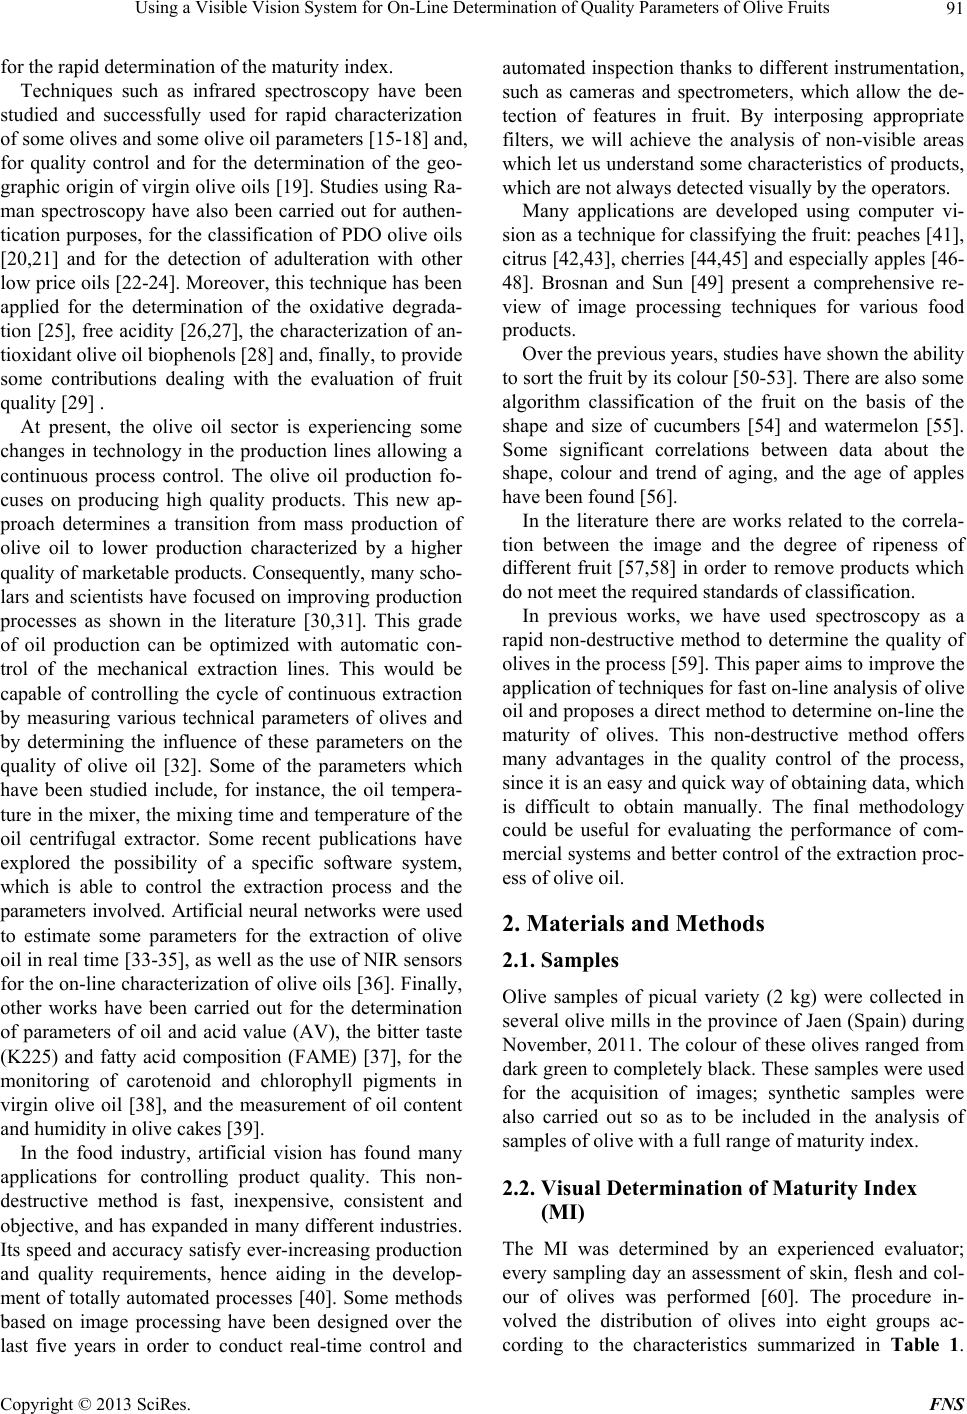 Using a Visible Vision System for On-Line Determination of Quality Parameters of Olive Fruits 91 for the rapid determination of the maturity ind e x. Techniques such as infrared spectroscopy have been studied and successfully used for rapid characterization of some olives and some olive oil parameters [15-18] and, for quality control and for the determination of the geo- graphic origin of virgin olive oils [19]. Studies using Ra- man spectroscopy have also been carried out for authen- tication purposes, for the classification of PDO olive oils [20,21] and for the detection of adulteration with other low price oils [22-24]. Moreover, this technique has been applied for the determination of the oxidative degrada- tion [25], free acidity [26,27], the characterization of an- tioxidant olive oil biophenols [28] and, finally, to provide some contributions dealing with the evaluation of fruit quality [29] . At present, the olive oil sector is experiencing some changes in technology in the production lines allowing a continuous process control. The olive oil production fo- cuses on producing high quality products. This new ap- proach determines a transition from mass production of olive oil to lower production characterized by a higher quality of marketable products. Consequently, many scho- lars and scientists have focused on improving production processes as shown in the literature [30,31]. This grade of oil production can be optimized with automatic con- trol of the mechanical extraction lines. This would be capable of controlling the cycle of continuous extraction by measuring various technical parameters of olives and by determining the influence of these parameters on the quality of olive oil [32]. Some of the parameters which have been studied include, for instance, the oil tempera- ture in the mixer, the mixing time and temperature of the oil centrifugal extractor. Some recent publications have explored the possibility of a specific software system, which is able to control the extraction process and the parameters involved. Artificial neural networks were used to estimate some parameters for the extraction of olive oil in real time [33-35], as well as the use of NIR sensors for the on-line characterization of olive oils [36]. Finally, other works have been carried out for the determination of parameters of oil and acid value (AV), the bitter taste (K225) and fatty acid composition (FAME) [37], for the monitoring of carotenoid and chlorophyll pigments in virgin olive oil [38], and the measurement of oil content and humidity in olive cakes [39]. In the food industry, artificial vision has found many applications for controlling product quality. This non- destructive method is fast, inexpensive, consistent and objective, and has expanded in many different industries. Its speed and accuracy satisfy ever-increasing production and quality requirements, hence aiding in the develop- ment of totally automated processes [40]. Some methods based on image processing have been designed over the last five years in order to conduct real-time control and automated inspection thanks to different instrumentation, such as cameras and spectrometers, which allow the de- tection of features in fruit. By interposing appropriate filters, we will achieve the analysis of non-visible areas which let us und erstand some characteristics of products, which are not always detected visually by the operators. Many applications are developed using computer vi- sion as a technique for classifying the fruit: peaches [41], citrus [42,43], cherries [44,45] and especially apples [46- 48]. Brosnan and Sun [49] present a comprehensive re- view of image processing techniques for various food products. Over the previous years, studies have sho wn th e ability to sort the fruit by its colour [50-53 ]. There are also some algorithm classification of the fruit on the basis of the shape and size of cucumbers [54] and watermelon [55]. Some significant correlations between data about the shape, colour and trend of aging, and the age of apples have been foun d [5 6] . In the literature there are works related to the correla- tion between the image and the degree of ripeness of different fruit [57,58] in order to remove products which do not meet the required standards of classification. In previous works, we have used spectroscopy as a rapid non-destructive method to determine the quality of olives in the process [59]. This paper aims to improve the application of techniques for fast on-line analysis of olive oil and proposes a direct method to determine on-line the maturity of olives. This non-destructive method offers many advantages in the quality control of the process, since it is an easy and quick way of obtaining data, wh ich is difficult to obtain manually. The final methodology could be useful for evaluating the performance of com- mercial systems and better control of the extraction proc- ess of olive oil. 2. Materials and Methods 2.1. Samples Olive samples of picual variety (2 kg) were collected in several olive mills in the province of Jaen (Spain) during November, 2011. Th e colour of these olives ranged from dark green to completely black. These samples were used for the acquisition of images; synthetic samples were also carried out so as to be included in the analysis of samples of olive with a full range of maturity index. 2.2. Visual Determination of Maturity Index (MI) The MI was determined by an experienced evaluator; every sampling day an assessment of skin, flesh and col- our of olives was performed [60]. The procedure in- volved the distribution of olives into eight groups ac- cording to the characteristics summarized in Table 1. Copyright © 2013 SciRes. FNS 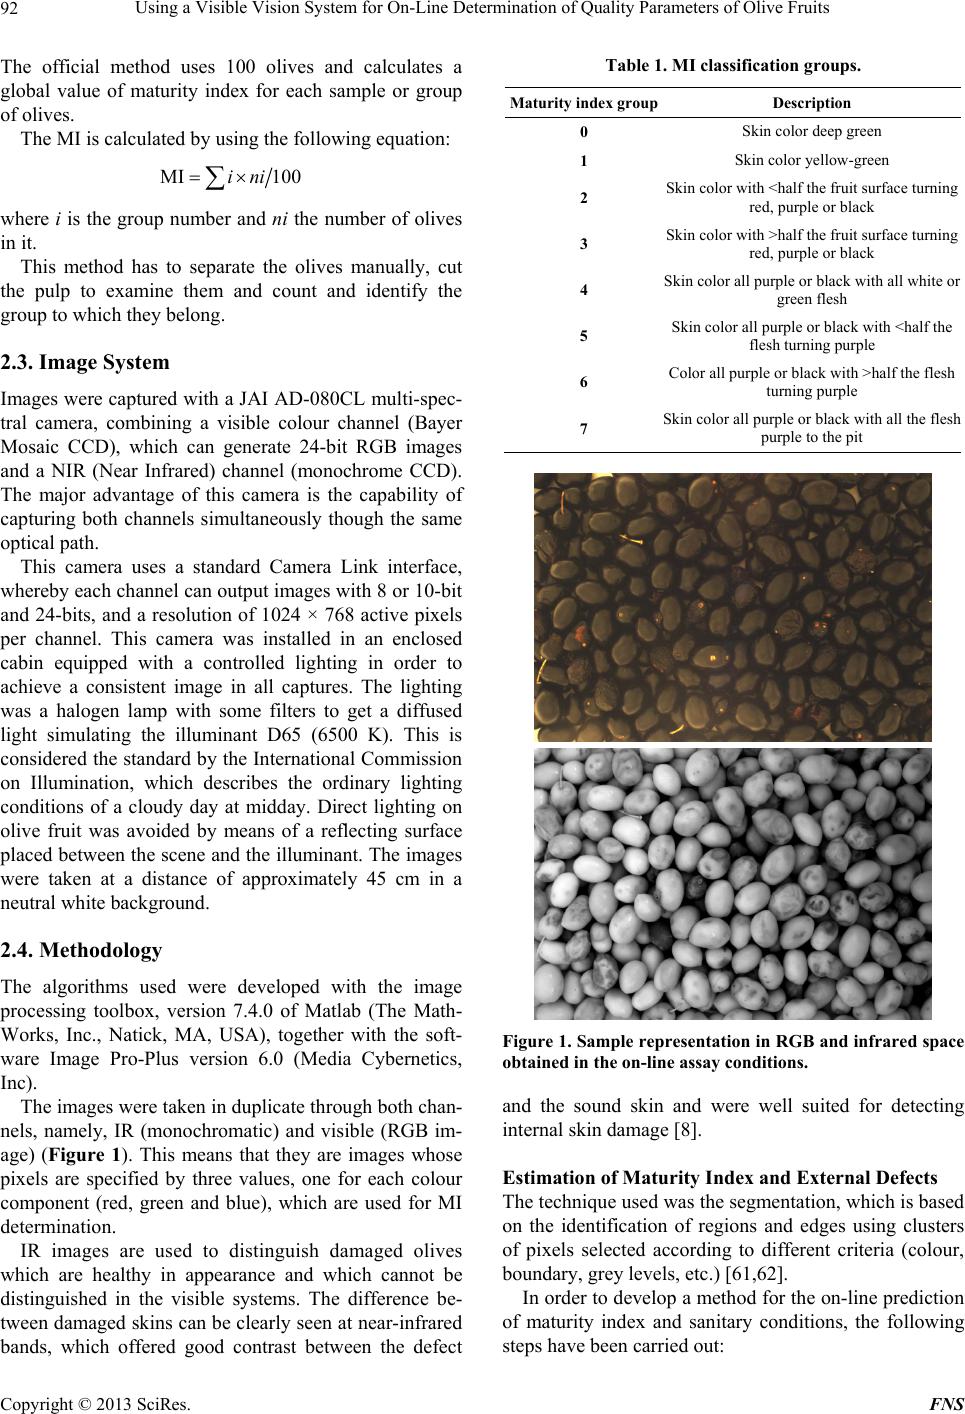 Using a Visible Vision System for On-Line Determination of Quality Parameters of Olive Fruits 92 The official method uses 100 olives and calculates a global value of maturity index for each sample or group of olives. The MI is calculated by using the following equation: MI 100ini where i is the group number and ni the number of olives in it. This method has to separate the olives manually, cut the pulp to examine them and count and identify the group to which they belong. 2.3. Image System Images were captured with a JAI AD-080CL multi-spec- tral camera, combining a visible colour channel (Bayer Mosaic CCD), which can generate 24-bit RGB images and a NIR (Near Infrared) channel (monochrome CCD). The major advantage of this camera is the capability of capturing both channels simultaneously though the same optical path. This camera uses a standard Camera Link interface, whereby each channel can output images with 8 or 10-bit and 24-bits, and a resolution of 1024 × 768 active pixels per channel. This camera was installed in an enclosed cabin equipped with a controlled lighting in order to achieve a consistent image in all captures. The lighting was a halogen lamp with some filters to get a diffused light simulating the illuminant D65 (6500 K). This is considered the stan dard by the International Commission on Illumination, which describes the ordinary lighting conditions of a cloudy day at midday. Direct lighting on olive fruit was avoided by means of a reflecting surface placed between the scene and the illuminant. The images were taken at a distance of approximately 45 cm in a neutral white background. 2.4. Methodology The algorithms used were developed with the image processing toolbox, version 7.4.0 of Matlab (The Math- Works, Inc., Natick, MA, USA), together with the soft- ware Image Pro-Plus version 6.0 (Media Cybernetics, Inc). The images were taken in duplicate through both chan- nels, namely, IR (monochromatic) and visible (RGB im- age) (Figure 1). This means that they are images whose pixels are specified by three values, one for each colour component (red, green and blue), which are used for MI determination. IR images are used to distinguish damaged olives which are healthy in appearance and which cannot be distinguished in the visible systems. The difference be- tween damaged skins can be clearly seen at near-infrared bands, which offered good contrast between the defect Table 1. MI classification groups. Maturity index groupDescription 0 Skin color deep green 1 Skin color yellow-green 2 Skin color with <half the fruit surface turning red, purple or black 3 Skin color with >half the fruit surface turning red, purple or black 4 Skin color all purple or black with all white or green flesh 5 Skin color all purple or black with <half the flesh turning purple 6 Color all purple or black with >half the flesh turning purple 7 Skin co lor al l pu rpl e o r black with all the flesh purple to the pit Figure 1. Sample representation in RGB and infrared space obtained in the on-line assay conditions. and the sound skin and were well suited for detecting internal skin damage [8]. Estimation of Maturity Index and Externa l Defec ts The technique used was the segmentation , which is based on the identification of regions and edges using clusters of pixels selected according to different criteria (colour, boundary, grey levels, etc.) [61,62]. In order to develop a method for the on-line prediction of maturity index and sanitary conditions, the following steps have been carried out: Copyright © 2013 SciRes. FNS  Using a Visible Vision System for On-Line Determination of Quality Parameters of Olive Fruits 93 1) Identification and separation of objects in the NIR image The procedure of separation of objects consists in the use of the NIR monochrome image in order to segregate every single olive fruit. To identify objects in the NIR monochrome image, the first step performed is a contrast equalization followed by a spatial filter enhancement “Flatten”, which reduces the intensity variations in the background pixels. Spatial filtering operation was ap- plied to the images to enhance or attenuate spatial detail in order to enhance visual performance or to facilitate further processing. The spatial filtering operation can be considered as a “local” procedure in image processing, in the sense of changing the value of each pixel according to the values of the surrounding pixels. From a practical point of view, this step mainly consists in classifying the original grey levels in the original NIR image according to the value in the neighbouring pixels. This task was carried out thanks to the use of two algorithms: on the one hand, Border-4 Neighbour, which determines the edges of the olive, taking into account the intensity val- ues of pixels in the histogram and considering the darker pixels as edges of objects; on the other hand, a connected components algorithm which is used to identify each olive with a value. This edge-based algorithm enumer- ates each set of pixels which represent an olive [63]. 2) Creation of a mask and application of the mask to the original image From the data in the array of connected components, a mask can be created. In addition, various size filters can be applied, so that we can measure complete objects or automatically remove the objects which overlap with an area smaller or bigger than those with a standard size olive [64]. Based on these objects, the skeleton of image is constructed. The skeleton is intended to represent the shape of an object with a relatively small number of pix- els. Thus, all pixels of the skeleton are structurally nec- essary. The position, orientation and length of the skele- ton lines correspond to those equivalents to the original image; this skeleton simplifies the task of extracting fea- tures of an image. This mask reduces the image to a skeleton and elimi- nates protrusions. The original image is added to the mask and the colour-segmentation and grey-segmenta- tion are performed in separated objects. 3) Segmentation based on colour/grey and classifica- tion This segmentation based on colour can be performed by supervised or unsupervised methods in order to get and quantify the predominant colour in the olives. This step requires transforming the RGB image using various functions to transform RGB format in L*a*b colour space. The CIE L*a*b* colour notation system was ap- plied to determine the parameters L*, a* and b*; where L* indicates the lightness, a* means the colour axis from green to red and b* refers to the blue-yellow one. On the one hand, in the supervised methods a region containing the colour of interest (colour markers) is se- lected and then averaged. This classification is performed by using the method of the k-nearest neighbours (KNN) [65], where each pixel is classified in the same group as the colour markers with a similar intensity. The k nearest neighbours assign a value of “a” and “b” for each marker and, therefore, it is possible to classify each pixel of the image so as to calculate the Euclidean distance between pixels and colour markers. On the other hand, unsupervised methods for colour segmentation techniques use clustering algorithms, which essentially perform the same functions as the classifying methods, but without using data training [66,67]. In order to compensate for the lack of data training, clustering methods iterate between image segmentation and char- acterize the properties of each class. In this sense, clus- tering methods are trained with the available data. The basic idea is to assume that image pixels are points in a three dimensional space (RGB). Therefore, the points of a region of similar colour are grouped together. Cluster- ing techniques allow us to obtain a representative point of each group, based on measures of similarity or dis- tance between these po ints. In this algorithm, a point xi is assigned to a group R, whose centroid C is closer to it. The Euclidean distance is usually used as a measure for the similarity between the point and the centroid. The results of this classification are normally expressed in terms of the total percentage of pixels coloured in each object. Thanks to these results, fruits can be classified according to their level of maturity (Table 2). In the case of the determination of external defects, the skeleton is added to the original image of infrared and marks the position of the defects in the original image. To that end, we have a gradient-based segmentation of grey levels, which indicates that the values with the highest values of pixels represent the area of pixel de- fects and the lowest values represent the healthy areas of the fruit. This allows us to measure some geometric properties of the defects, specifically, the defect area in each olive. Table 2. Olive classification based on olive skin. Class Olive skin colour 0 >50% bright green 1 >50% green-yellowish 2 %green-yellowish with black and/or reddish spots >% reddish-bro wn 3 %green-yellowish with black and/or reddish spots <% reddish-bro wn 4 100% blackish purple or black Copyright © 2013 SciRes. FNS 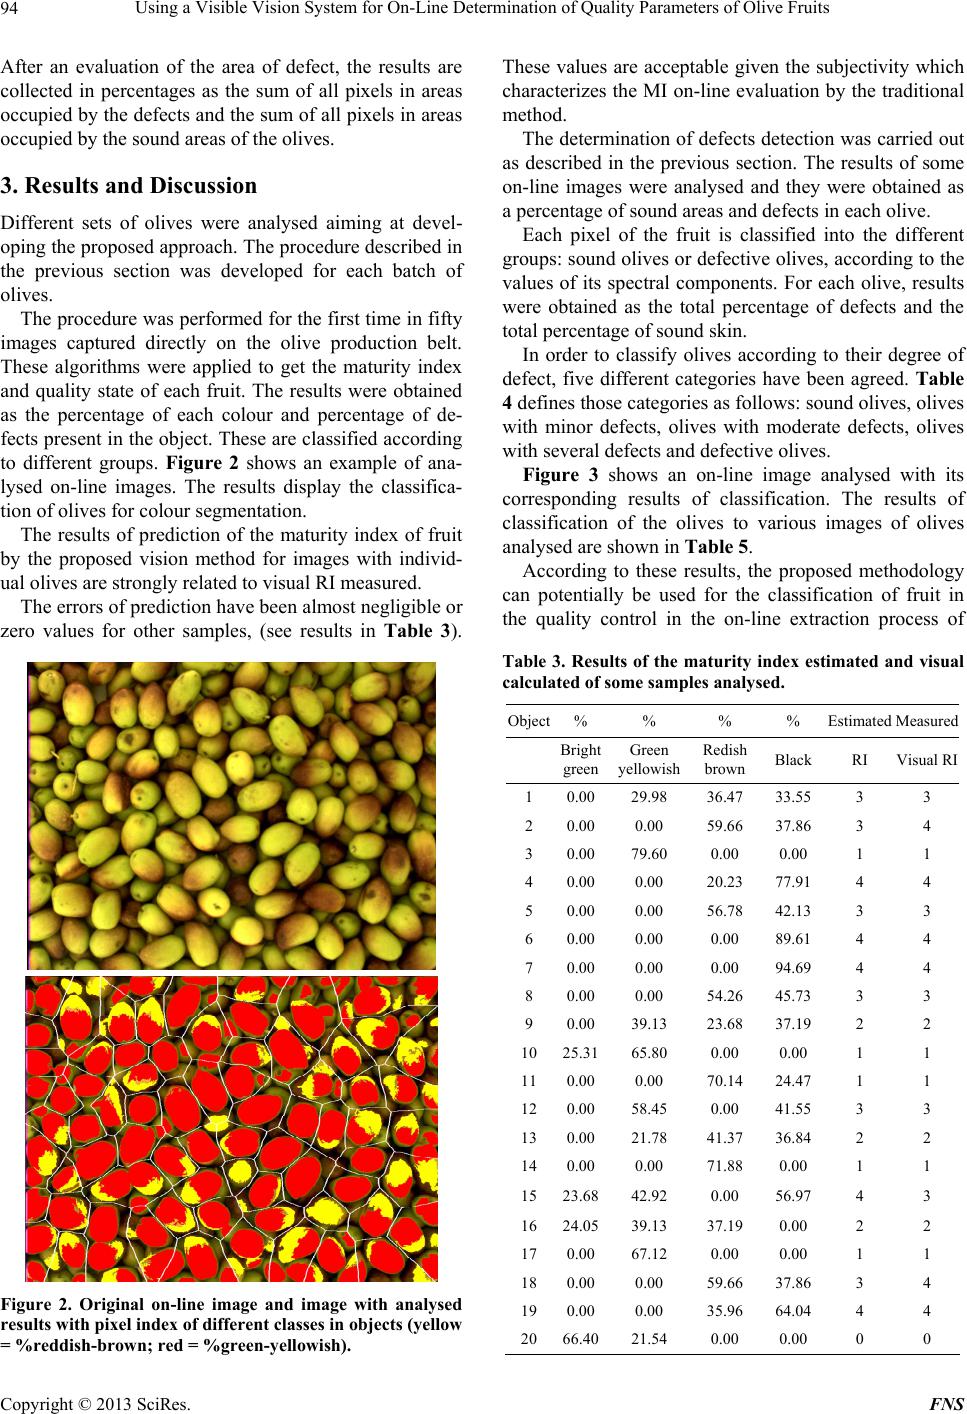 Using a Visible Vision System for On-Line Determination of Quality Parameters of Olive Fruits 94 After an evaluation of the area of defect, the results are collected in percentages as the sum of all pixels in areas occupied by the defects and the sum of all pixels in areas occupied by the sound areas of the olives. 3. Results and Discussion Different sets of olives were analysed aiming at devel- oping the proposed approach. The procedure described in the previous section was developed for each batch of olives. The procedure was performed for the first time in fifty images captured directly on the olive production belt. These algorithms were applied to get the maturity index and quality state of each fruit. The results were obtained as the percentage of each colour and percentage of de- fects present in the object. These are classified according to different groups. Figure 2 shows an example of ana- lysed on-line images. The results display the classifica- tion of olives for colour segmentation. The results of prediction of the maturity index of fruit by the proposed vision method for images with individ- ual olives are strongly related to visual RI measured. The errors of prediction have been almost negligible or zero values for other samples, (see results in Table 3). Figure 2. Original on-line image and image with analysed results with pixel index of different classes in objects (yellow = %reddish-brown; red = %green-yellowish). These values are acceptable given the subjectivity which characterizes the MI on-line evaluation by the tradition al method. The determination of defects detection was carried out as described in the previous section. The results of some on-line images were analysed and they were obtained as a percentage of sound areas and defects in each olive. Each pixel of the fruit is classified into the different groups: sound olives or defective olives, according to the values of its spectral components. For each olive, results were obtained as the total percentage of defects and the total percentage of sound skin. In order to classify olives according to their degree of defect, five different categories have been agreed. Table 4 defines those categories as follows: sound olives, olives with minor defects, olives with moderate defects, olives with several defects and defective olives. Figure 3 shows an on-line image analysed with its corresponding results of classification. The results of classification of the olives to various images of olives analysed are shown in Table 5. According to these results, the proposed methodology can potentially be used for the classification of fruit in the quality control in the on-line extraction process of Table 3. Results of the maturity index estimated and visual calculated of some samples analyse d. Object% % % % EstimatedMeasured Bright green Green yellowish Redish brown Black RI Visual RI 1 0.0029.98 36.47 33.55 3 3 2 0.000.00 59.66 37.86 3 4 3 0.0079.60 0.00 0.00 1 1 4 0.000.00 20.23 77.91 4 4 5 0.000.00 56.78 42.13 3 3 6 0.000.00 0.00 89.61 4 4 7 0.000.00 0.00 94.69 4 4 8 0.000.00 54.26 45.73 3 3 9 0.0039.13 23.68 37.19 2 2 1025.3165.80 0.00 0.00 1 1 110.000.00 70.14 24.47 1 1 120.0058.45 0.00 41.55 3 3 130.0021.78 41.37 36.84 2 2 140.000.00 71.88 0.00 1 1 1523.6842.92 0.00 56.97 4 3 1624.0539.13 37.19 0.00 2 2 170.0067.12 0.00 0.00 1 1 180.000.00 59.66 37.86 3 4 190.000.00 35.96 64.04 4 4 2066.4021.54 0.00 0.00 0 0 Copyright © 2013 SciRes. FNS 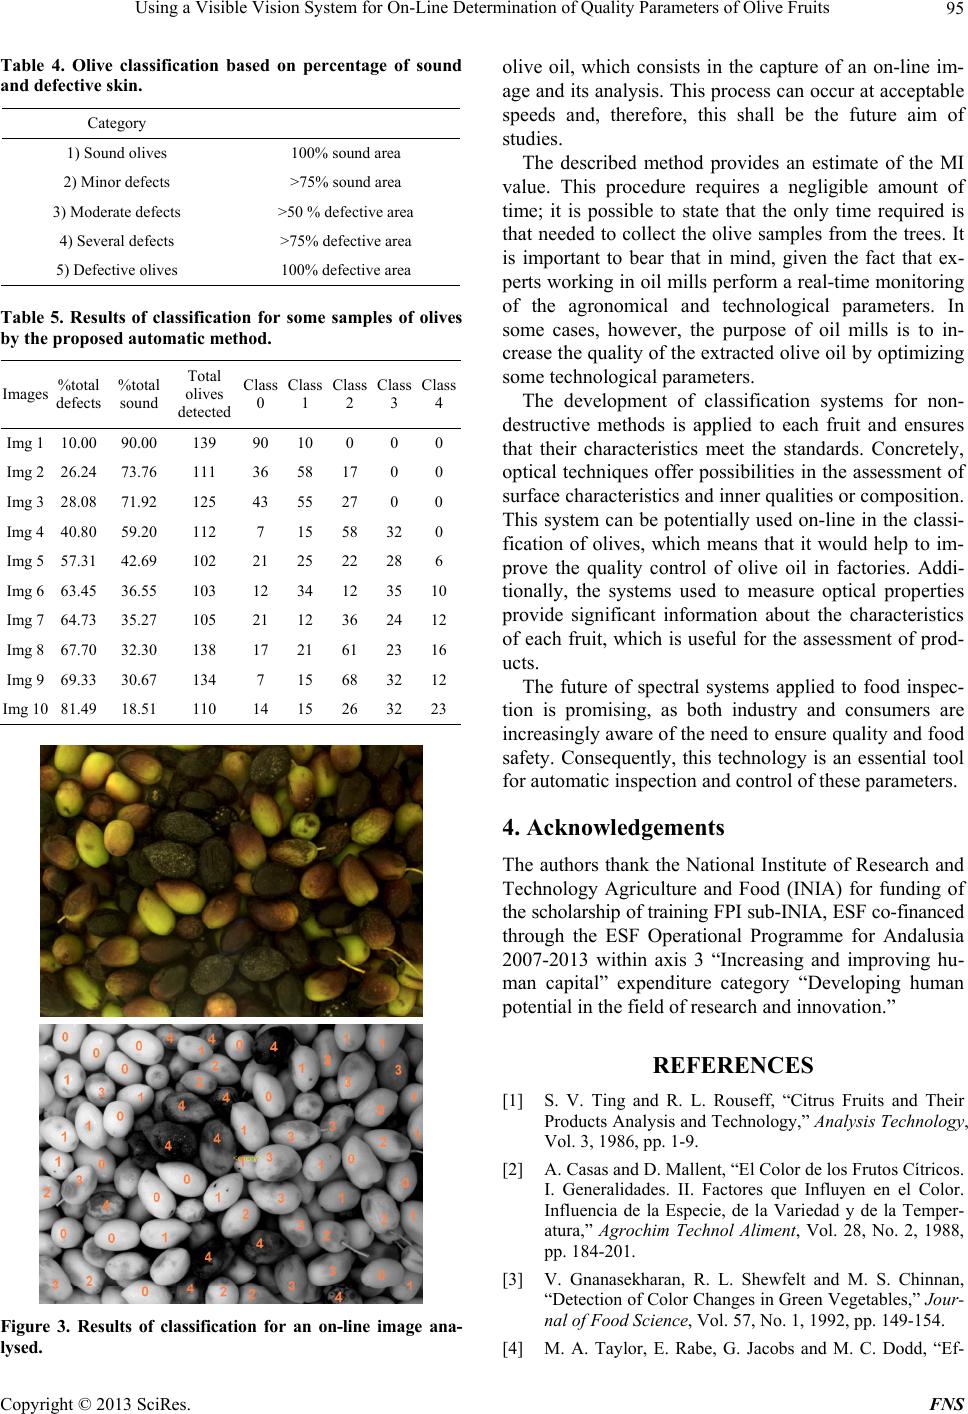 Using a Visible Vision System for On-Line Determination of Quality Parameters of Olive Fruits 95 Table 4. Olive classification based on percentage of sound and defective skin. Category 1) Sound olives 100% sound area 2) Minor defects >75% sound area 3) Moderate defects >50 % defective area 4) Several defects >75% defective area 5) Defective olives 100% defective area Table 5. Results of classification for some samples of olives by the proposed automatic method. Images %total defects %total sound Total olives detected Class 0 Class 1 Class 2 Class 3 Class 4 Img 1 10.00 90.00 139 90 10 0 0 0 Img 2 26.24 73.76 111 36 58 17 0 0 Img 3 28.08 71.92 125 43 55 27 0 0 Img 4 40.80 59.20 112 7 15 58 320 Img 5 57.31 42.69 102 21 25 22 286 Img 6 63.45 36.55 103 12 34 12 3510 Img 7 64.73 35.27 105 21 12 36 2412 Img 8 67.70 32.30 138 17 21 61 2316 Img 9 69.33 30.67 134 7 15 68 3212 Img 10 81.49 18.51 110 14 15 26 3223 Figure 3. Results of classification for an on-line image ana- lysed. olive oil, which consists in the capture of an on-line im- age and its analysis. This process can occur at acceptable speeds and, therefore, this shall be the future aim of studies. The described method provides an estimate of the MI value. This procedure requires a negligible amount of time; it is possible to state that the only time required is that needed to collect the olive samples from the trees. It is important to bear that in mind, given the fact that ex- perts working in oil mills perform a real-time monitoring of the agronomical and technological parameters. In some cases, however, the purpose of oil mills is to in- crease the quality of the extracted olive oil by optimizin g some technological parameters. The development of classification systems for non- destructive methods is applied to each fruit and ensures that their characteristics meet the standards. Concretely, optical techniques offer possibilities in the assessment of surface characteristics and inner qualities or composition. This system can be potentially used on-line in the classi- fication of olives, which means that it would help to im- prove the quality control of olive oil in factories. Addi- tionally, the systems used to measure optical properties provide significant information about the characteristics of each fruit, which is useful for the assessment of prod- ucts. The future of spectral systems applied to food inspec- tion is promising, as both industry and consumers are increasingly aware of the need to en sure quality and fo od safety. Consequently, this technology is an essential tool for automatic inspection and control of these parameters. 4. Acknowledgements The authors thank the National Institute of Research and Technology Agriculture and Food (INIA) for funding of the scholarship of training FPI sub-INIA, ESF co-financed through the ESF Operational Programme for Andalusia 2007-2013 within axis 3 “Increasing and improving hu- man capital” expenditure category “Developing human potential in the field of research and innovation.” REFERENCES [1] S. V. Ting and R. L. Rouseff, “Citrus Fruits and Their Products Analysis and Technology,” Analysis Technology, Vol. 3, 1986, pp. 1-9. [2] A. Casas and D. Mallent, “El Color de los Frutos Cítricos. I. Generalidades. II. Factores que Influyen en el Color. Influencia de la Especie, de la Variedad y de la Temper- atura,” Agrochim Technol Aliment, Vol. 28, No. 2, 1988, pp. 184-201. [3] V. Gnanasekharan, R. L. Shewfelt and M. S. Chinnan, “Detection of Color Changes in Green Vegetables,” Jour- nal of Food Science, Vol. 57, No. 1, 1992, pp. 149-154. [4] M. A. Taylor, E. Rabe, G. Jacobs and M. C. Dodd, “Ef- Copyright © 2013 SciRes. FNS  Using a Visible Vision System for On-Line Determination of Quality Parameters of Olive Fruits 96 fect of Harvest Maturity on Pectic Substances, Internal Conductivity, Soluble Solids and Gel Breakdown in Cold Stored ‘Songold’ Plums,” Postharvest Biology and Tech- nology, Vol. 5, No. 4, 1995, pp. 285-294. doi:10.1016/0925-5214(94)00040-Y [5] L. Lehman-Salada, “Intruments and Operator Effects on Apple Firmness Readings,” HortScience, Vol. 31, No. 6, 1996, pp. 994-997. [6] M. V. Mickelbart and D. James, “Development of a Dry Matter Maturity Index for Olive (Olea europaea),” New Zealand Journal of Crop and Horticultural Science, Vol. 31, No. 3, 2006, pp. 269-276. doi:10.1080/01140671.2003.9514261 [7] A. Ranalli, A. Tombesi, M. L. Ferrante and G. de Mattia, “Influence of Potato Composition on Chip Color Qual- ity,” Revita delle Sostanze Grasse, Vol. 74, No. 2, 1997, pp. 553-557. [8] R. Lu and Y. R. Chen, “Hyperspectral Imaging for Safety Inspection of Food and Agricultural Products,” SPIE Proceedings, Vol. 3544, 1998, pp. 121-133. doi:10.1117/12.335771 [9] M. Olmo, A. Nadas and J. M. García, “Nondestructive Methods to Evaluate Maturity Level of Oranges,” Journal of Food Science, Vol. 65, No. 2, 2000, pp. 365-369. doi:10.1111/j.1365-2621.2000.tb16008.x [10] J. M. García, R. J. Medina and J. M. Olías, “Influence of Fruit Ripening on Olive Oil Quality,” Journal of Food Science, Vol. 63, No. 6, 1998, pp. 1037-1041. [11] N. Muramatsu, N. Sakurai, R. Yamamoto and D. J. Ne- vins, “Nondestructive Acoustic Measurement of Firm- ness for Nectarines, Apricots, Plums, and Tomatoes,” HortSciences, Vol. 31, No. 7, 1996, pp. 1199-1202. [12] J. M. García, S. Seller and M. C. Pérez-Camino, “Influ- ence of Fruit Ripening on Olive Oil Quality,” Journal of Agricultural and Food Chemistry, Vol. 44, No. 11, 1996, pp. 3516-3520. doi:10.1021/jf950585u [13] M. Uceda and L. Frias, “Harvest Dates. Evolution of the Fruit Oil Content, Oil Composition and Oil Quality,” Proceedings of the II Seminario Oleícola Internacional, International Olive Oil Council, Cordoba, 1975, pp. 125- 130. [14] M. J. Tovar, M. P. Romero, S. Alegre, J. Girona and M. J. Motilva, “Composition and Organoleptic Characteristics of Oil from Arbequina Olive (Olea europaea L.) Trees under Deficit Irrigation,” Journal of the Science of Food and Agriculture, Vol. 82, No. 15, 2002, pp. 1755-1763. doi:10.1002/jsfa.1246 [15] M. J. Ayora-Caña da, B. Muik, J. A. García-Mesa, D. Or- tega-Calderón and A. Molina-Diaz, “Fourier-Transform Near-Infrared Spectroscopy as a Tool for Olive Fruit Classification and Quantitative Analysis,” Spectroscopy Letters, Vol. 38, No. 6, 2005, pp. 769-785. [16] J. A. Cayuela, J. M. Garcia and N. Caliani, “NIR Pre- diction of Fruit Moisture, Free Acidity and Oil Content in Intact Olives,” Grasas y Aceites, Vol. 60, No. 2, 2009, pp. 194-202. [17] J. A. Cayuela and M. D. P. Camino, “Prediction of Qual- ity of Intact Olives by Near Infrared Spectroscopy,” European Journal of Lipid Science and Technology, Vol. 112, No. 11, 2010, pp. 1209-1217. [18] L. Leon, L. Rallo and A. Garrido, “Near-Infrared Spec- troscopy (NIRS) Analysis of Intact Olive Fruit: An Use- ful Tool in Olive Breeding Programs,” Grasas y Aceites, Vol. 54, No. 1, 2003, pp. 41-47. [19] A. Bendini, L. Cerretani, F. Di Virgilo, P. Belloni, M. Boloni-Carbognin and G. Lercker, “Preliminary Evalua- tion of the Application of the FTIR Spectroscopy to Con- trol the Geographic Origin and Quality of Virgin Olive Oils,” Journal of Food Quality, Vol. 30, No. 4, 2007, pp. 424-437. [20] R. Korifi, Y. Le Dreau, J. Molinet, J. Artaud and N. Dupuy, “Composition and Authentication of Virgin Olive Oil from French PDO Regions by Chemometric Treat- ment of Raman Spectra,” Journal of Raman Spectroscopy, Vol. 42, No. 7, 2011, pp. 1540-1547. [21] Y. Dellaa, R. Korifi, Y. Le Dreau, J. Artaud and N. Dupuy, “Prediction of Geographical Origin of Virgin Olive Oil RDOs by Chemometric Treatment of Raman Spectra,” XXII International Conference on Raman Spec- troscopy, AIP Conference Proceedings, Vol. 1267, 2010, pp. 562-563. [22] X. F. Zhang, X. H. Qi, M. Q. Zou and F. Liu, “Rapid Authentication of Olive Oil by Raman Spectroscopy Us- ing Principal Component,” Analysis Analytical Letters, Vol. 44, No. 12, 2011, pp. 2209-2220. [23] R. M. El-Abassy, P. Donfack and A. Materny, “Visible Raman Spectroscopy for the Discrimination of Olive Oils from Different Vegetable Oils and the Detection of Adul- teration,” Journal of Raman Spectroscopy, Vol. 40, No. 9, 2009, pp. 1284-1289. [24] M. Q. Zou, X. F. Zhang, X. H. Qi, H. L. Ma, Y. Dong, C. W. Liu, X. Guo and H. Wang, “Rapid Authentication of Olive Oil Adulteration by Raman Spectrometry,” Journal of Agricultural and Food Chemistry, Vol. 57, No. 14, 2009, pp. 6001-6006. [25] R. M. El-Abassy, P. Donfack and A. Materny, “Assess- ment of Conventional and Microwave Heating Induced Degradation of Carotenoids in Olive Oil by VIS Raman Spectroscopy and Classical Methods,” Food Research International, Vol. 43, No. 3, 2010, pp. 694-700. [26] R. M. El-Abassy, P. Donfack and A. Materny, “Rapid Determination of Free Fatty Acid in Extra Virgin Olive Oil by Raman Spectroscopy and Multivariate Analysis,” Journal of the American Oil Chemists Society, Vol. 86, No. 6, 2099, pp. 507-511. [27] B. Muik, B. Lendl, A. Molina-Diaz and M. J. Ayora- Canada, “Direct, Reagent-Free Determination of Free Fat- ty Acid Content in Olive Oil and Olives by Fourier Trans- form Raman Spectrometry,” Analytica Chimica Acta, Vol. 487, No. 2, 2003, pp. 211-220. [28] F. Paiva-Martins, V. Rodriguez, R. Calheiros and M. P. M. Marques, “Characterization of Antioxidant Olive Oil Biophenols by Spectroscopic Methods,” Journal of the Science of Food and Agriculture, Vol. 91, No. 2, 2011, pp. 309-314. [29] B. Muik, B. Lendl, A. Molina-Diaz, D. Ortega-Calderon and M. J. Ayora-Canada, “Discrimination of Olives Ac- cording to Fruit Quality Using Fourier Transform Raman Copyright © 2013 SciRes. FNS  Using a Visible Vision System for On-Line Determination of Quality Parameters of Olive Fruits 97 Spectroscopy and Pattern Recognition Techniques,” Jour- nal of Agricultural and Food Chemistry, Vol. 52, No. 20, 2004, pp. 6055-6060. [30] P. Amirante, G. C. Di Rienzo, L. Di Giovacchino, B. Bianchi and P. Catalano, “Evoluzione Tecnologica De- gliimpianti di Estrazione Dell’Olio di Oliva,” Olivae, Vol. 48, 1993, pp. 43-53. [31] P. Amirante and P. Catalano, “Analisi Teorica e Speri- mentale Dell’Estrazione Dell’Olio d’Oliva per Centri- fugazione,” Rivista Italiana delle Sostanze Grasse, Vol. LXX, 1993, pp. 329-335. [32] P. Catalano, E. Cini and F. Sarghini, “Applicazione di Modelli Nell’Agroindustria per la Ricerca e la Gestione- dei Sistemi Produttivi,” Proceedings of Innovazione delle Macchine e Degli Impianti Nel Settore Agroalimentare per Un’Agricoltura Multifunzionale nel Rispetto Dell’Am- biente, Anacapri, 5-6 June 2006. [33] R. Furferi, M. Carfagni and M. Daou, “Artificial Neural Network Software for Real-Time Estimation of Olive Oilqualitative Parameters during Continuous Extraction,” Computers and Electronics in Agriculture, Vol. 55, No. 2, 2007, pp. 115-131. doi:10.1016/j.compag.2006.12.006 [34] E. Cini, M. Daou, R. Furferi and L. Recchia, “A Mo- delling Approach to Extra Virgin Olive Oil Extraction,” Journal of Agricultural Engineering, Vol. 38, No. 4, 2007, pp. 1-10. [35] C. Bordons and A. Nunez-Reyes, “Model Based Predic- tive Control of an Olive Oil Mil,” Journal of Food En- gineering, Vol. 84, No. 1, 2008, pp. 1-11. doi:10.1016/j.jfoodeng.2007.04.011 [36] J. A. Molina and M. I. Pascual, “Using Optical NIR Sen- sor for On-Line Virgin Olive Oils Characterization,” Sen- sors and Actuators B: Chemical, Vol. 107, No. 1, 2005, pp. 64-68. doi:10.1016/j.snb.2004.11.103 [37] A. J. Marquez and A. M. Díaz, “Using Optical Sensor for On-Line Virgin Olive Oil Characterization,” Sensors and Actuators B: Chemical, Vol. 107, No. 1, 2005, pp. 64-68. [38] A. J. Márquez, “Monitoring Carotenoid and Chlorophyll Pigments in Virgin Olive Oil by Visible-Near Infrared Transmittance Spectroscopy. On-Line Application,” Jour- nal of Near Infrared Spectroscopy, Vol. 11, No. 1, 2003, p. 219. [39] M. Hermoso, M. Uceda, A. Garcia-ortiz, A. Jimenez and G. Beltran, “Preliminary Results of Nir ‘On-Line’ Meas- ure of Oil Content and Humidity in Olive Cakes from the Two Phases Decanter,” Sensors and Actuators B: Chem- ical, Vol. 129, 2008, pp. 985-990. [40] D.-W. Sun, “Inspecting Pizza Topping Percentage and Distribution by a Computer Vision Method,” Journal of Food Engineering, Vol. 44, No. 4, 2000, pp. 245-249. doi:10.1016/S0260-8774(00)00024-8 [41] S. Cordero, L. Lleo, P. Barreiro and M. Ruiz-Altisent, “Peach Multispectral Images Related to Firmness and Maturity,” World Congress: Agricultural Engineering for a Better World, Bonn, 3-7 September 2006, p. 583. [42] J. Blasco, N. Aleixos and E. Molto, “Computer Vision Detection of Peel Defects in Citrus by Means of a Region Oriented Segmentation Algorithm,” Journal of Food En- gineering, Vol. 81, No. 3, 2007, pp. 535-543. doi:10.1016/j.jfoodeng.2006.12.007 [43] N. Kondo, U. Ahmad, M. Monta and H. Murasc, “Ma- chine Vision Based Quality Evaluation of Iyokan Orange Fruit Using Neural Networks,” Computers and Electro- nics in Agriculture, Vol. 29, No. 1-2, 2000, pp. 135-147. doi:10.1016/S0168-1699(00)00141-1 [44] C. Rosenberger, B. Emile and H. Laurent, “Calibration and Quality Control of Cherries by Artificial Visión,” Journal of Electronical Imaging, Vol. 13, No. 3, 2004, pp. 539-546. doi:10.1117/1.1760082 [45] P. Uthaisombut, “Detecting Defects in Cherries Using Machine Vision,” M.S. Thesis, Computer Science, Michi- gan State University, East Lansing, 2004. [46] X. Cheng, Y. Tao, Y. R. Chen and Y. Luo, “NIR/MIR Dual-Sensor Machine Vision System for Online Apple Stem-End/Calyx Recognition,” Transactions of ASAE, Vol. 46, No. 2, 2003, pp. 551-558. [47] I. Kavdir and D. E. Guyer, “Comparison of Artificial Neural Networks and Statistical Classifiers in Apple Sorting Using Textural Features,” Biosystem Engineerin, No. 89, No, 3, 2004, pp. 331-344. doi:10.1016/j.biosystemseng.2004.08.008 [48] P. M. Mehl, Y. R. Chen, M. S. Kim and D. E. Chan, “De- velopment of Hyperspectral Imaging Technique for the Detection of Apple Surface Defects and Contaminations,” Journal Food Engineering, Vol. 61, No. 1, 2004, pp. 67- 81. doi:10.1016/S0260-8774(03)00188-2 [49] T. Brosnan and D. W. Sun, “Improving Quality Inspec- tion of Food Products by Computer Vision—A Review,” Journal of Food Engineering, Vol. 61, No. 1, 2004, pp. 3- 16. doi:10.1016/S0260-8774(03)00183-3 [50] F. Pla, J. S. Sanchez and J. M. Sanchiz, “On-Line Ma- chine Vision System for Fast Fruit Colour Sorting Using Low-Cost Architecture,” In: VIII SPIE Conference on Machine Vision Systems for Inspection and Metrology, Boston, 27 August 1999, pp. 277-286. doi:10.1117/12.360279 [51] F. Mendoza and J. M. Aguilera, “Application of Image Analysis for Classification of Ripening Bananas,” Jour- nal of Food Science, Vol. 69, No. 9, 2004, pp. 471-477. doi:10.1111/j.1365-2621.2004.tb09932.x [52] R. Oberti, R. Guidetti and I. Mignani, “Analisi multi- spettrale di Immagini per l’Individuazione Precoce Di danni Meccanici Su Prodotti ortofrutticoli: Un’Applica- zione su Pere Decana,” Rivista di Ingegneria Agraria, Vol. 30, No. 3, 2004, pp. 137-147. [53] G. Peri, R. Romaniello, M. Amodio and G. Colelli, “The Application of a Fast Colour Quantization Algorithm for Sorting Peaches for firmness,” In: XXX CIOSTACGIR V CONFERENCE, Torino, 2003. [54] M. Z. Abdullah, J. Mohamad-Saleh, A. S. Fathinul-Syahir and B. M. N. Mohd-Azemi, “Discrimination and Classifi- cation of Fresh-Cut Starfruits (Averrhoa Carambola L.) Using Automated Machine Vision System,” Journal of Food Engineering, Vol. 76, No. 4, 2006, pp. 506-523. doi:10.1016/j.jfoodeng.2005.05.053 [55] A. B. Koc, “Determination of Watermelon Volume Using Ellipsoid Approximation and Image Processing,” Post- Copyright © 2013 SciRes. FNS  Using a Visible Vision System for On-Line Determination of Quality Parameters of Olive Fruits Copyright © 2013 SciRes. FNS 98 harvest Biology and Technology, Vol. 45, No. 1, 2007, pp. 366-371. doi:10.1016/j.postharvbio.2007.03.010 [56] D. Stajnko and Z. Cmelik, “Modelling of Apple Fruit Growth by Application of Image Analysis,” Agriculturae Conspectus Scientificus, Vol. 70, No. 1, 2005, pp. 59-64. [57] L. Bodria, M. Fiala, R. Guidetti and R. Oberti, “Optical Techniques for Assessing the Fruit Maturity Stage,” In: ASAE Annual International Meeting/CIGR XVth World Congress, Chicago, 2005. [58] T. S. Y. Choong, S. Abbas, A. R. Shariff, R. Halim, M. H. S. Ismail, R. Yunus, A. Salmiaton and A. Fakhrul-Razi, “Digital Image Processing of Palm Oil Fruits. Interna- tional,” Journal of Food Engineering, Vol. 2, No. 2, 2006, p. 7. [59] E. Guzmán, V. Baeten, J. A. Fernández Pierna and J. A. García Mesa, “A Portable Raman Sensor for the Rapid Discrimination of Olives According to Fruit Quality,” Talanta, Vol. 93, 2012, pp. 94-98. doi:10.1016/j.talanta.2012.01.053 [60] J. M. García, F. Gutiérrez, M. J. Barrera and M. A. Albi, “Influence of Fruit Ripening on Olive Oil Quality,” Jour- nal of Agricultural and Food Chemistry, Vol. 44, No. 2, 1996, pp. 590-593. doi:10.1021/jf950479s [61] G. Medioni, M.-S. Lee and C.-K. Tang, “A Computa- tional Framework for Segmentation and Grouping,” El- sevier Science B.V., Amsterdam, 2000. [62] K. N. Plataniotis and A. N. Venetsanopuolos, “Color Ima- ge Processing and Applications,” Springer Verlag, Berlin, 2000. doi:10.1007/978-3-662-04186-4 [63] V. Chang and J. Saavedra, “Métodos Alternativos Para el Mejoramiento Automático del Contraste de Imágenes,” Computer Engineering thesis, School of Informatics, Uni- versity National of Trujillo, Trujillo, 2001. [64] J. C. Russ, “The Image Processing Handbook,” 3rd Edi- tion, CRC Press, USA, 1998. [65] J. A. Richards, “Remote Sensing Digital Image Analy- sis,” Springer-Verlag, Berlin, 1999. [66] S. W. Thomas, “Efficient Inverse Color Map Computa- tion,” In: J. Arvo, Ed., Graphics Gems II, Academic Press, Boston, 1991, pp. 116-125. [67] R. W. Floyd and L. Steinberg, “An Adaptive Algorithm for Spatial Grey Scale,” In: International Symposium Di- gest of Technical Papers, Society for Information Dis- plays, 1975, pp. 36-37.
|