 Energy and Power Engineering, 2013, 5, 352-362 http://dx.doi.org/10.4236/epe.2013.55036 Published Online July 2013 (http://www.scirp.org/journal/epe) A Financial Approach to Evaluate an Optimized Combined Cooling, Heat and Power System Shahab Bahrami*, Farahbakhsh Safe Electrical Engineering Department, Sharif University of Technology, Tehran, Iran Email: *shahab_bahrami@yahoo.com Received January 7, 2013; revised February 8, 2013; accepted February 16, 2013 Copyright © 2013 Shahab Bahrami, Farahbakhsh Safe. This is an open access article distributed under the Creative Commons Attri- bution License, which permits unrestricted use, distribution, and reproduction in any medium, provided the original work is properly cited. ABSTRACT Iran’s removing subsidy from energy carrier in four years ago leads to spike electricity price dramatically. This abrupt change increases the interest on distributed generation (DG) because of its several benefits such as lower electricity generation price. In Iran among all type of DGs, because of wide natural gas network infrastructure and several incen- tives that government legislated to support combined cooling, heat and power (CCHP) investors, this type of technology is more prevalent in comparison with other technologies. Between existing CCHP technologies, certain economic choices are to be taken into account. For different buildings with different load curves, suitable size and operation of CCHP should be calculated to make the project more feasible. If CCHP does not well suited for a position, then the whole energy efficiency would be plunged significantly. In this paper, a model to find the optimal size and operation of CCHP and auxiliary boiler for any users is proposed by considering an integrated view of electricity and natural gas network using GAMS software. Then this method is applying for a hospital in Tehran as a real case study. Finally, by applying COMFAR III software, useful financial parameters and sensitivity analysis are calculated. Keywords: Combined Cooling Heat and Power (CCHP); Energy Hub; Optimal Size; Financial Analysis 1. Introduction The development of poly-generation smart grids repre- sents an interesting solution to satisfy electricity and heat demand and emission reduction [1,2]: poly-generation smart grids generate electricity, heating and cooling thermal power close to end users, solving the main dis- advantages of the centralized generation approach, due to energy transmission [3]. In fact, the distributed genera- tion approach has several benefits over the others, such as: 1) reduction of transmission and distribution costs: about the 30% of the costs related to electricity supply relates to these costs. Local connections do not generate high capital costs and energy losses for long distances to be wired with overhead facilities; 2) decrease of energy dissipation: piping and conversion devices dissipate al- most 6% of produced energy, [4] increasing costs and emissions; in a smart grid, these kinds of losses are avoided; 3) increase of energy efficiency: the simultane- ous supply of electrical and thermal demand allow to reduce energy waste, improving system global efficiency; since thermal energy is less easily transported than elec- tricity, distributed generation approach (production close to users) is essential. Because of mentioned benefits de- regulation has evolved in all three sectors of the power system (i.e. generation, transmission, and distribution) from centralized to a decentralized status. One of the main concepts in deregulation is Microgrids which are used at the distribution level [1]. Microgrid, with its de- centralized electricity generation, combined with on site production of heat, could provide reliable and electric power as well as heat and cooling to its consumers at an economic cost. Nowadays, following the expansion of natural gas networks and also benefits of this energy car- rier such as lower emission level and prices, CCHP technologies have attained unprecedented level of popu- larity as one of the most important distributed energy resources. The US Environmental Protection Agency (EPA) found that the primary applications for CHP in the commercial sectors are those building types with rela- tively high and coincident electric and hot water demands such as hotels, universities and hospitals. Use of CHP thermal output for absorption cooling could increase the efficiency of CHP system in commercial sectors, this integrated system which provides these demands named *Corresponding a uthor. C opyright © 2013 SciRes. EPE 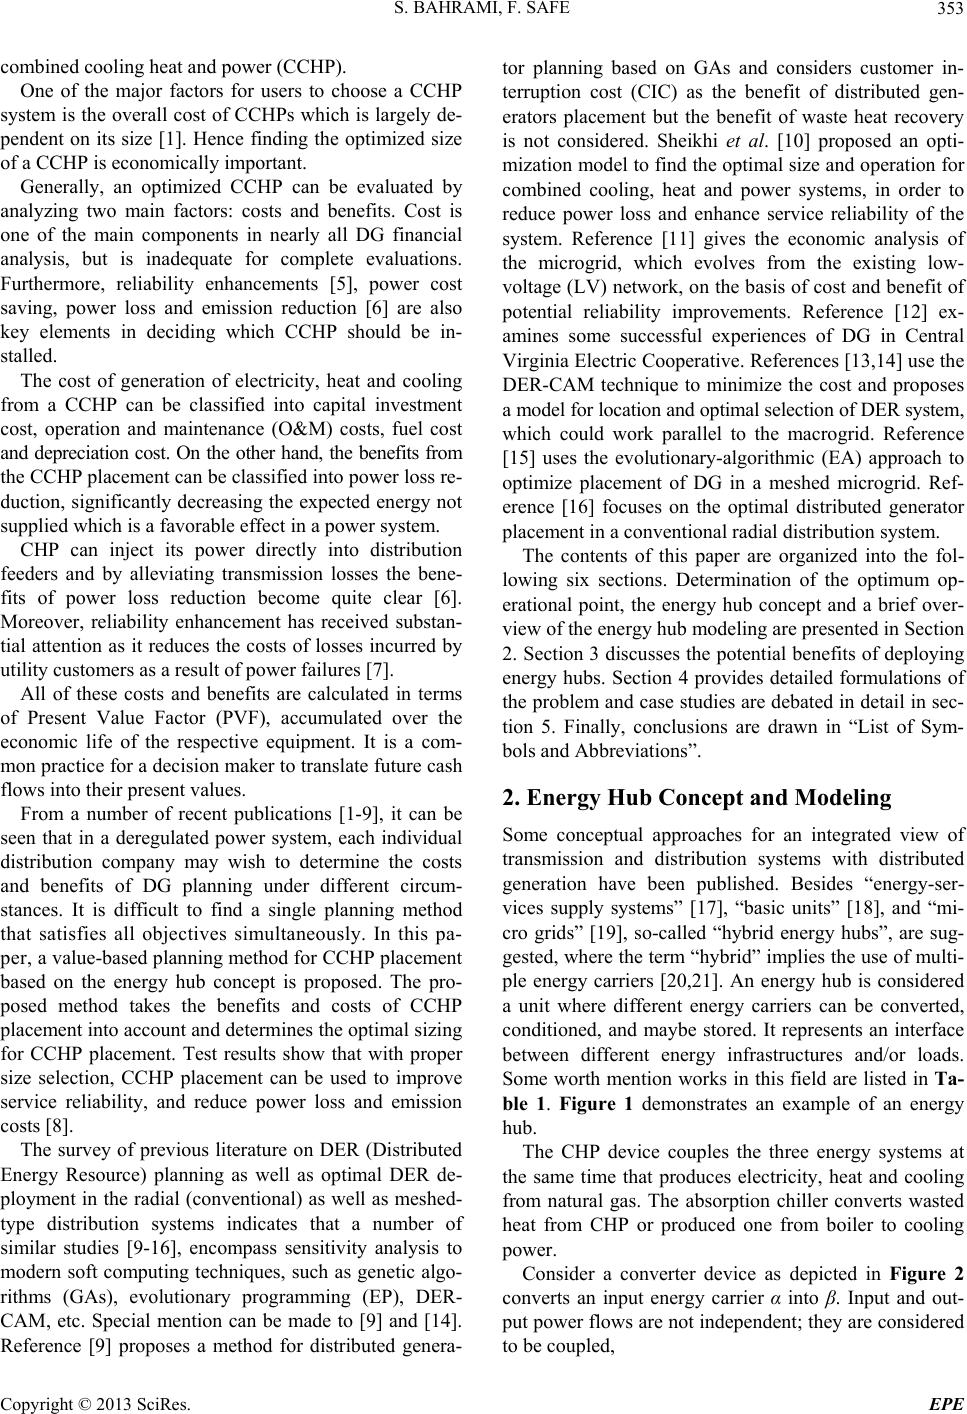 S. BAHRAMI, F. SAFE 353 combined cooling heat and power (CCHP). One of the major factors for users to choose a CCHP system is the overall cost of CCHPs which is largely de- pendent on its size [1]. Hence finding the optimized size of a CCHP is economically important. Generally, an optimized CCHP can be evaluated by analyzing two main factors: costs and benefits. Cost is one of the main components in nearly all DG financial analysis, but is inadequate for complete evaluations. Furthermore, reliability enhancements [5], power cost saving, power loss and emission reduction [6] are also key elements in deciding which CCHP should be in- stalled. The cost of generation of electricity, heat and cooling from a CCHP can be classified into capital investment cost, operation and maintenance (O&M) costs, fuel cost and depreciation cost. On the other hand, the benefits from the CCHP placement can be classified into power loss re- duction, significantly decreasing the expected energy not supplied which is a favorable effect in a power system. CHP can inject its power directly into distribution feeders and by alleviating transmission losses the bene- fits of power loss reduction become quite clear [6]. Moreover, reliability enhancement has received substan- tial attention as it reduces the costs of losses incurred by utility customers as a result of power failures [7]. All of these costs and benefits are calculated in terms of Present Value Factor (PVF), accumulated over the economic life of the respective equipment. It is a com- mon practice for a decision maker to translate future cash flows into their present values. From a number of recent publications [1-9], it can be seen that in a deregulated power system, each individual distribution company may wish to determine the costs and benefits of DG planning under different circum- stances. It is difficult to find a single planning method that satisfies all objectives simultaneously. In this pa- pe r , a value-based planning method for CCHP placement based on the energy hub concept is proposed. The pro- posed method takes the benefits and costs of CCHP placement into account and determines the optimal sizing for CCHP placement. Test results show that with proper size selection, CCHP placement can be used to improve service reliability, and reduce power loss and emission costs [8]. The survey of previous literature on DER (Distributed Energy Resource) planning as well as optimal DER de- ployment in the radial (conventional) as well as meshed- type distribution systems indicates that a number of similar studies [9-16], encompass sensitivity analysis to modern soft computing techniques, such as genetic algo- rithms (GAs), evolutionary programming (EP), DER- CAM, etc. Special mention can be made to [9] and [14]. Reference [9] proposes a method for distributed genera- tor planning based on GAs and considers customer in- terruption cost (CIC) as the benefit of distributed gen- erators placement but the benefit of waste heat recovery is not considered. Sheikhi et al. [10] proposed an opti- mization model to find the optimal size and operation for combined cooling, heat and power systems, in order to reduce power loss and enhance service reliability of the system. Reference [11] gives the economic analysis of the microgrid, which evolves from the existing low- voltage (LV) network, on the basis of cost and benefit of potential reliability improvements. Reference [12] ex- amines some successful experiences of DG in Central Virginia Electric Cooperative. References [13,14] use the DER-CAM technique to minimize the cost and proposes a model for location and optimal selection of DER system, which could work parallel to the macrogrid. Reference [15] uses the evolutionary-algorithmic (EA) approach to optimize placement of DG in a meshed microgrid. Ref- erence [16] focuses on the optimal distributed generator placement in a conventional radial distribution system. The contents of this paper are organized into the fol- lowing six sections. Determination of the optimum op- erational point, the energy hub concept and a brief over- view of the energy hub modeling are presented in Section 2. Section 3 discusses the potential benefits of deploying energy hubs. Section 4 provides detailed formulations of the problem and case studies are debated in detail in sec- tion 5. Finally, conclusions are drawn in “List of Sym- bols and Abbreviations”. 2. Energy Hub Concept and Modeling Some conceptual approaches for an integrated view of transmission and distribution systems with distributed generation have been published. Besides “energy-ser- vices supply systems” [17], “basic units” [18], and “mi- cro grids” [19], so-called “hybrid energy hubs”, are sug- gested, where the term “hybrid” implies the use of multi- ple energy carriers [20,21]. An energy hub is considered a unit where different energy carriers can be converted, conditioned, and maybe stored. It represents an interface between different energy infrastructures and/or loads. Some worth mention works in this field are listed in Ta - ble 1. Figure 1 demonstrates an example of an energy hub. The CHP device couples the three energy systems at the same time that produces electricity, heat and cooling from natural gas. The absorption chiller converts wasted heat from CHP or produced one from boiler to cooling power. Consider a converter device as depicted in Figure 2 converts an input energy carrier α into β. Input and out- put power flows are not independent; they are considered to be coupled, Copyright © 2013 SciRes. EPE  S. BAHRAMI, F. SAFE Copyright © 2013 SciRes. EPE 354 which defines the coupling between input and output energy flow. For a simple converter device with one in- put and one output, the coupling factor corresponds to the converter’s steady state energy efficiency. Lc P (1) where Pα and Lβ are the steady state input and output energy flows respectively, cαβ is the coupling factor A general model covering all types of couplings can be stated all power inputs ,,,PP P and outputs ,,,LL L in vector form and enables the formula- tion of a multi-input, multi-output power conversion as follow [7]: CC C LP CC C LP CC C LP (2) 3. Proposed Optimization Method Investigating the best size of CCHP, auxiliary boiler, heating and electricity storage devices of an energy hub system have a substantial effect on the users’ benefits. This section proposes an analytical method to determine the most advantageous selection. Figure 1. An energy hub c ontaining an electr ic transformer, a CCHP, a boiler (B), battery and heat storage. To find the best ener gy hub elements between existing Figure 2. Model of energy converter. Table1. A summary of major works on Energy Hub (EH). Author Approach Publish year Andersson [22] A modeling framework for future e ne rgy systems 2007 Favre-Perrod [23] VoFEN (EH concept) 2005 Hemmes [24] EH concept 2006 Geidl [25] EH modeling 2007 Kopple [26] EH reliability 2012 Galus [27] PHEV in EH 2011 Kienzle [28] DSM &Uncertainty in EH 2011 Arnold [29] Renewable &MPC in EH 2011 Kraus [30] A country as EH 2011 Schuzle [31] Renewable modeling &Pricing in EH 2011 Parisio [32] A robust optimization on uncertainty environment in EH 2012 Carradore [ 33] Voltage regulation in EH 2009 Robertson [34] EH for multiple energy carrier 2009 Ramiraz-elizen do [35] Unit commitm e nt in EH 2011 Velez [36] Control strateg y for EH 2011 Chehreghani [37] Mathematica l optimization modeling of EH 2008 Syed [38] EH for plug-in hybrid fuel cell vehicle 2010 Sheikhi [1] Financial ana lysis &optimal size & operation of EH 2012 Haghifam [39] Multi objective electric distribution system expansio n planning 2009  S. BAHRAMI, F. SAFE 355 choices the value based planning is employed. The costs of energy hub placement include investment, operation and maintenance cost (O & M) of CHP, absorption chiller, auxiliary boiler and heat and electricity storage devices. To find the benefit term for CCHP placement, it is assumed that the outputs of CCHP are fully sold. Emission reduction and reliability enhancement are other major terms that would be added to form the total benefit. This planning method attempts to realize the minimum cost solution where the overall benefits can be maxi- mized. The total input flow Pg splits up to different converters such as CCHP and auxiliary boiler in Figure 1. Dispatch factor, γ, specifies how much of the total input power Pg flows through the CCHP. At the same time, absorption chiller uses heating power to generate cooling. and show the proportion of heating power that is produced by auxiliary boiler and CHP, consumed by the chiller. To investigate optimal value of this parameter, an appropri- ate objective function which is considered the net benefit for the energy hub system has to be formed. For modeling CO2 emission effects on power genera- tion two factors, e and g, are introduced. These pa- rameters show how many dollars you have to pay as penalty more than the electricity and gas price to com- pensate their harmful results for emitting greenhouse gases. Based on the social costs of carbon emissions, it is as- sumed that the price of carbon is $30 per ton ($0.03 per kg) which needs to increase with inflation rates [40]. With these extensions, multi-period multi-carrier optimal power flow and limitations can be stated as nonlinear program- ming (NLP) structur e: ein out ee eNgeg LNKKNSE NSEN PNP N (3) 1 h gfgh g outh inh LN Hn NNNN PN SNSN (4) 11 1 C fg ac goutcac LN CCn NN NN PN SN h (5) Equality constraints which describe the electricity, heat and cooling flow through the hub are given in (3 - 5) KK(N), CC(N) and H(N) indicates the amount of ex- ported electricity, cooling and heat in each hour. 1in SE NSE NSENSEout N (6) 0.9851 sinhSN SNN south Nsoutc N 0.25 in m SE NSE (8) 0.25 out m SE NSE (9) max SE NSE (10) sinh20 kwhN (11) ,15ksoutc Nsouth Nwh (12) m SN S (13) The amount of heat in the heating storage devices and electricity storage units are as in (6, 7). The coefficient 0.985 in Equation (7) shows 1.5% of stored heat gets lost per hour. Constrains which describe in (8-12) indicate the maximum and minimum input and output of battery and heat storage. Sm in (13) is the maximum capacity of heat storage. gm PN P (14) e PN Pem (15) :0, ,1NNNN (16) Limitation of the dispatch factors in (16) has to be re- garded as well. 2sinh hT N southN soutcNP (17) 1 ge e PN g xPNeNX (18) Equation (17) is the price of pumping heat auxiliary boiler or CHP in to the heat storage and from heat stor- age to the heating load. PhT is the price of pumping heat for each kWh. Benf i t 1 11 13 ee N ggh g N gf gf gh ac g old OPT LNeN XkkNeN Xb g PNN PNg NN NNPNCN CPVF EENSEENSVOLLCPVF 0 e (19) costcapital costrunning costCPVF (20) capital cost costCHP $ kwcap costBoiler$ kw costChiller$ kw Heating storogecost Electircity storog cost Fixed Cost m M CHP cap Boiler cap chiler S SE (21) (7) Copyright © 2013 SciRes. EPE 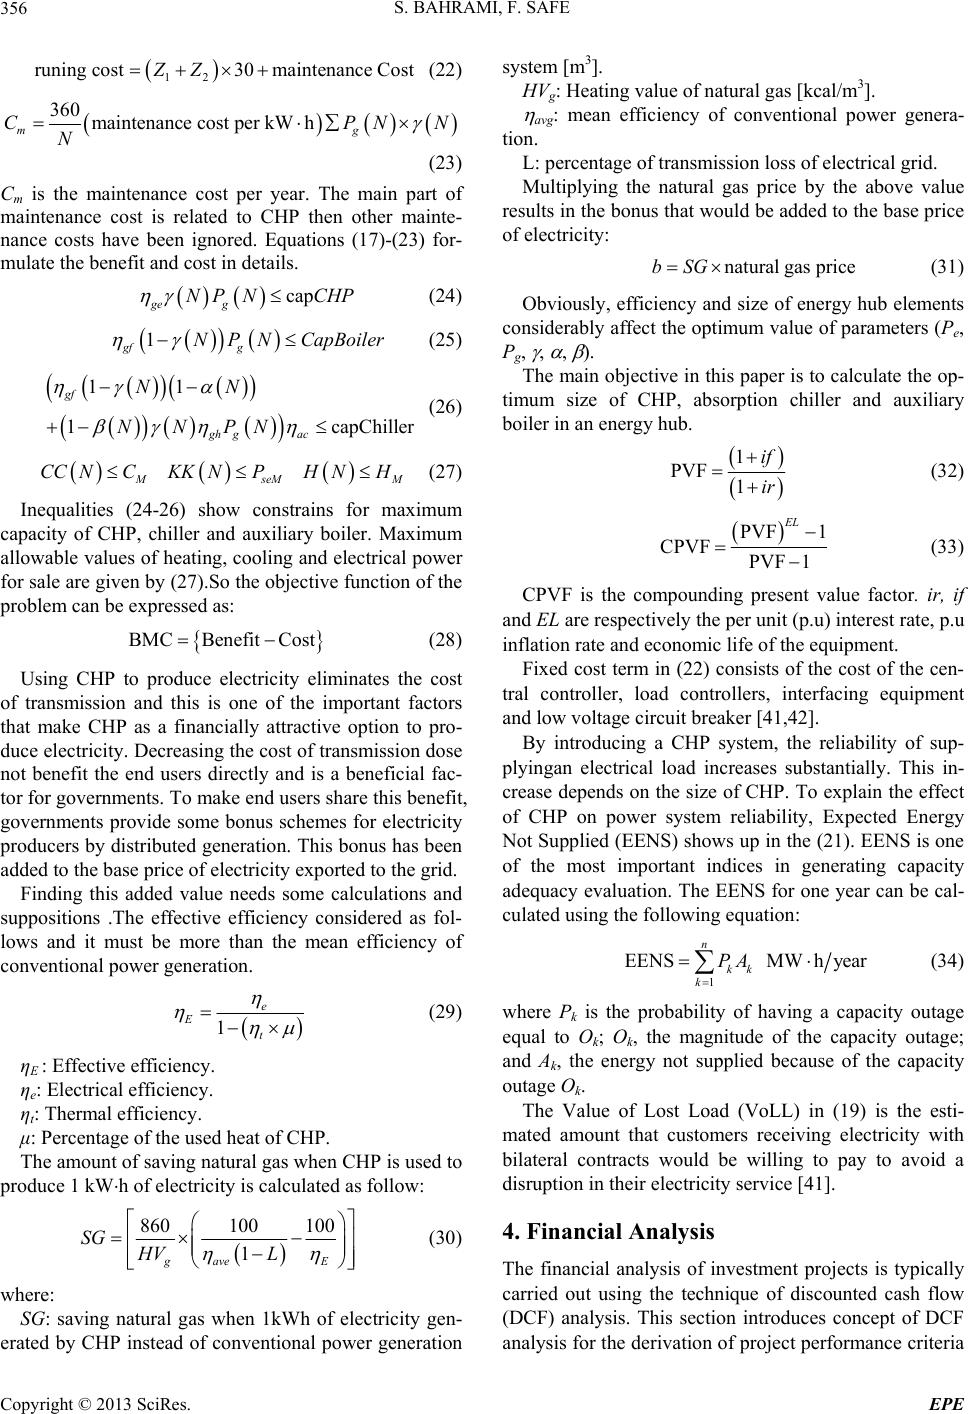 S. BAHRAMI, F. SAFE 356 12 runing cost30maintenanceCostZZ (22) 360 maintenance cost per kWh mg C N PNN (23) Cm is the maintenance cost per year. The main part of maintenance cost is related to CHP then other mainte- nance costs have been ignored. Equations (17)-(23) for- mulate the benefit and cost in details. cap ge g NP NCHP (24) 1 gf g NP NCapBoiler (25) 11 1 capChiller gf gh gac NN NNPN (26) seM M CC NCKKNPH NH (27) Inequalities (24-26) show constrains for maximum capacity of CHP, chiller and auxiliary boiler. Maximum allowable values of heating, cooling and electrical power for sale are given by (27).So the objective function of the problem can be expressed as: BMCBenefit Cost (28) Using CHP to produce electricity eliminates the cost of transmission and this is one of the important factors that make CHP as a financially attractive option to pro- duce electricity. Decreasing the cost of transmission dose not benefit the end users directly and is a beneficial fac- tor for governments. To make end users share th is benefit, governments provide some bonus schemes for electricity producers by distributed generation. This bonus has been added to the base price of electricity exported to the grid. Finding this added value needs some calculations and suppositions .The effective efficiency considered as fol- lows and it must be more than the mean efficiency of conventional power generation. 1 e E t (29) ηE : Effective efficiency. ηe: Electrical efficiency. ηt: Thermal efficiency. μ: Percentage of the used heat of CHP. The amount of saving natural gas when CHP is used to produce 1 kWh of electricity is calculated as follow: 860100 100 1 gaveE SG HV L (30) where: SG: saving natural gas when 1kWh of electricity gen- erated by CHP instead of conventional power generation system [m3]. HVg: Heating value of natural gas [kcal/m3]. avg: mean efficiency of conventional power genera- tion. L: percentage of transmission loss of electrical grid. Multiplying the natural gas price by the above value results in the bonus th at would be added to the base price of electricity: natural gas pricebSG (31) Obviously, efficiency and size of energ y hub elements considerably affect the optimum value of parameters (Pe, Pg, , , ). The main objective in this paper is to calcu late the op- timum size of CHP, absorption chiller and auxiliary boiler in an energ y hub. 1 PVF 1 if ir (32) PVF 1 CPVF PVF 1 EL (33) CPVF is the compounding present value factor. ir, if and EL are respectively the per unit (p.u) interest rate, p.u inflation rate and economic life of the equipment. Fixed cost term in (22) consists of the cost of the cen- tral controller, load controllers, interfacing equipment and low voltage circuit breaker [41,42]. By introducing a CHP system, the reliability of sup- plyingan electrical load increases substantially. This in- crease depends on the size of CHP. To explain the effect of CHP on power system reliability, Expected Energy Not Supplied (EENS) shows up in th e (21). EENS is one of the most important indices in generating capacity adequacy evaluation. The EENS for one year can be cal- culated using the following equation: 1 EENSMWh year n kk k PA (34) where Pk is the probability of having a capacity outage equal to Ok; Ok, the magnitude of the capacity outage; and Ak, the energy not supplied because of the capacity outage Ok. The Value of Lost Load (VoLL) in (19) is the esti- mated amount that customers receiving electricity with bilateral contracts would be willing to pay to avoid a disruption in their electricity service [41]. 4. Financial Analysis The financial analysis of investment projects is typically carried out using the technique of discounted cash flow (DCF) analysis. This section introduces concept of DCF analysis for the derivation of project performance criteria Copyright © 2013 SciRes. EPE 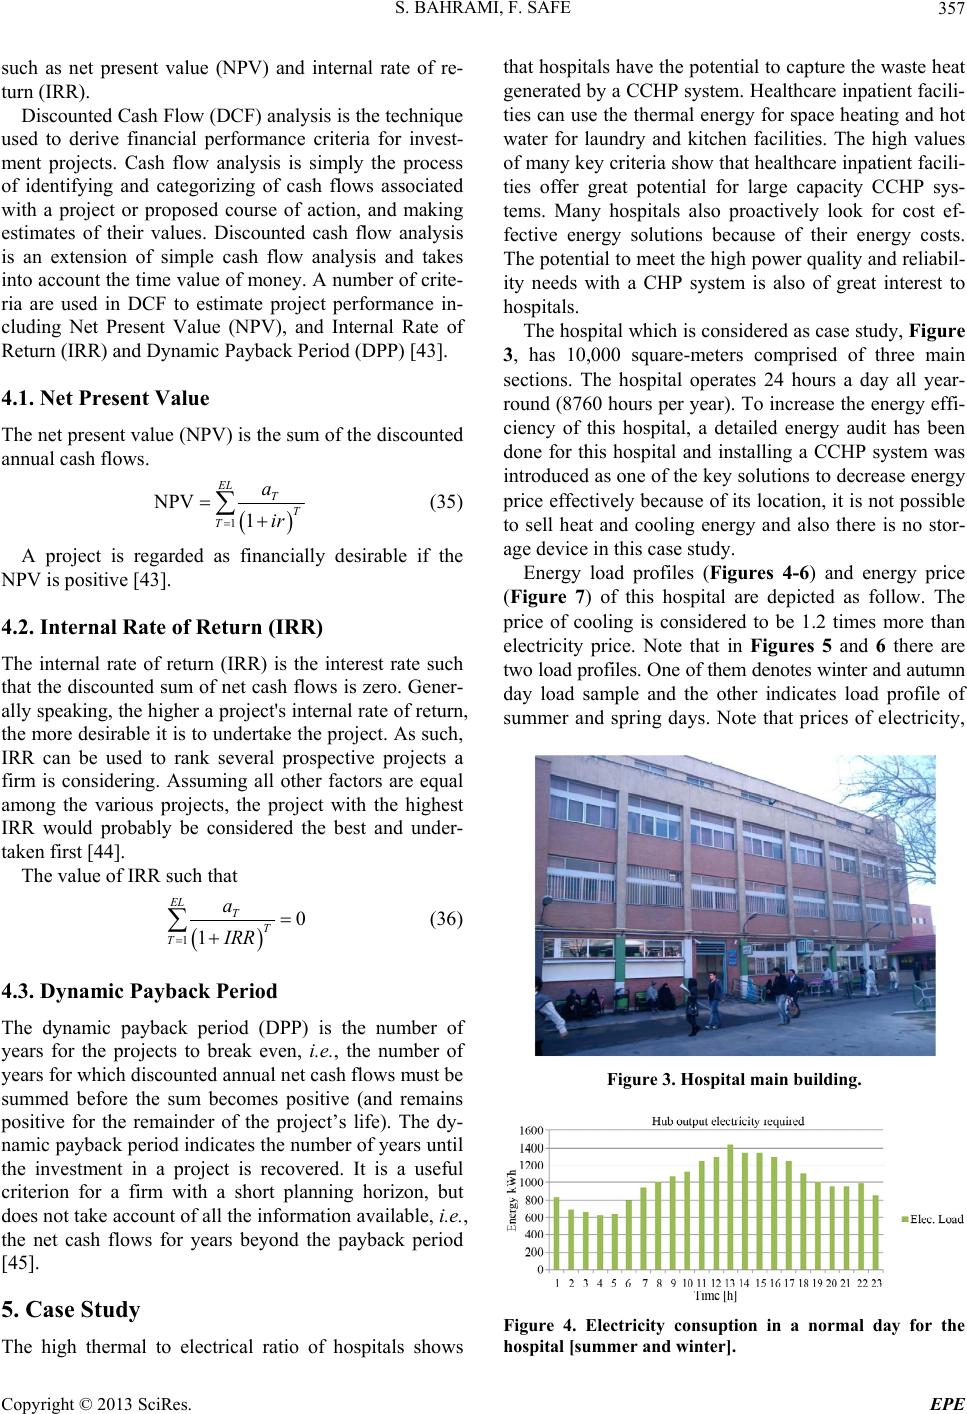 S. BAHRAMI, F. SAFE 357 such as net present value (NPV) and internal rate of re- turn (IRR). Discounted Cash Flow (DCF) analysis is the tech nique used to derive financial performance criteria for invest- ment projects. Cash flow analysis is simply the process of identifying and categorizing of cash flows associated with a project or proposed course of action, and making estimates of their values. Discounted cash flow analysis is an extension of simple cash flow analysis and takes into account the time value of money. A number of crite- ria are used in DCF to estimate project performance in- cluding Net Present Value (NPV), and Internal Rate of Return (IRR) and Dynamic Payback Period (DPP) [43]. 4.1. Net Present Value The net present value (NPV) is the sum of the discounted annual cash flows. 1 NPV 1 EL T T T a ir (35) A project is regarded as financially desirable if the NPV is positive [43]. 4.2. Internal Rate of Return (IRR) The internal rate of return (IRR) is the interest rate such that the discounted sum of net cash flows is zero. Gener- ally speaking, the higher a proj ect's internal rate of return, the more desirable it is to und ertake the project. As such, IRR can be used to rank several prospective projects a firm is considering. Assuming all other factors are equal among the various projects, the project with the highest IRR would probably be considered the best and under- taken first [44]. The valu e of IRR such that 1 0 1 EL T T T a IRR (36) 4.3. Dynamic Payback Period The dynamic payback period (DPP) is the number of years for the projects to break even, i.e., the number of years for which discounted annual net cash flows must be summed before the sum becomes positive (and remains positive for the remainder of the project’s life). The dy- namic payback period indicates the number of years until the investment in a project is recovered. It is a useful criterion for a firm with a short planning horizon, but does not take accoun t of all the information availab le, i.e., the net cash flows for years beyond the payback period [45]. 5. Case Study The high thermal to electrical ratio of hospitals shows that hospitals have the potential to capture the waste heat generated by a CCHP system. Healthcare inpatient facili- ties can use the thermal energy for space heating and hot water for laundry and kitchen facilities. The high values of many key criteria show that healthcare inp atient facili- ties offer great potential for large capacity CCHP sys- tems. Many hospitals also proactively look for cost ef- fective energy solutions because of their energy costs. The potential to meet the high power quality an d reliabil- ity needs with a CHP system is also of great interest to hospitals. The hospital which is con sidered as case stud y, Figure 3, has 10,000 square-meters comprised of three main sections. The hospital operates 24 hours a day all year- round (8760 hours per year). To increase the energy effi- ciency of this hospital, a detailed energy audit has been done for this hospital and installing a CCHP system was introduced as one of the key solutions to decrease energy price effectively because of its location, it is not possible to sell heat and cooling energy and also there is no stor- age device in this case study. Energy load profiles (Figures 4-6) and energy price (Figure 7) of this hospital are depicted as follow. The price of cooling is considered to be 1.2 times more than electricity price. Note that in Figures 5 and 6 there are two load profiles. One of them denotes winter and autumn day load sample and the other indicates load profile of summer and spring days. Note that prices of electricity, Figure 3. Hospital main building. Figure 4. Electricity consuption in a normal day for the hospital [summer and winter]. Copyright © 2013 SciRes. EPE 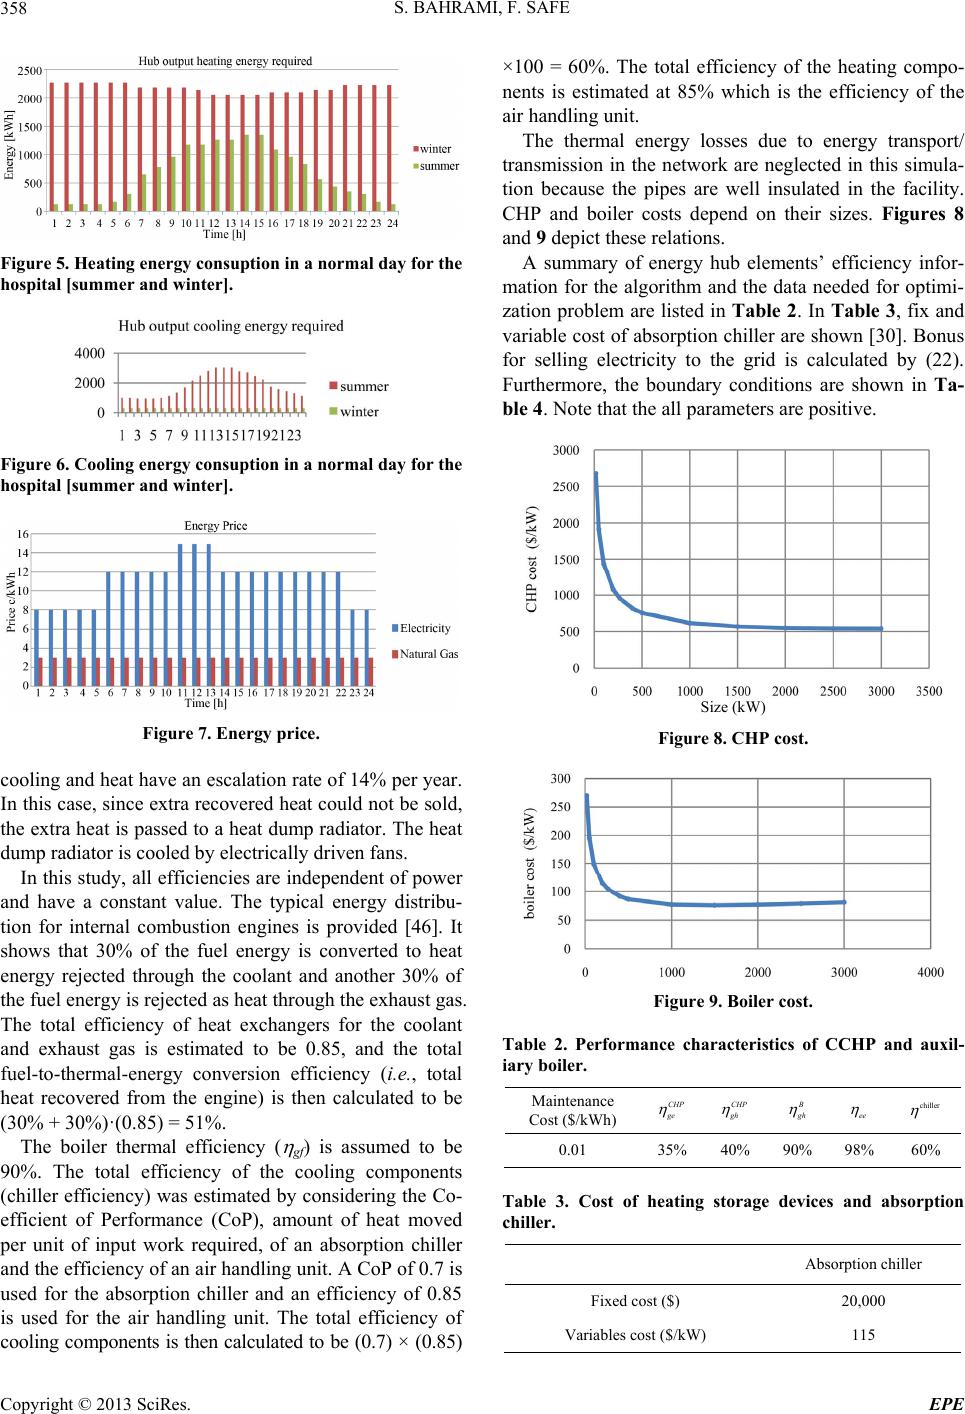 S. BAHRAMI, F. SAFE 358 Figure 5. Heating energy consuption in a normal day for the hospital [summer and winter]. Figure 6. Cooling energy consuption in a normal day for the hospital [summer and winter]. Figure 7. Energy price. cooling and heat have an escalation rate of 14% per year. In this case, since extra recovered heat could not be sold, the extra heat is passed to a heat dump radiator. The heat dump radiator is cooled by electrically driven fans. In this study, all efficiencies are independent of power and have a constant value. The typical energy distribu- tion for internal combustion engines is provided [46]. It shows that 30% of the fuel energy is converted to heat energy rejected through the coolant and another 30% of the fuel energ y is rejected as heat thr ough the exh aus t gas. The total efficiency of heat exchangers for the coolant and exhaust gas is estimated to be 0.85, and the total fuel-to-thermal-energy conversion efficiency (i.e., total heat recovered from the engine) is then calculated to be (30% + 30%)·(0.85) = 51%. The boiler thermal efficiency ( gf) is assumed to be 90%. The total efficiency of the cooling components (chiller efficiency) was estimated by considering the Co- efficient of Performance (CoP), amount of heat moved per unit of input work required, of an absorption chiller and the efficiency of an air handling unit. A CoP of 0.7 is used for the absorption chiller and an efficiency of 0.85 is used for the air handling unit. The total efficiency of cooling components is then calculated to be (0.7) × (0.85) ×100 = 60%. The total efficiency of the heating compo- nents is estimated at 85% which is the efficiency of the air handling unit. The thermal energy losses due to energy transport/ transmission in the network are neglected in this simula- tion because the pipes are well insulated in the facility. CHP and boiler costs depend on their sizes. Figures 8 and 9 depict these relations. A summary of energy hub elements’ efficiency infor- mation for the algorithm and the data needed for optimi- zation problem are listed in Table 2. In Table 3, fix and variable cost of absorption chiller are shown [30 ]. Bonus for selling electricity to the grid is calculated by (22). Furthermore, the boundary conditions are shown in Ta- ble 4. Note that the all parameters are positive. Size (kW) Figure 8. CHP cost. Figure 9. Boiler cost. Table 2. Performance characteristics of CCHP and auxil- iary boiler. Maintenance Cost ($/kWh) CHP ge CHP gh gh ee chiller 0.01 35% 40% 90% 98% 60% Table 3. Cost of heating storage devices and absorption chiller. Absorption chiller Fixed cost ($) 20,000 Variables cost ($/kW) 115 Copyright © 2013 SciRes. EPE 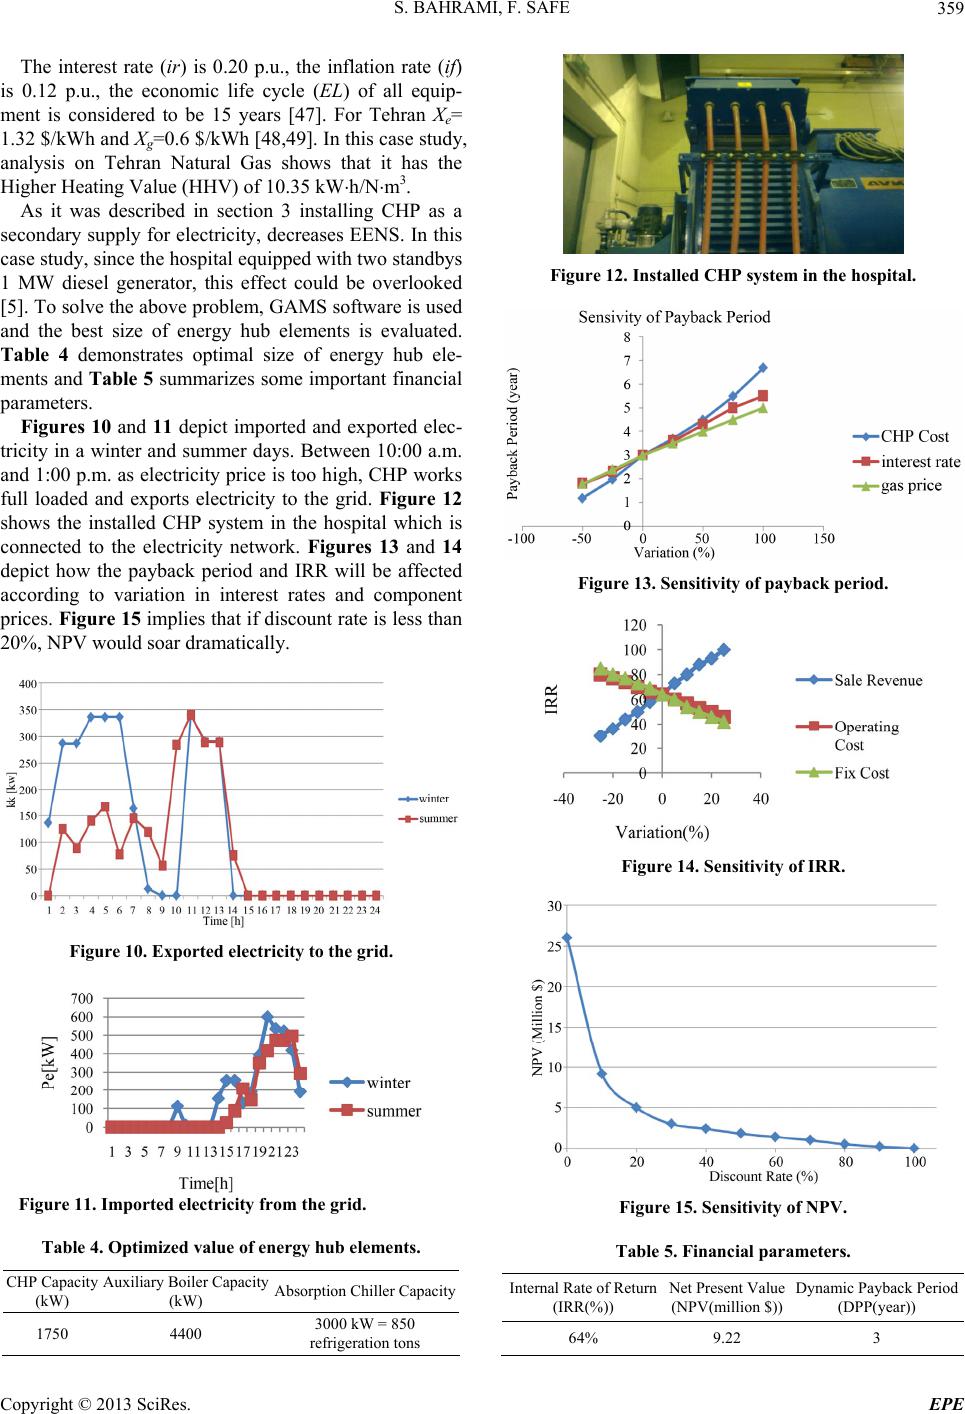 S. BAHRAMI, F. SAFE 359 The interest rate (ir) is 0.20 p.u., the inflation rate (if) is 0.12 p.u., the economic life cycle (EL) of all equip- ment is considered to be 15 years [47]. For Tehran Xe= 1.32 $/kWh and Xg=0.6 $/kWh [48,49]. In this case study, analysis on Tehran Natural Gas shows that it has the Higher Heating Value (HHV) of 10.35 kWh/Nm3. As it was described in section 3 installing CHP as a secondary supply for electricity, decreases EENS. In this case study, since the hospital equipped with two standbys 1 MW diesel generator, this effect could be overlooked [5]. To solve the above problem, GAMS software is used and the best size of energy hub elements is evaluated. Table 4 demonstrates optimal size of energy hub ele- ments and Table 5 summarizes some important financial parameters. Figures 10 and 11 depict imported and exported elec- tricity in a winter and summer days. Between 10:00 a.m. and 1:00 p.m. as electricity price is too high, CHP works full loaded and exports electricity to the grid. Figure 12 shows the installed CHP system in the hospital which is connected to the electricity network. Figures 13 and 14 depict how the payback period and IRR will be affected according to variation in interest rates and component prices. Figure 15 implies that if discount rate is less than 20%, NPV would soar dramatical l y . Figure 10. Exported electricity to the grid. Figure 11. Imported electricity from the grid. Table 4. Optimized value of energy hub elements. CHP Capacity (kW) Auxiliary Boiler Capacity (kW) Absorption Chiller Capacity 1750 4400 3000 kW = 850 refrigeration tons Figure 12. Installed CHP system in the hospital. Figure 13. Sensitivity of payback period. Figure 14. Sensitivity of IRR. Figure 15. Sensitivity of NPV. Table 5. Financial parameters. Internal Rate of Return (IRR(%)) Net Present Value (NPV(million $)) Dynamic Payback Period (DPP(year)) 64% 9.22 3 Copyright © 2013 SciRes. EPE  S. BAHRAMI, F. SAFE 360 Finally, the net price of 1 kWh electricity which is generated by CCHP calculates as follow: Electricityprice by CCHP Natural gas price Totalelectricity generated by CCHP O & M CostDepreciationCost Totalelectricity generated by CCHP CCHPCost Totalelectricity generated by CCHP Benefitofheatrecovery for cooling ir and heating Totalelectricitygenerated by CCHP 4.36 CentkWh (37) REFERENCES [1] A. Sheikhi, A. M. Ranjbar, M. Mahmoody and F. Safe, “CHP Optimize Selection Methodology for an Energy Hub System,” 10th International Conference on Envi- ronment and Electrical Engineering, Rome, 8-11 May 2011, pp. 1-5. [2] US EPA, “Inventory of US Greenhouse Gas Emissions and Sinks: 1990-2001,” EPA 430-R-03-004, US Environ- mental Protection Agency, Washington DC, 2003. [3] J. McDonald, “Adaptive Intelligent Power Systems: Ac- tive Distribution Networks,” Energy Policy, Vol. 36, No. 12, 2008, pp. 4346-4351. doi:10.1016/j.enpol.2008.09.038 [4] V. H. Mendez, J. Rivier, J. I. De La Fuente, T. Gomez, J. Arceluz and J. Marin, “Impact of Distributed Generation on Distribution Investment Deferral,” International Jour- nal of Electrical Power & Energy Systems, Vol. 28, No. 4, 2006, pp. 244-252. doi:10.1016/j.ijepes.2005.11.016 [5] R. Billinton and R. N. Allen, “Reliability Evaluation of Engineering Systems, Conceptand Techniques,” 2nd Edi- tion, Plenum Press, New York, 1992. doi:10.1007/978-1-4899-0685-4 [6] R. Graham and W. Chow, “Technical and Economic As- sessment of Combined Heat and Power Technologies for Commercial Customer Applications,” EPRI Project Man- ager, 2003. [7] H. Cho, R. Luck, S. D. Eksioglu and L. M. Chamra, “Cost Optimized Real Time Operationof CHP System,” Energy and Buildings, Vol. 41, No. 4, 2009, pp. 445-451. doi:10.1016/j.enbuild.2008.11.011 [8] A. Sheikhi, B. Mozafari and A. M. Ranjbar, “CHP Opti- mize Selection Methodology for a Multicarrier Energy System,” Power Tech Conference, Trondheim, 19-23 June 2011, pp. 1-7. [9] J. Teng, Y. Liu, C. Chen and C.-F. Chen, “Value-Based Distributed Generator Placements for Service Quality Im- provements,” International Journal of Electrical Power and Energy Systems, Vol. 29, No. 3, 2007, pp. 268-274. doi:10.1016/j.ijepes.2006.07.008 [10] A. M. Sheikhi and R. H. Oraee, “Financial Analysis and Optimal Size and Operation for a Multicarrier Energy System,” Energy and Buildings, Vol. 48, 2012, pp. 71-78. doi:10.1016/j.enbuild.2012.01.011 [11] A. Sheikhi and A. M. Ranjbar, “Optimal Dispatch of a Multiple Energy Carrier System Equipped with a CCHP,” ICREPQ Conference, Las Palmas de Gran Canaria, 2011. [12] P. J. Mago and L. M. Chamra, “Analysis and Optimiza- tion of CCHP Systems Based on Energy, Economical, and Environmental Considerations,” Energy and Building, Vol. 41, No. 10, 2009, pp. 1099-1106. doi:10.1016/j.enbuild.2009.05.014 [13] R. Hashemi, “A Developed Offline Model to Optimal Operation of Combined Cooling, Heating and Power Sys- tems,” IEEE Transaction on Energy Conversion, Vol. 24 No. 1, 2009, pp. 222-229. doi:10.1109/TEC.2008.2002330 [14] P. M. Costa and M. A. Matos, “Economic Analysis of Microgrids including Reliability Aspect,” 9th International Conference on Probabilistic Methods Applied to Power System, Stockholm, 11-15 June 1, 2006, pp. 1-15. doi:10.1109/PMAPS.2006.360236 [15] H. Asano and S. Bando, “Operational Planning Method and Economic Analysis of Microgrid with Intermittent Renewable Energy and Battery Storage,” 29th IAEE In- ternational Conference, Potsdam, 7-10 June 2006. [16] A. R. Abdelaziz and W. M. Ali, “Dispersed Generation Planning Using a New Evolutionary Approach,” IEEE Bologna Power Tech Conference Proceedings, Bologna, 23-26 June 2003, 5 Pages. doi:10.1109/PTC.2003.1304336 [17] R. Dugan, T. E. McDermott and G. J. Ball, “Planning for Distributed Generation,” IEEE Industry Applications Maga- zine, Vol. 7, No. 2, 2001, pp. 80-88. doi:10.1109/2943.911193 [18] H. M. Groscurth, T. Bruckner and R. Kümmel, “Model- ing of Energy Service Supply System,” Energy, Vol. 20, No. 9, 1995, pp. 941-958. doi:10.1016/0360-5442(95)00067-Q [19] I. Bouwmans and K. Hemmes, “Optimising Energy Sys- tems—Hydrogen and Distributed Generation,” 2nd In- ternational Symposium on Power System Market Aspects, Stockholm, 2-4 October 2002. [20] R. H. Lasseter and P. Piagi, “Microgrid: A Conceptual solution,” Proceedings of IEEE 35th Annual Power Elec- tronics Specialists Conference (PESC), Aachen, 20-25 June 2004, pp. 1-6. [21] R. Frik and P. Favre-Perrod, “Proposal for a Multifunc- tional Energy Bus and Its Interlink with Generation and Consumption, Diploma Thesis,” Power Systems and High Voltage Laboratories, Zurich, 2004. [22] G. Andersson, “A Modeling Framework for Future En- ergy Systems,” Project Home Page, 2006, http://www.eeh.ee.ethz.ch/psl/research/vofen.html [23] P. Favre-Perrod, M. Geidl, G. Koeppel and B. Klockl, “A Vision of Future Energy Network,” IEEE Inaugural Con- ference and Exposition in Africa, Dur ban, 11-15 July 2005, pp. 13-17. Copyright © 2013 SciRes. EPE  S. BAHRAMI, F. SAFE Copyright © 2013 SciRes. EPE 361 [24] K. Hemmes, J. L. Zachariah-Wolf and G. Andersson, “Towards Multi-Source Multi-Product Energy Systems,” Hydrogen Energy, Vol. 32, No. 10-11, 2007, pp. 1332- 1338. [25] M. Geidl, “Integrated Modeling a nd Optimization of Multi- Carrier Energy Systems,” PhD Thesis, Eidgenössische Technische Hochschule Zürich, Zürich, 2007. [26] G. Koppl and G. Andersson, “Reliability Modeling of Multicarrier Energy Systems,” Energy, Vol. 34, No. 3, 2009, pp. 235-244. doi:10.1016/j.energy.2008.04.012 [27] M. D. Galus and G. Andersson, “Power System Con- siderations of Plug-In Hybrid Electric Vehicles Based on a Multi Energy Carrier Model,” IEEE Power & Energy Society General Meeting, Calgary, 26-30 July 2009, pp. 1-8. [28] F. Kienzle, P. Ahcin and G. Andersson, “Valuing Invest- ments in Multi-Energy Conversion, Storage, and De- mand-Side Management Systems under Uncertainty,” IEEE Transaction on Sustainable Energy, Vol. 2, No. 2, 2011, pp. 194-202. [29] M. Arnol and G. Andersson, “Investigating Renewable Infeed in Residential Area Applying Model Predictive Control,” IEEE Power & Energy Society General Meet- ing, Minneapolis, 25-29 July 2010, pp. 1-8. [30] T. Krause, F. Kienzle, Y. Liu and G. Anderssson, “Inter Connected National Energy Systems Using an Energy Hub Approach,” IEEE PowerTech, Trondheim, 19-23 June 2011, pp. 1-7. [31] M. Schuzle, L. Friedric h and M. Gautschi, “Modeling and Optimization of Renewables: Applying the Energy Hub Approach,” IEEE Conference on Sustainable Energy Tech- nologies, Singapore City, 24-27 November 2008, pp. 83- 88. [32] A. Parisio, C. D. Vecchio and A. Vaccaro, “A Robust Optimization Approach to Energy Hub Management,” Electrical Power and Energy Systems, Vol. 42, No. 1, 2012, pp. 98-104. [33] L. Carradore and R. Turri, “Modeling and Simulation of Multi-Vector Energy Systems,” IEEE Conference on Power Tech, Bucharest, 28 June-2 July 2009, pp. 1-7. [34] E. M Robertson, et al., “Outline for an Integrated Multi- ple Energy Carrier Model of the UK Energy Infrastruc- ture,” 44th International Universities Power Engineering Conference (UPEC), Glasgow, 1-4 September 2009, pp. 1-5. [35] L. Forbes, S. T. Galloway and G. W. Ault, “An Approach for Modeling a Decentralized Energy System,” 45th In- ternational Universities Power Engineering Conference (UPEC), Cardiff, 31 August-3 September 2010, pp. 1-5. [36] L, M, Ramirez-Elizondo and G. C. Paap, “Unit Commit- ment in Multiple Energy Carrier Systems,” IEEE Con- ference, Starkville, 4-6 October 2009, pp. 1-6. [37] V. Velez, L. Ramirez-Elizendo and G. C. Paap, “Control Strategy for an Autonomous Energy System with Elec- tricity and Heat Flows,” IEEE Conference, Hersonissos, 25-28 September 2011, pp. 1-6. [38] F. Syed, “Analysis of a Clean Energy Hub Interfaced with a Fleet of Plug-In Fuel Cell Vehicles,” Master Thesis, University of Waterloo, Waterloo, 2011. [39] M. Setayeshnazar and M. R. Haghifam, “Multi Objective Electric Distribution System Expansion Planning Using Hybrid Energy Hub Concept,” Electric Power Systems Research, Vol. 79, No. 6, 2009, pp. 899-911. doi:10.1016/j.epsr.2008.12.002 [40] M. Geidl, “A Green Field Approaches for Future Power Systems,” Cigre Session 41, Paris, 2006. [41] A. Sheikhi, A. M. Ranjbar, H. Oraee and A. R. Moshari, “Optimal Operation and Size for an Energy Hub with CCHP,” Energy and Power Engineering Journal, Vol. 3, No. 5, 2011, pp. 641-649. [42] A. K. Basu and S. Chowdhury,” Impact of Strategic De- ployment of CHP-Based DERs on Microgrid Reliability,” IEEE Transactions on Power Delivery, Vol. 25, No. 3, 2010, pp. 1697-1705. [43] D. G. Newnan, T. G. Eschenbach and J. P. Lavelle, “En- gineering Economic Analysis,” 9th Edition, Oxford Uni- versity Press, Oxford, 2004. [44] M. Y. Khan, “Theory & Problems in Financial Manage- ment,” McGraw Hill Higher Education, New York, 1993. [45] M. A. Main, “Project Economics and Decision Analysis, Volume I: Deterministic Models,” 2nd Edition, PennWell Publishing, Tulsa, 2002. [46] American Society of Heating Refrigerating and Air-Con- ditioning Engineers, “Ashrae Handbook—Hvac Systems and Equipment,” 2009. [47] A. Sheikhi, et al., “CHP Optimized Selection Methodo- logy for a Multi-Carrierenergy System,” International of Review Electrical Engineering (I.R.E.E), Vol. 6, No. 4, 2011, pp. 1-7. [48] H. Cho, “Evaluation of CCHP Systems Performance Based on Operational Cost Primary Energy Consumption, and Carbon Dioxide Emission by Utilizing an Optimal Operation Scheme,” Applied Energy, Vol. 86, No. 12, 2009, pp. 2540-2549. doi:10.1016/j.apenergy.2009.04.012 [49] B. Rolfsman, “CO2 Emission Consequences of Energy Measures in Buildings,” Building and Environment, Vol. 37, No. 12, 2002, pp. 1421-1430.  S. BAHRAMI, F. SAFE 362 List of Symbols and Abbreviations N Time intervals of optimization e LN Electrical energy demand in the time interval [kWh] h LNHeating energy demand in the time interval [kWh] c LNCoolingenergy demand in the time interval [kWh] eNElectricity price $kwh Gas price $kwh ir Interest rate iff EL Inflation rate Economic life of the equipment [year] CMaintenance cost $kw h m C Yearly maintenance cost $year Effective efficiency of CHP ee Transformer efficiency 20kV/440kV e Electrical efficiency of CHP f Auxiliary boiler efficiency h Thermal efficiency of CHP ac Absorption chiller efficiency e Emission factor for average power generation $kw h Emission factor for gas power generation $kw VOL h L Value of lost load $kw h HHV Higher heating value CoP Coefficient of performance hT Variables: P Pumping heat price [cent/kWh] e PN PN Pu rchased electricity [kWh] g Purchased nat ural gas [ kWh] M P Maximum purchased natural gas [kW] m P P Minimum purchase d nat ural gas [kW] eM Maximum purchased electricity [kW] em P Minimum purchased electricity [kW] N Dispatched factor for natural gas inlet N Dispatch factor for auxiliary boiler N Dispatch factor for CHP inh NS Inp ut rate of heat storage kWh SN outh Output rate of heat storage kWh S Nominal capacity of heat storage kW in NSE Input rate of bat t ery kWh SE N out Output rate of battery kWh SE Benefit(X) Benefit of using the element X [$] Nominal capacity of battery kW Cost(X) Cost of using element X [$] Cap(X) Capacity of element X [kW] BMC Benefit minus cost [$] KK(N) Exported electricity to the grid [kWh] Z1 Price of heat transfer from CHP, heat storage and auxiliary boiler to the load [$] Z2 Price of purchased electri c i t y and gas [$] H(N) Exported heat [kWh] CC(N) Cooling exported [kWh] Maximum heat exported [kWh] CM Maximum cooling exported [kWh] SeM Maximum exported electricity from CHP to the grid [kWh] P EENS Expected energy not supplied Pk The probability of having a capacity outage equal to Ok Ok Outage capacity Ak The energy not supplied because of the capacity outage Ok ak Annual net cash flow DCF Discounted cash flow IRR Internal rate of return DPP Dynamic payback period NPV Net present value Copyright © 2013 SciRes. EPE
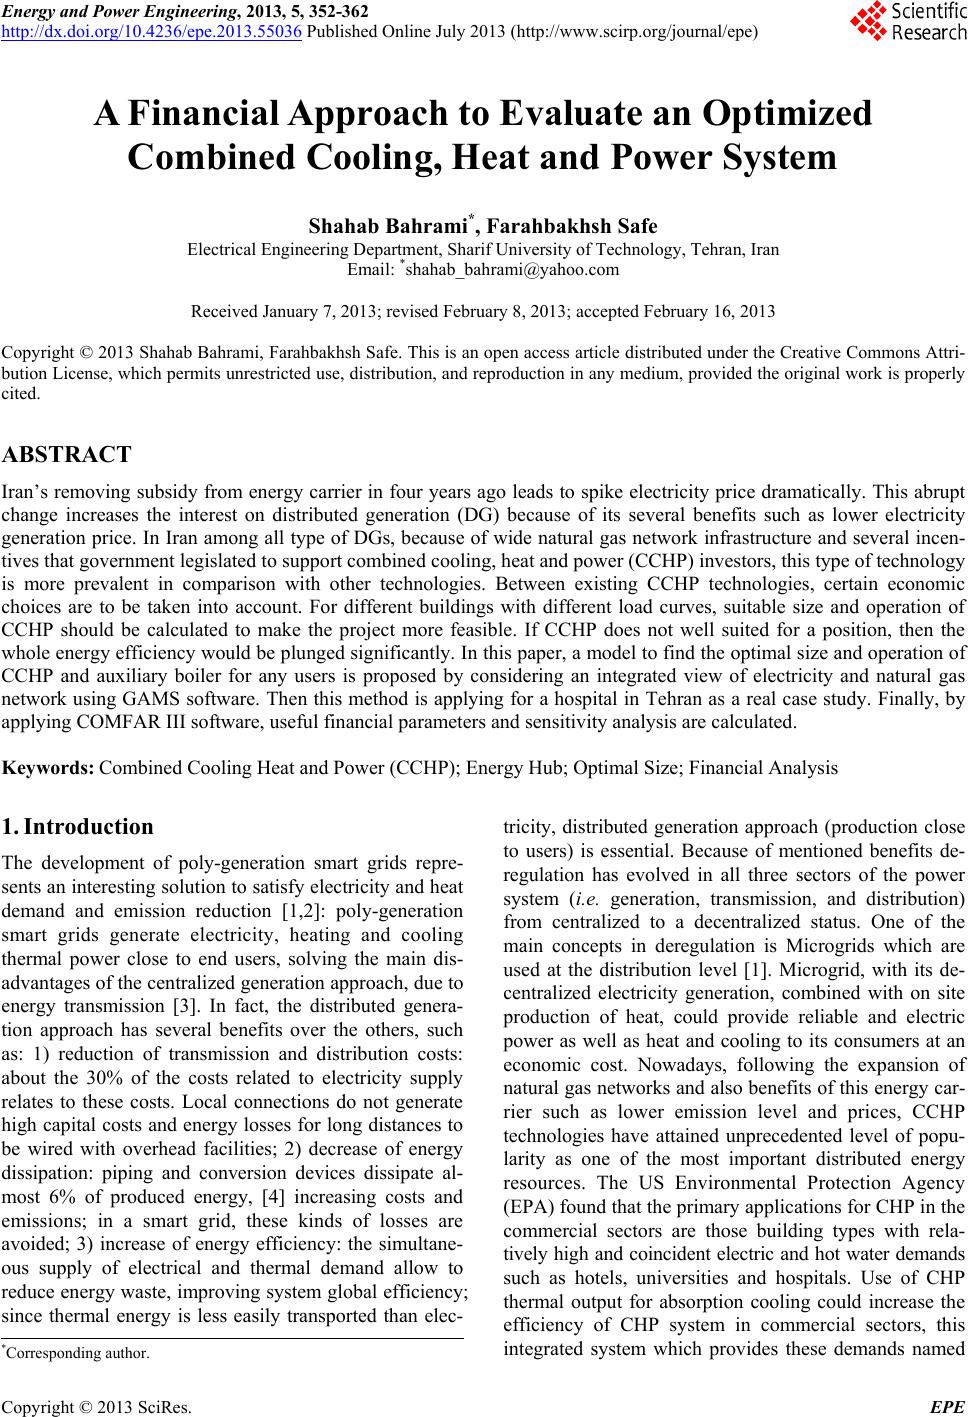
|