Paper Menu >>
Journal Menu >>
 J. Service Science & Management, 2010, 3, 464-469 doi:10.4236/jssm.2010.34052 Published Online December 2010 (http://www.SciRP.org/journal/jssm) Copyright © 2010 SciRes. JSSM On the Contribution of Student Experience Survey Regarding Quality Management in Higher Education: An Institutional Study in Saudi Arabia Abdullah Al Rubaish Office of the Presid e n t , Uni v ersity of Dammam, Damma m, Saudi Arabia. Email: arubaish@hotmail.com Received August 28th, 2010; revised October 9th, 2010; accepted Nov ember 14th, 2010. ABSTRACT We appraise comparatively and analytical data under Student Experience Survey (SES) to discuss the possible gener- alizability of related College level differentials in Saudi Arabia. For this, data collected from students of two academic programs namely Bachelor of Dental Surgery, College of Dentistry; and B.Sc. Nursing, College of Nursing, University of Dammam, Dammam, Saudi Ara bia, were considered. These data relate to experience of students halfway of respec- tive academic program. The percentage of participation in SES by students was 100% and 94% respectively. Students of neither the programs reported h igh quality p erceptio n about an y of the 20 items considered under SES. With a target of satisfaction by a t least 50% students, students from College of Nursing expressed better satisfaction than those from the College of Dentistry. Same is true in case of aiming to achieve satisfaction by at least 75% students. However, to gain satisfaction by at lea st 80% students, each of the 20 items in both colleg es need focus of colleg e as well a s univer- sity administrators towards required improvements. In summary, suitable to its varying environment, each pro- gram/college in a university requires specific improvement planning . Keywords: Student Experie nce Survey, Academic Program, Higher Education, High Quality, Acceptable and Improve- ment Required Perception 1. Introduction The assessment of educational quality un der an academic program, through students’ satisfaction, is one of the important aspects regarding quality management in higher education. Further, the global acceptance of ob- servations from students’ evaluation surveys regarding improvements in higher education, is a well known phe- nomenon. Hence, there is much literature and ongoing research on the topic [1]. Although some key issues have already been addressed, many still require attention. Writing about existing gaps in our collective knowledge, and, making suggestions for further research, Gravestock and Gregor-Greenleaf identified two issues of major concern: namely “understanding evaluation’s users” and “educating evaluation’s users” [1]. The interpretation of evaluation results for users is, basically, bipolar: institutional and unit-specific. It ad- dresses the needs of disparate users, ranging from policy makers and administrators, through faculty and staff members to students. This divergence of users’ needs also must be studied [2]. Focused observational research on the decision mak- ing process is helpful for clearer understanding of the use of evaluation results [3]. Recently, a number of limita- tions of students’ surveys have been reported [1,4]. In spite of that, they continue to play a critical role in the development of academic colleges, their programs and universities. There is a healthy competition among institutions of higher education for quality education. Hence, as a con- tinuing process, there is need of related developments and their sustainability. For this, keeping in mind micro and macro level requirements, institutions have to rely on students’ ratings on different components of their core functions, including courses, teaching skills and aca- demic programs, as well as colleges and universities as a whole [5-18]. If clarity is lacking in reporting, so metimes, it becomes difficult to find out which aspect of the eval- uation process has been c ove red [18]. The University of Dammam is currently performing  On the Contribution of Student Experience Survey Regarding Quality Management in Higher 465 Education: An Institutional Study in Saudi Arabia several evaluations by students as required for academic accreditation by the National Commission for Academic Accreditation & Assessment (NCAAA). Of these, two deal with program evaluations- viz.: Student Experience Survey (SES) and Program Evaluation Survey (PES). SES denotes the experience of students halfway through a given academic program, and, PES their over- all experience at the end. The nomenclature for PES var- ies from one institution or country to another [4 ]. Thus, it is called Course Experience Questionnaire (CEQ) in Australia, and, National Student Survey (NSS) in the UK. A literature review showed that neither term-SES nor PES -- is in common usage. In spite of our best effort, we failed to find raw data in the public domain, or, scientific articles in which they were mention ed. The present article deals with students’ overall ex- periences about academic programs. It is written from the perspective of both an administrator and a researcher. It describes our institution al practice, using two sets of SES data from of our colleges. It discusses administrative use of the measured SES results to plan for improvement of academic programs. As an added merit [10], it is ex- pected that the observations reported here may help those undertaking pertinent corrective measures. They can find also application in quality management in other institu- tions of tertiary education. 2. Materials and Methods 2.1. Data I have considered SES data from two academic programs of University of Dammam, Dammam, Saudi Arabia. One was from students in the 7th semester of a 12-semester program: Bachelor of Dental Surgery, 2009-10. The oth- er was from students in the 5th semester of an 8-semester program: B.Sc. Nursing, 2009-10. The coverage achieved for respondents was 20/20 and 83/88 (94%) respectively. This observed coverage was more than two-thirds of the class, ensuring representativeness of student evaluation data [19]. 2.2. Analytical methods The SES questionnaire has 20 items (Appendix 1). As a “Likert type item”, each item was in five points [1], in- dicating the degree of agreement with a statement in as- cending order: 1 = Strongly Disagree; 2 = Disagree; 3 = True Sometimes; 4 = Agree; 5 = Strongly Agree. A Likert type item is on an ordinal scale. Concerning item by item analysis, we have already communicated fully on the evaluation of such analyses [20]. Thus, I used the measure adopted by NCAAA, and, three other measures which are more appropriate and offer prob- lem-solving potential [21]. To facilitate reference, I brie- fly re-iterate here the four measures used [20,22]. The arithmetic mean for an item measures the core image of the distribution of agreement scores that are collected on an ordinal scale. Also, since related distribu- tions are often skewed, the mean cannot be appropriate. Two of the other three measures of location used here- median and first quartile - are preferred to the mean in such circumstances. These measures for an item imply that at least 50% and 75% of respondents students re- spectively have assigned that score or higher for the cor- responding item. A third appropriate measure used here is cumulative % of students with score 4 or 5. We have argued that this measure has at least four attributes [20,22]. It is straight forward, easy to understand and to use by the colleges and university level administrators. The clues obtained are expected to be more meaningfully translated into action towards further improvement in those programs. The performance grading criteria for items under the four measures used are listed below: Criteria Performance Grading Mean Median First Quartile Cumulative % High Quality3.6 & above 4 & 5 4 & 5 80 & above Acceptable 2.6-3.63 3 60-80 Improvement Required Less than 2.61 & 2 1 & 2 Less than 60 Pooled analysi s This university is at the formative stage of academic accreditation by NCAAA. As such, each of the 20 items related to each program is considered equally important. The diagram shows pooled results at program level, the distribution of total items in relation to the levels of per- formance considered as mean, median, first quartile and cumulative %. 3. Results The item by item analytical results of SES for the col- leges of dentistry and nursing are listed in table1. Po oled results at program level are depicted in Figure 1. The related observations are descri bed in successive sections. 3.1. College of Dentistry The students in this college, regardless of grading crite- rion used did not report “high quality” perception in any of the 20 items (Table 1). When mean grading criterion lone was considered, “acceptable” rating was observed a Copyright © 2010 SciRes. JSSM 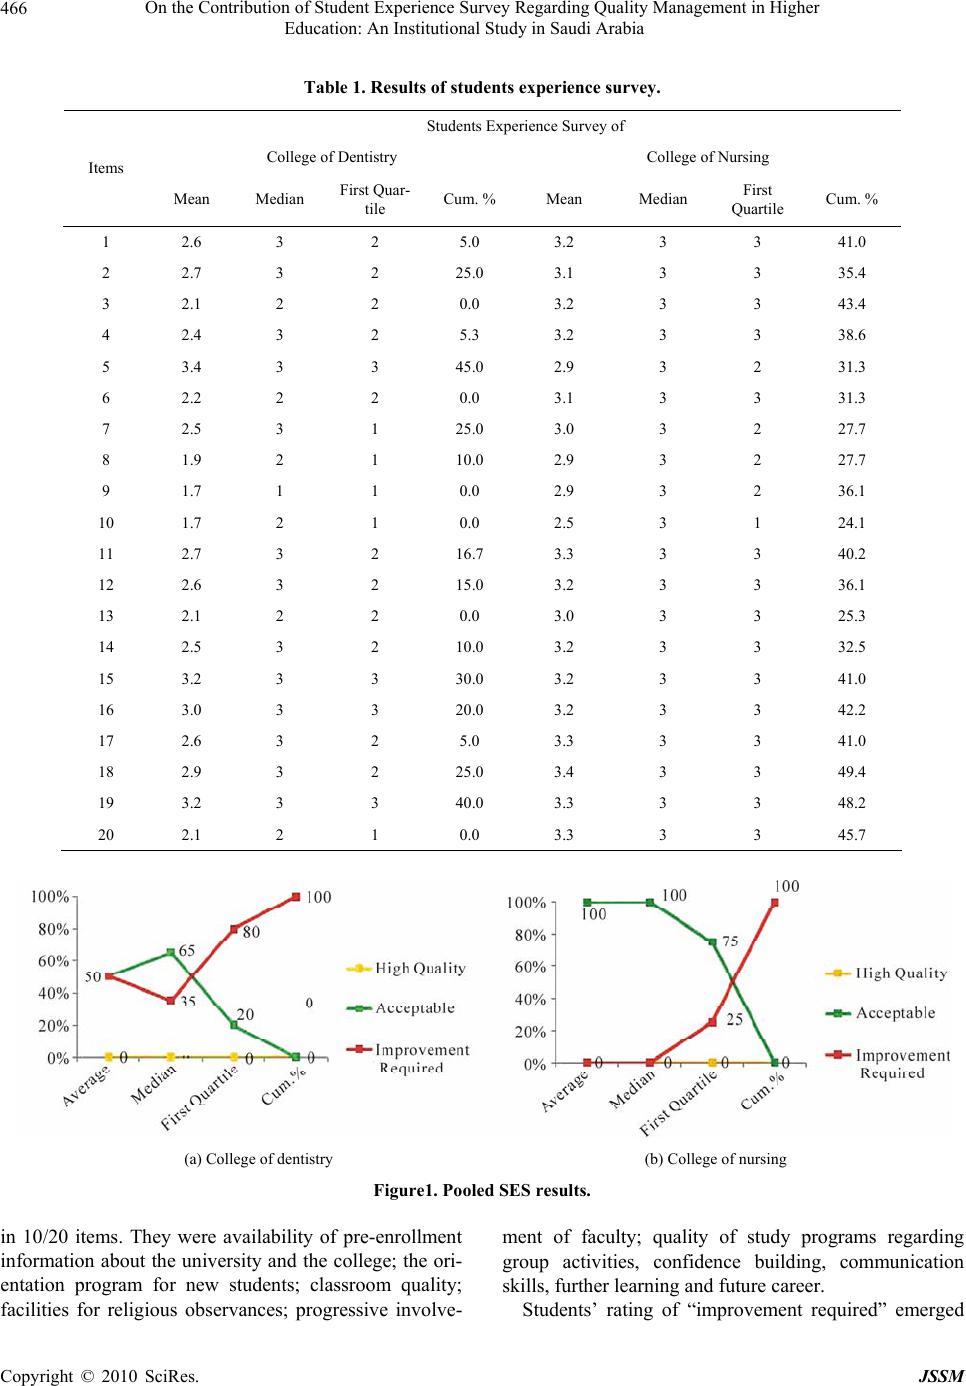 On the Contribution of Student Experience Survey Regarding Quality Management in Higher Education: An Institutional Study in Saudi Arabia Copyright © 2010 SciRes. JSSM 466 Table 1. Results of students experience survey. Students Experience Survey of College of Dentistry College of Nursing Items Mean Median First Quar- tile Cum. % Mean Median First Quartile Cum. % 1 2.6 3 2 5.0 3.2 3 3 41.0 2 2.7 3 2 25.0 3.1 3 3 35.4 3 2.1 2 2 0.0 3.2 3 3 43.4 4 2.4 3 2 5.3 3.2 3 3 38.6 5 3.4 3 3 45.0 2.9 3 2 31.3 6 2.2 2 2 0.0 3.1 3 3 31.3 7 2.5 3 1 25.0 3.0 3 2 27.7 8 1.9 2 1 10.0 2.9 3 2 27.7 9 1.7 1 1 0.0 2.9 3 2 36.1 10 1.7 2 1 0.0 2.5 3 1 24.1 11 2.7 3 2 16.7 3.3 3 3 40.2 12 2.6 3 2 15.0 3.2 3 3 36.1 13 2.1 2 2 0.0 3.0 3 3 25.3 14 2.5 3 2 10.0 3.2 3 3 32.5 15 3.2 3 3 30.0 3.2 3 3 41.0 16 3.0 3 3 20.0 3.2 3 3 42.2 17 2.6 3 2 5.0 3.3 3 3 41.0 18 2.9 3 2 25.0 3.4 3 3 49.4 19 3.2 3 3 40.0 3.3 3 3 48.2 20 2.1 2 1 0.0 3.3 3 3 45.7 (a) College of dentistry (b) College of nursing Figure1. Pooled SES results. in 10/20 items. They were availability of pre-enrollment information about the university and the college; the ori- entation program for new students; classroom quality; facilities for religious observances; progressive involve- ment of faculty; quality of study programs regarding group activities, confidence building, communication skills, further learning and future career. Students’ rating of “improvement required” emerged 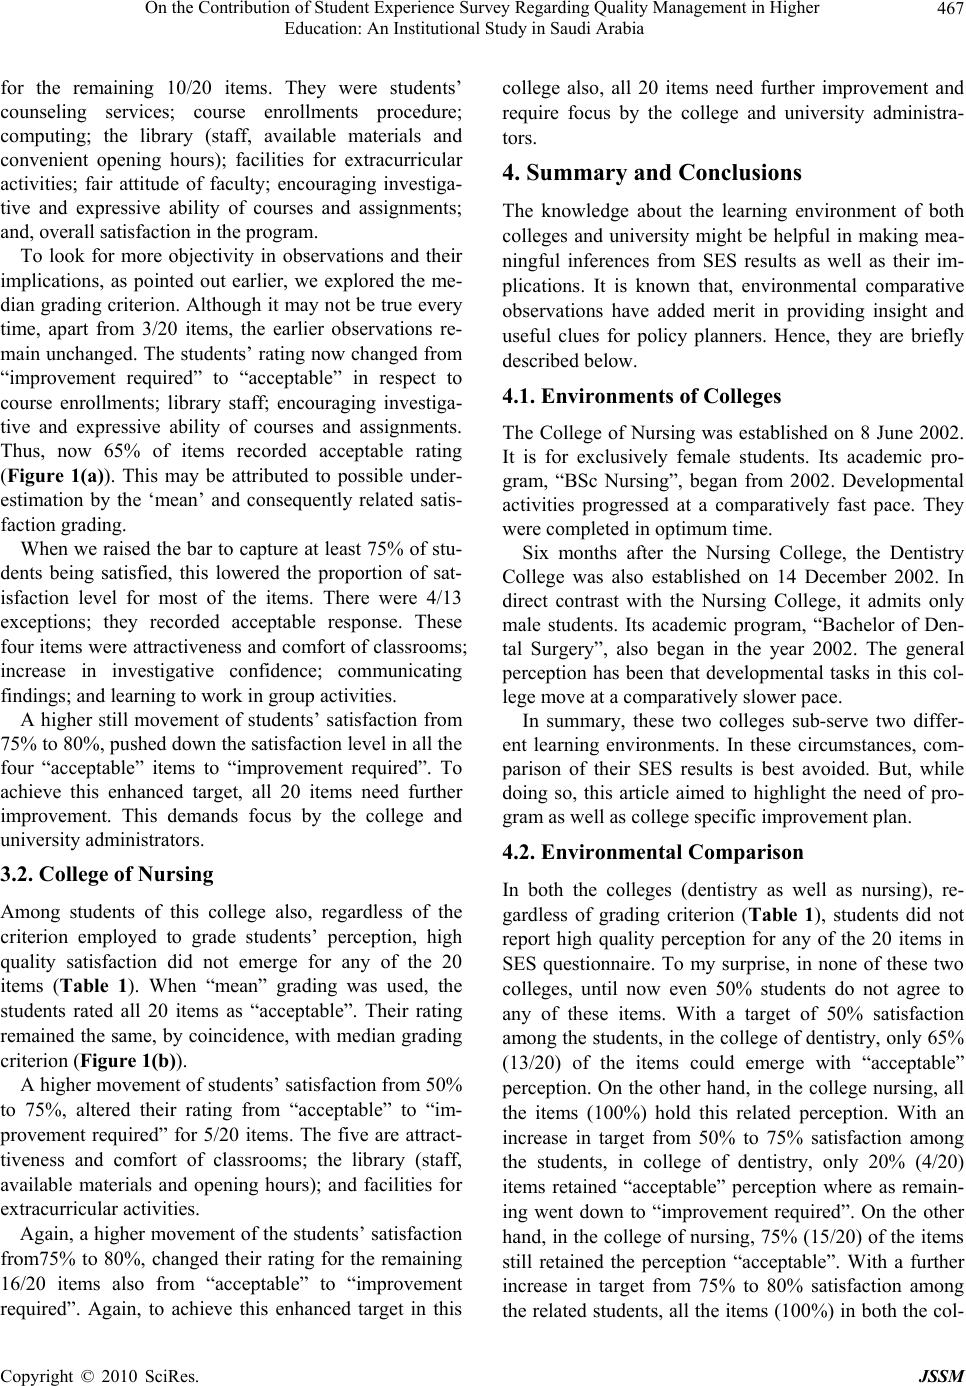 On the Contribution of Student Experience Survey Regarding Quality Management in Higher 467 Education: An Institutional Study in Saudi Arabia for the remaining 10/20 items. They were students’ counseling services; course enrollments procedure; computing; the library (staff, available materials and convenient opening hours); facilities for extracurricular activities; fair attitude of faculty; encouraging investiga- tive and expressive ability of courses and assignments; and, overall satisfaction in the program. To look for more objectivity in observations and their implications, as pointed out earlier, we explored the me- dian grading criterio n. Although it may not be true ev ery time, apart from 3/20 items, the earlier observations re- main unchanged. The students’ rating now changed from “improvement required” to “acceptable” in respect to course enrollments; library staff; encouraging investiga- tive and expressive ability of courses and assignments. Thus, now 65% of items recorded acceptable rating (Figure 1(a)). This may be attributed to possible under- estimation by the ‘mean’ and consequently related satis- faction grading. When we raised the bar to capture at least 75% of stu- dents being satisfied, this lowered the proportion of sat- isfaction level for most of the items. There were 4/13 exceptions; they recorded acceptable response. These four items were attractiveness and comfort of classrooms; increase in investigative confidence; communicating findings; and learning to work in gro up activities. A higher still movement of students’ satisfaction from 75% to 80%, pushed down the satisfaction level in all th e four “acceptable” items to “improvement required”. To achieve this enhanced target, all 20 items need further improvement. This demands focus by the college and university administrators. 3.2. College of Nursing Among students of this college also, regardless of the criterion employed to grade students’ perception, high quality satisfaction did not emerge for any of the 20 items (Table 1). When “mean” grading was used, the students rated all 20 items as “acceptable”. Their rating remained the same, by coincidence, with median grading criterion (Figure 1(b)). A higher movement of students’ satisfaction from 50% to 75%, altered their rating from “acceptable” to “im- provement required” for 5/20 items. The five are attract- tiveness and comfort of classrooms; the library (staff, available materials and opening hours); and facilities for extracurricular activities. Again, a higher movement of the students’ satisfaction from75% to 80%, changed their rating for the remaining 16/20 items also from “acceptable” to “improvement required”. Again, to achieve this enhanced target in this college also, all 20 items need further improvement and require focus by the college and university administra- tors. 4. Summary and Conclusions The knowledge about the learning environment of both colleges and university might be helpful in making mea- ningful inferences from SES results as well as their im- plications. It is known that, environmental comparative observations have added merit in providing insight and useful clues for policy planners. Hence, they are briefly described below. 4.1. Environments of Colleges The College of Nursing was established on 8 June 2002. It is for exclusively female students. Its academic pro- gram, “BSc Nursing”, began from 2002. Developmental activities progressed at a comparatively fast pace. They were completed in optimum time. Six months after the Nursing College, the Dentistry College was also established on 14 December 2002. In direct contrast with the Nursing College, it admits only male students. Its academic program, “Bachelor of Den- tal Surgery”, also began in the year 2002. The general perception has been that developmental tasks in this col- lege move at a comparatively slower pace. In summary, these two colleges sub-serve two differ- ent learning environments. In these circumstances, com- parison of their SES results is best avoided. But, while doing so, this article aimed to highlight the need of pro- gram as well as college specific improvement plan. 4.2. Environmental Comparison In both the colleges (dentistry as well as nursing), re- gardless of grading criterion (Table 1), students did not report high quality perception for any of the 20 items in SES questionnaire. To my surprise, in none of these two colleges, until now even 50% students do not agree to any of these items. With a target of 50% satisfaction among the students, in the college of dentistry, only 65% (13/20) of the items could emerge with “acceptable” perception. On the other hand, in the college nursing, all the items (100%) hold this related perception. With an increase in target from 50% to 75% satisfaction among the students, in college of dentistry, only 20% (4/20) items retained “acceptable” perception where as remain- ing went down to “improvement required”. On the other hand, in the college of nursing, 75% (15/20) of the items still retained the perception “acceptable”. With a further increase in target from 75% to 80% satisfaction among the related students, all the ite ms (100%) in both the col- Copyright © 2010 SciRes. JSSM 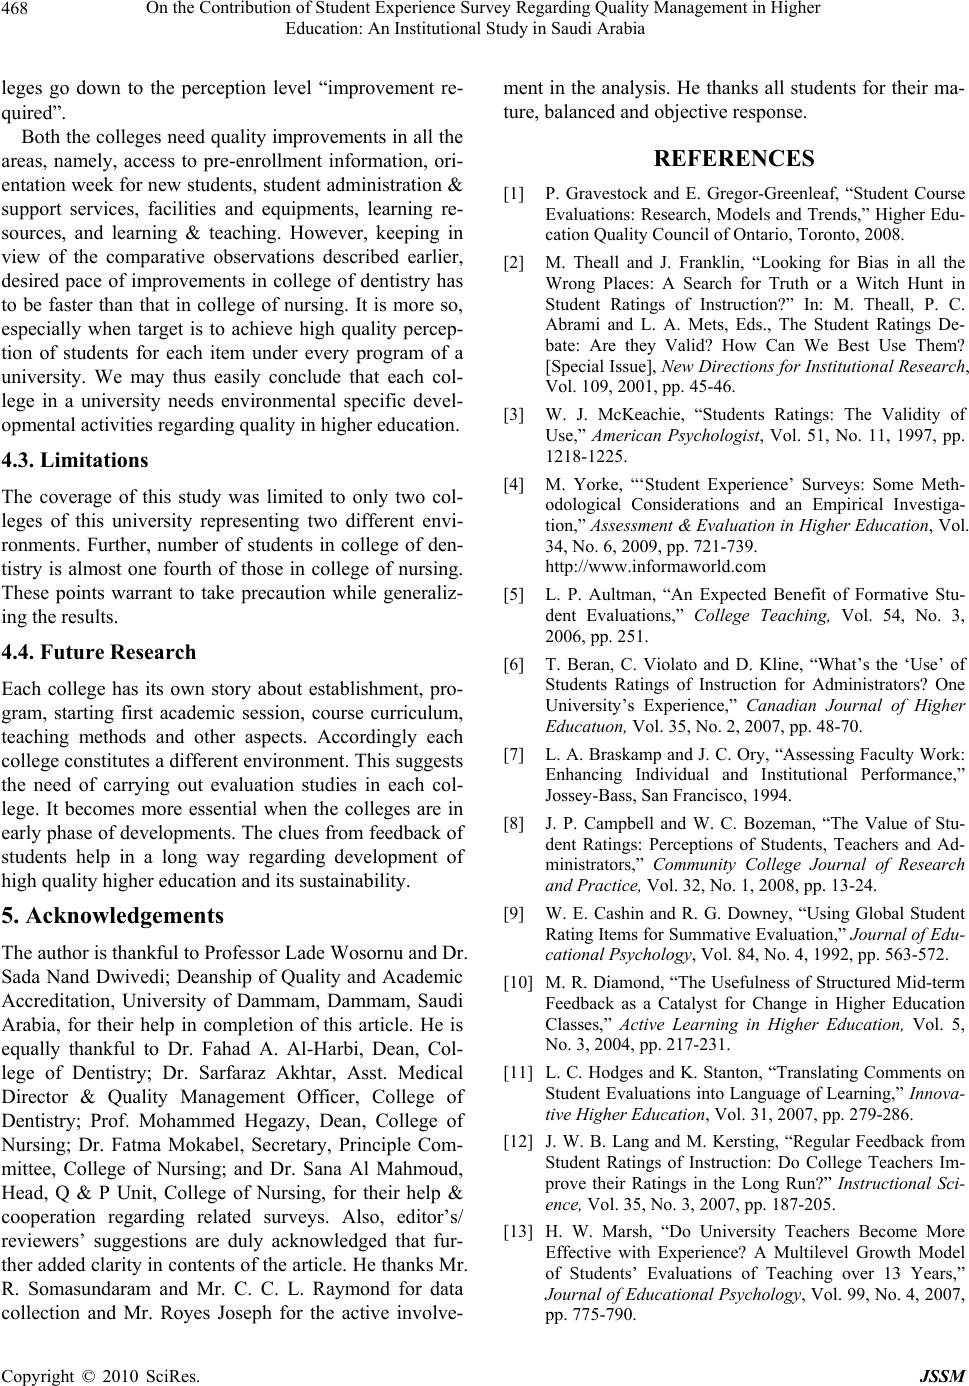 On the Contribution of Student Experience Survey Regarding Quality Management in Higher 468 Education: An Institutional Study in Saudi Arabia leges go down to the perception level “improvement re- quired”. Both the college s need quality improvements in all the areas, namely, access to pre-enrollment information, ori- entation week for n ew students, studen t administration & support services, facilities and equipments, learning re- sources, and learning & teaching. However, keeping in view of the comparative observations described earlier, desired pace of improvements in college of dentistry has to be faster than that in college of nursing. It is more so, especially when target is to achieve high quality percep- tion of students for each item under every program of a university. We may thus easily conclude that each col- lege in a university needs environmental specific devel- opmental activities regarding quality in higher education. 4.3. Limitations The coverage of this study was limited to only two col- leges of this university representing two different envi- ronments. Further, number of students in college of den- tistry is almost one fourth of those in college of nursing. These points warrant to take precaution while generaliz- ing the results. 4.4. Future Research Each college has its own story about establishment, pro- gram, starting first academic session, course curriculum, teaching methods and other aspects. Accordingly each college constitutes a differen t environ ment. This su ggests the need of carrying out evaluation studies in each col- lege. It becomes more essential when the colleges are in early phase of developments. The clues from feedback of students help in a long way regarding development of high quality higher education and its sustainability. 5. Acknowledgements The author is thankful to Professor Lade Wosornu and Dr. Sada Nand Dwivedi; Deanship of Quality and Academic Accreditation, University of Dammam, Dammam, Saudi Arabia, for their help in completion of this article. He is equally thankful to Dr. Fahad A. Al-Harbi, Dean, Col- lege of Dentistry; Dr. Sarfaraz Akhtar, Asst. Medical Director & Quality Management Officer, College of Dentistry; Prof. Mohammed Hegazy, Dean, College of Nursing; Dr. Fatma Mokabel, Secretary, Principle Com- mittee, College of Nursing; and Dr. Sana Al Mahmoud, Head, Q & P Unit, College of Nursing, for their help & cooperation regarding related surveys. Also, editor’s/ reviewers’ suggestions are duly acknowledged that fur- ther added clarity in co ntents of the article. He thank s Mr. R. Somasundaram and Mr. C. C. L. Raymond for data collection and Mr. Royes Joseph for the active involve- ment in the analysis. He thanks all students for their ma- ture, balanced and objective response. REFERENCES [1] P. Gravestock and E. Gregor-Greenleaf, “Student Course Evaluations: Research, Models and Trends,” Higher Edu- cation Quality Council of Ontario, Toronto, 2008. [2] M. Theall and J. Franklin, “Looking for Bias in all the Wrong Places: A Search for Truth or a Witch Hunt in Student Ratings of Instruction?” In: M. Theall, P. C. Abrami and L. A. Mets, Eds., The Student Ratings De- bate: Are they Valid? How Can We Best Use Them? [Special Issue], New Directions for Institutional Research, Vol. 109, 2001, pp. 45-46. [3] W. J. McKeachie, “Students Ratings: The Validity of Use,” American Psychologist, Vol. 51, No. 11, 1997, pp. 1218-1225. [4] M. Yorke, “‘Student Experience’ Surveys: Some Meth- odological Considerations and an Empirical Investiga- tion,” Assessment & Evaluation in Higher Education, Vol. 34, No. 6, 2009, pp. 721-739. http://www.informaworld.com [5] L. P. Aultman, “An Expected Benefit of Formative Stu- dent Evaluations,” College Teaching, Vol. 54, No. 3, 2006, pp. 251. [6] T. Beran, C. Violato and D. Kline, “What’s the ‘Use’ of Students Ratings of Instruction for Administrators? One University’s Experience,” Canadian Journal of Higher Educatuon, Vol. 35, No. 2, 2007, pp. 48-70. [7] L. A. Braskamp and J. C. Ory , “Assessing Faculty Work: Enhancing Individual and Institutional Performance,” Jossey-Ba ss, San Francisco, 1994. [8] J. P. Campbell and W. C. Bozeman, “The Value of Stu- dent Ratings: Perceptions of Students, Teachers and Ad- ministrators,” Community College Journal of Research and Practice, Vol. 32, No. 1, 2008, pp. 13-24. [9] W. E. Cashin and R. G. Downey, “Using Global Student Rating Items for Summative Evaluation,” Journal of Edu- cational Psychology, Vol. 84, No. 4, 1992, pp. 563-572. [10] M. R. Diamond, “The Usefulness of Structured Mid-term Feedback as a Catalyst for Change in Higher Education Classes,” Active Learning in Higher Education, Vol. 5, No. 3, 2004, pp. 217-231. [11] L. C. Hodges and K. Stanton, “Translating Comments on Student Evaluations into Language of Learning,” Innova- tive Higher Education, Vol. 31, 2007, pp. 279-286. [12] J. W. B. Lang and M. Kersting, “Regular Feedback from Student Ratings of Instruction: Do College Teachers Im- prove their Ratings in the Long Run?” Instructional Sci- ence, Vol. 35, No. 3, 2007, pp. 187-205. [13] H. W. Marsh, “Do University Teachers Become More Effective with Experience? A Multilevel Growth Model of Students’ Evaluations of Teaching over 13 Years,” Journal of Educational Psychology, Vol. 99, No. 4, 2007, pp. 775-790. Copyright © 2010 SciRes. JSSM  On the Contribution of Student Experience Survey Regarding Quality Management in Higher Education: An Institutional Study in Saudi Arabia Copyright © 2010 SciRes. JSSM 469 [14] R. J. Menges, “Shortcomings of Research on Evaluating and Improving Teaching in Higher Education,” In: K. E. Ryan, Eds., Evaluating Teaching in Higher Education: A Vision for the Future [Special Issue], New Directions for Teaching and Learning, Vol. 83, 2000, pp. 5-11. [19] W. E. Cashin, “Students do Rate Different Academic Fields Differently,” In: M. Theall and J. Franklin Eds., Student Ratings of Instruction: Issues for Improving Practice [Special Issues], New Directions for Teaching and Learning, Vol. 43, 1990, pp. 113 -121. [20] A. Al Rubaish, L. Wosornu and S. N. Dwivedi, “Using Deductions from Assessment Studies towards Further- ance of the Academic Program: an Empirical Appraisal of an Institutional Student Course Evaluations,” The Inter- national Journal for Academic Development (Communi- cated). [15] A. R. Penny and R. Coe, “Effectiveness of Consultations on Student Ratings Feedback: A Meta-Analysis,” Review of Educational Research, Vol. 74, No. 2, 2004, pp. 215-253. [16] R. E. Wright, “Student Evaluations of Faculty: Concerns Raised in the Literature, and Possible Solutions,” College Student Journal, Vol. 40, No. 2, 2008, pp. 417-422. [21] R. Gob, C. Mc Collin and M.F. Rmalhoto, “Ordinal Me- thodology in the Analysis of Likert Scales,” Qualilty & Quantity, Vol. 41, No. 5, 2007, pp. 601-626. [17] F. Zabaleta, “The Use and Misuse of Student Evaluation of Teaching,” Teaching in Higher Education, Vol. 12, No. 1, 2007, pp. 55-76. [22] K. R. Sundaram, S. N. Dwivedi and V. Sreenivas, “Med- ical Statistics: Principles & Methods,” BI Publications Pvt. Ltd., New Delhi, 2009. [18] A. S. Aldosary, “Students’ Academic Satisfaction: The Case of CES at KFUPM,” JKAU: Engineering Science, Vol. 11, No. 1, 1999, pp. 99-107. Appendix 1: Students experience survey questionnaire Items 1) It was easy to find information about UoD and its Colleges before I enrolled here for the first time. 2) When I first started at UoD, the orientation week for new students was helpful for me. 3) There is sufficient opportunity at UoD, to get advice on my studies and my future career. 4) Procedures for enrolling in courses are simple and efficient. 5) Classrooms (including lecture rooms, laboratories etc.) are attractive and comfortable. 6) Student computing facilities are sufficient for my needs. 7) The library staff is helpful to me when I need assis- tance. 8) I am satisfied with the quality and extent of materi- als available for me in the library. 9) The library is open at convenient times. 10) Adequate facilities are available for extracurricular activities (including spo rting and recreational activi- ties). 11) Adequate facilities are available at UoD for reli- gious observances. 12) Most of the faculty with whom I work at UoD are really interested in my progress. 13) Faculty at UoD are fair in their treatment of stu- dents. 14) My courses and assignments encourage me to in- vestigate new ideas and express my own opinions. 15) As a result of my studies my confidence in my abil- ity to investigate and solve new and unusual prob- lems is increasing. 16) My ability to effectively communicate the findings of such investigations is improving as a result of my studies. 17) My program of studies is stimulating my interest in further learning. 18) The knowledge and skills I am learning will be valuable for my future career. 19) I am learning to work effectively in group activities. 20) Overall, I am enjoying my life as a student at UoD. |