Paper Menu >>
Journal Menu >>
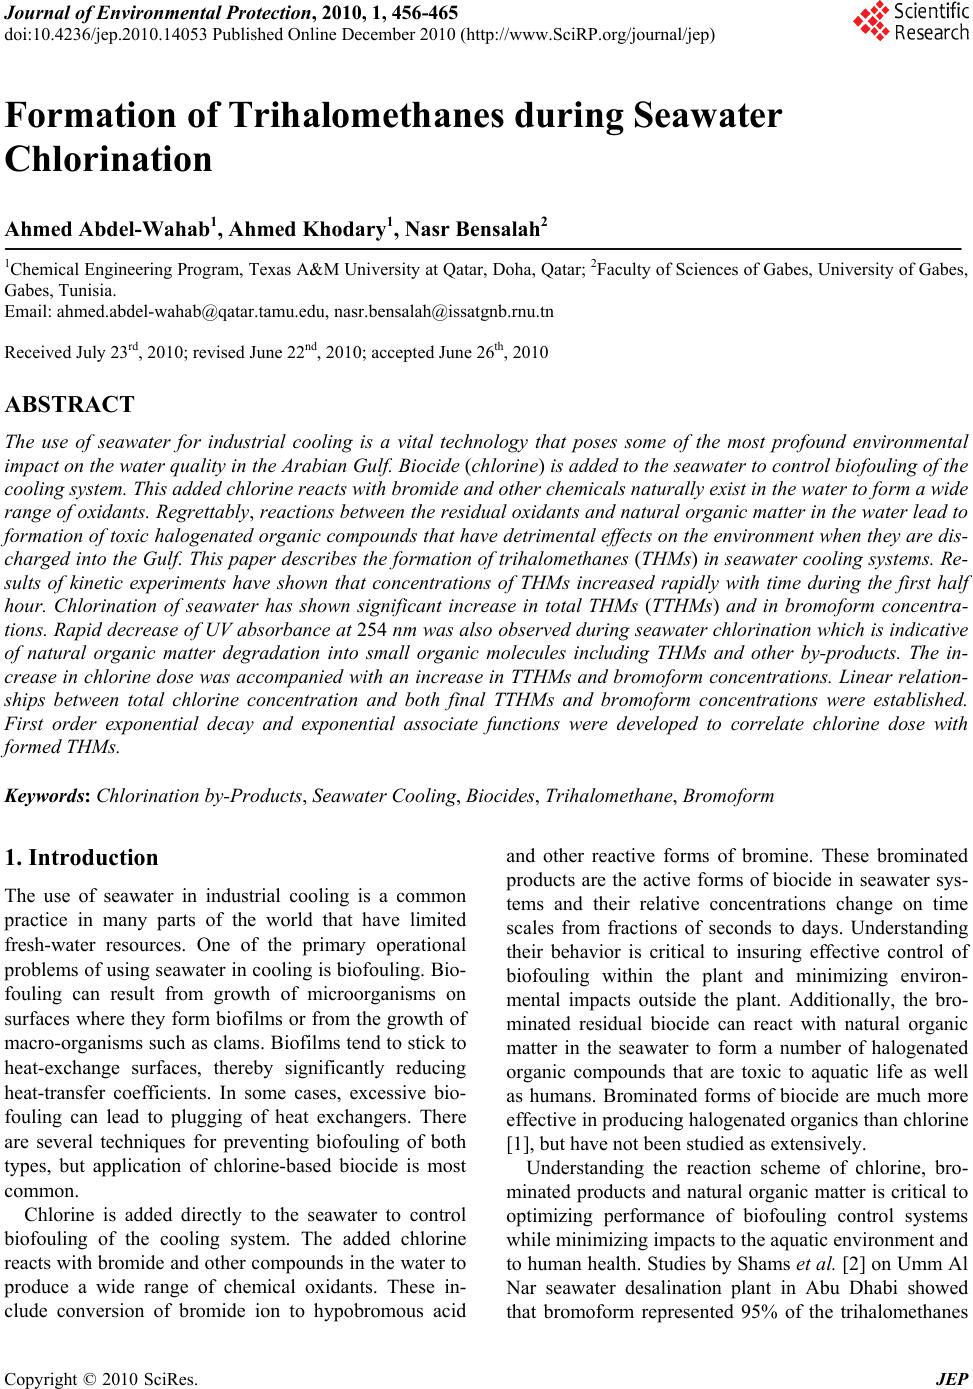 Journal of Environmental Protection, 2010, 1, 456-465 doi:10.4236/jep.2010.14053 Published Online December 2010 (http://www.SciRP.org/journal/jep) Copyright © 2010 SciRes. JEP Formation of Trihalomethanes during Seawater Chlorination Ahmed Abdel-Wahab1, Ahmed Khodary1, Nasr Bensalah2 1Chemical Engineering Program, Texas A&M University at Qatar, Doha, Qatar; 2Faculty of Sciences of Gabes, University of Gabes, Gabes, Tunisia. Email: ahmed.abdel-wahab@qatar.tamu.edu, nasr.bensalah@issatgnb.rnu.tn Received July 23rd, 2010; revised June 22nd, 2010; accepted June 26th, 2010 ABSTRACT The use of seawater for industrial cooling is a vital technology that poses some of the most profound environmental impact on the water quality in the Arabian Gulf. Biocide (chlorine) is added to the seawater to control biofouling of the cooling system. This added chlorine reacts with bromide and other chemicals naturally exist in the water to form a wide range of oxidants. Regrettably, reactions between the residual oxidants and natural organic matter in the water lead to formation of toxic halogenated organic compounds that have detrimental effects on the environment when they are dis- charged into the Gulf. This paper describes the formation of trihalomethanes (THMs) in seawater cooling systems. Re- sults of kinetic experiments have shown that concentrations of THMs increased rapidly with time during the first half hour. Chlorination of seawater has shown significant increase in total THMs (TTHMs) and in bromoform concentra- tions. Rapid decrease of UV absorbance at 254 nm was also observed during seawater chlorination which is indicative of natural organic matter degradation into small organic molecules including THMs and other by-products. The in- crease in chlorine dose was accompanied with an increase in TTHMs and bromoform concentrations. Linear relation- ships between total chlorine concentration and both final TTHMs and bromoform concentrations were established. First order exponential decay and exponential associate functions were developed to correlate chlorine dose with formed THMs. Keywords: Chlorination by-Products, Seawater Cooling, Biocides, Trihalomethane, Bromoform 1. Introduction The use of seawater in industrial cooling is a common practice in many parts of the world that have limited fresh-water resources. One of the primary operational problems of using seawater in cooling is biofouling. Bio- fouling can result from growth of microorganisms on surfaces where they form biofilms or from the growth of macro-organisms such as clams. Biofilms tend to stick to heat-exchange surfaces, thereby significantly reducing heat-transfer coefficients. In some cases, excessive bio- fouling can lead to plugging of heat exchangers. There are several techniques for preventing biofouling of both types, but application of chlorine-based biocide is most common. Chlorine is added directly to the seawater to control biofouling of the cooling system. The added chlorine reacts with bromide and other compounds in the water to produce a wide range of chemical oxidants. These in- clude conversion of bromide ion to hypobromous acid and other reactive forms of bromine. These brominated products are the active forms of biocide in seawater sys- tems and their relative concentrations change on time scales from fractions of seconds to days. Understanding their behavior is critical to insuring effective control of biofouling within the plant and minimizing environ- mental impacts outside the plant. Additionally, the bro- minated residual biocide can react with natural organic matter in the seawater to form a number of halogenated organic compounds that are toxic to aquatic life as well as humans. Brominated forms of biocide are much more effective in producing halogenated organics than chlorine [1], but have not been studied as extensively. Understanding the reaction scheme of chlorine, bro- minated products and natural organic matter is critical to optimizing performance of biofouling control systems while minimizing impacts to the aquatic environment and to human health. Studies by Shams et al. [2] on Umm Al Nar seawater desalination plant in Abu Dhabi showed that bromoform represented 95% of the trihalomethanes 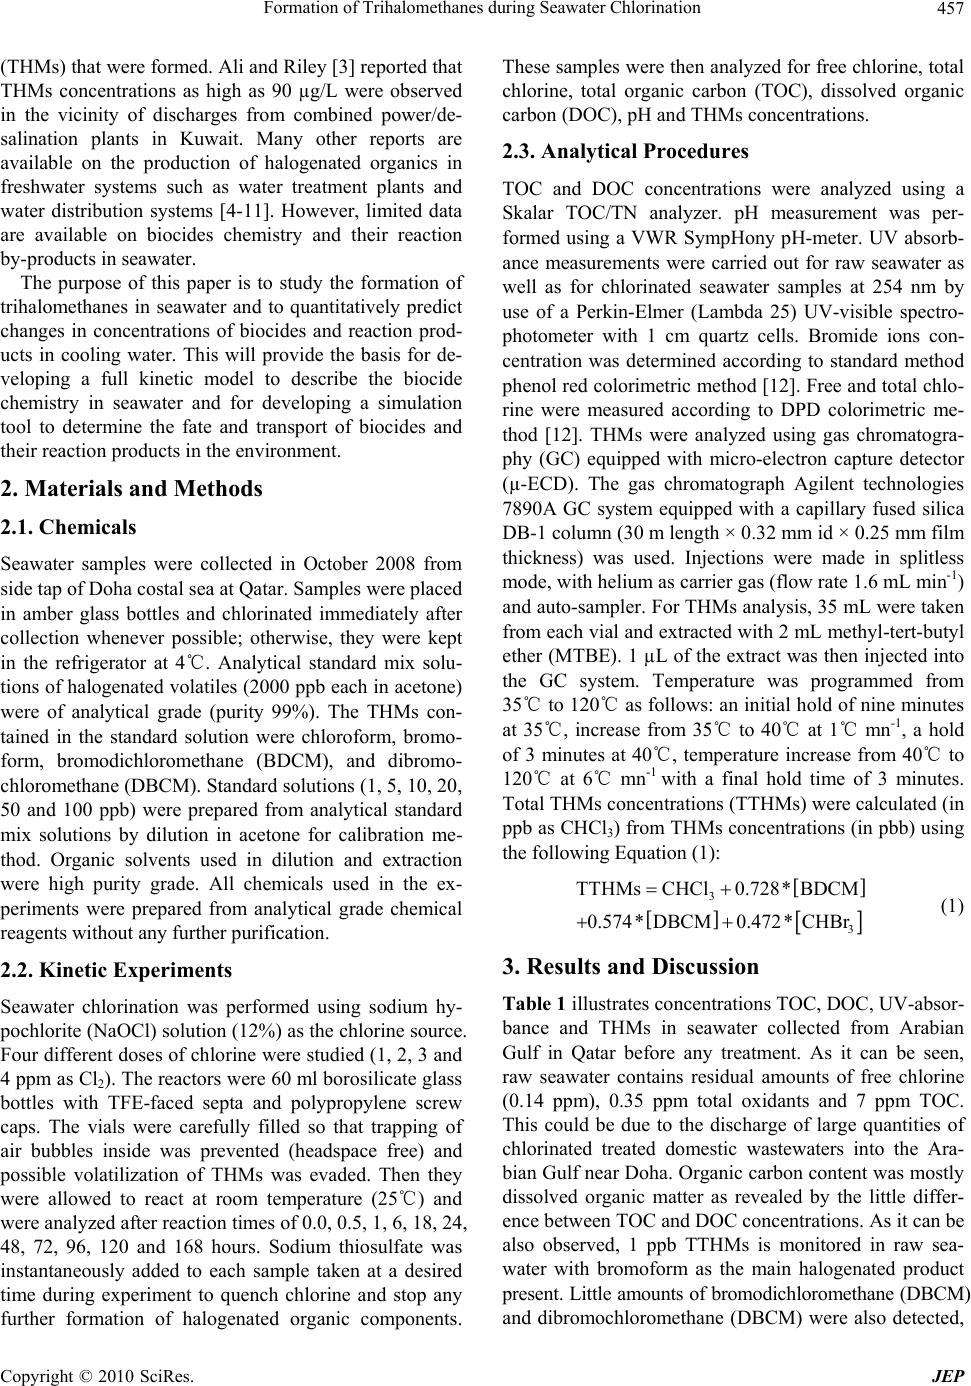 Formation of Trihalomethanes during Seawater Chlorination Copyright © 2010 SciRes. JEP 457 (THMs) that were formed. Ali and Riley [3] reported that THMs concentrations as high as 90 µg/L were observed in the vicinity of discharges from combined power/de- salination plants in Kuwait. Many other reports are available on the production of halogenated organics in freshwater systems such as water treatment plants and water distribution systems [4-11]. However, limited data are available on biocides chemistry and their reaction by-products in seawater. The purpose of this paper is to study the formation of trihalomethanes in seawater and to quantitatively predict changes in concentrations of biocides and reaction prod- ucts in cooling water. This will provide the basis for de- veloping a full kinetic model to describe the biocide chemistry in seawater and for developing a simulation tool to determine the fate and transport of biocides and their reaction products in the environment. 2. Materials and Methods 2.1. Chemicals Seawater samples were collected in October 2008 from side tap of Doha costal sea at Qatar. Samples were placed in amber glass bottles and chlorinated immediately after collection whenever possible; otherwise, they were kept in the refrigerator at 4℃. Analytical standard mix solu- tions of halogenated volatiles (2000 ppb each in acetone) were of analytical grade (purity 99%). The THMs con- tained in the standard solution were chloroform, bromo- form, bromodichloromethane (BDCM), and dibromo- chloromethane (DBCM). Standard solutions (1, 5, 10, 20, 50 and 100 ppb) were prepared from analytical standard mix solutions by dilution in acetone for calibration me- thod. Organic solvents used in dilution and extraction were high purity grade. All chemicals used in the ex- periments were prepared from analytical grade chemical reagents without any further purification. 2.2. Kinetic Experiments Seawater chlorination was performed using sodium hy- pochlorite (NaOCl) solution (12%) as the chlorine source. Four different doses of chlorine were studied (1, 2, 3 and 4 ppm as Cl2). The reactors were 60 ml borosilicate glass bottles with TFE-faced septa and polypropylene screw caps. The vials were carefully filled so that trapping of air bubbles inside was prevented (headspace free) and possible volatilization of THMs was evaded. Then they were allowed to react at room temperature (25℃) and were analyzed after reaction times of 0.0, 0.5, 1, 6, 18, 24, 48, 72, 96, 120 and 168 hours. Sodium thiosulfate was instantaneously added to each sample taken at a desired time during experiment to quench chlorine and stop any further formation of halogenated organic components. These samples were then analyzed for free chlorine, total chlorine, total organic carbon (TOC), dissolved organic carbon (DOC), pH and THMs concentrations. 2.3. Analytical Procedures TOC and DOC concentrations were analyzed using a Skalar TOC/TN analyzer. pH measurement was per- formed using a VWR SympHony pH-meter. UV absorb- ance measurements were carried out for raw seawater as well as for chlorinated seawater samples at 254 nm by use of a Perkin-Elmer (Lambda 25) UV-visible spectro- photometer with 1 cm quartz cells. Bromide ions con- centration was determined according to standard method phenol red colorimetric method [12]. Free and total chlo- rine were measured according to DPD colorimetric me- thod [12]. THMs were analyzed using gas chromatogra- phy (GC) equipped with micro-electron capture detector (µ-ECD). The gas chromatograph Agilent technologies 7890A GC system equipped with a capillary fused silica DB-1 column (30 m length × 0.32 mm id × 0.25 mm film thickness) was used. Injections were made in splitless mode, with helium as carrier gas (flow rate 1.6 mL min-1) and auto-sampler. For THMs analysis, 35 mL were taken from each vial and extracted with 2 mL methyl-tert-butyl ether (MTBE). 1 µL of the extract was then injected into the GC system. Temperature was programmed from 35℃ to 120℃ as follows: an initial hold of nine minutes at 35℃, increase from 35℃ to 40℃ at 1℃ mn-1, a hold of 3 minutes at 40℃, temperature increase from 40℃ to 120℃ at 6℃ mn-1 with a final hold time of 3 minutes. Total THMs concentrations (TTHMs) were calculated (in ppb as CHCl3) from THMs concentrations (in pbb) using the following Equation (1): 3 3 TTHMsCHCl0.728* BDCM 0.574* DBCM0.472* CHBr (1) 3. Results and Discussion Table 1 illustrates concentrations TOC, DOC, UV-absor- bance and THMs in seawater collected from Arabian Gulf in Qatar before any treatment. As it can be seen, raw seawater contains residual amounts of free chlorine (0.14 ppm), 0.35 ppm total oxidants and 7 ppm TOC. This could be due to the discharge of large quantities of chlorinated treated domestic wastewaters into the Ara- bian Gulf near Doha. Organic carbon content was mostly dissolved organic matter as revealed by the little differ- ence between TOC and DOC concentrations. As it can be also observed, 1 ppb TTHMs is monitored in raw sea- water with bromoform as the main halogenated product present. Little amounts of bromodichloromethane (DBCM) and dibromochloromethane (DBCM) were also detected, 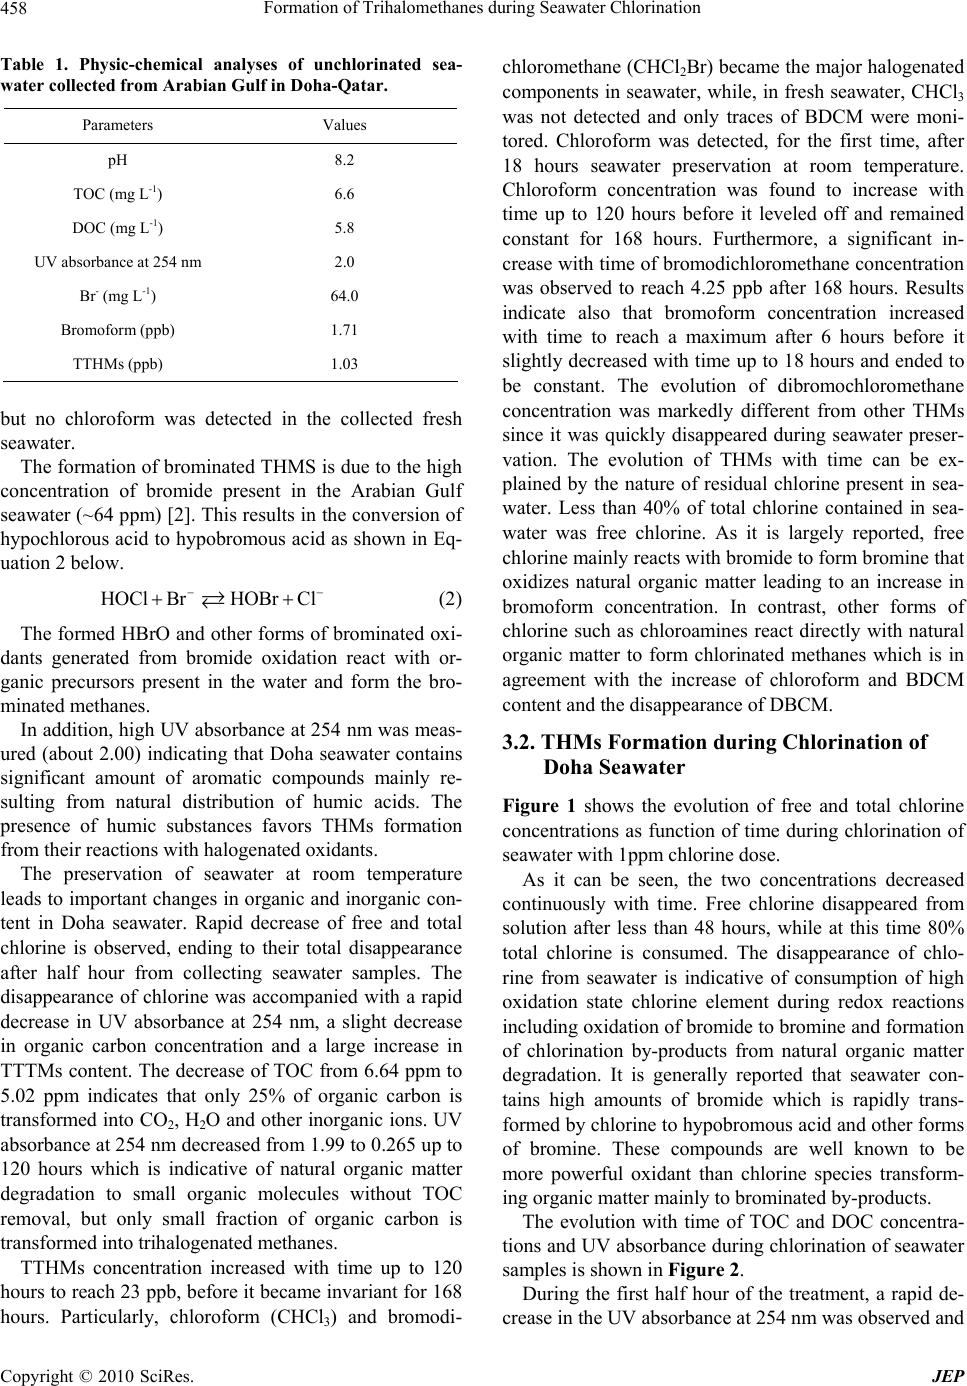 Formation of Trihalomethanes during Seawater Chlorination Copyright © 2010 SciRes. JEP 458 Table 1. Physic-chemical analyses of unchlorinated sea- water collected from Arabian Gulf in Doha-Qatar. Parameters Values pH 8.2 TOC (mg L-1) 6.6 DOC (mg L-1) 5.8 UV absorbance at 254 nm 2.0 Br- (mg L-1) 64.0 Bromoform (ppb) 1.71 TTHMs (ppb) 1.03 but no chloroform was detected in the collected fresh seawater. The formation of brominated THMS is due to the high concentration of bromide present in the Arabian Gulf seawater (~64 ppm) [2]. This results in the conversion of hypochlorous acid to hypobromous acid as shown in Eq- uation 2 below. HOCl BrHOBrCl (2) The formed HBrO and other forms of brominated oxi- dants generated from bromide oxidation react with or- ganic precursors present in the water and form the bro- minated methanes. In addition, high UV absorbance at 254 nm was meas- ured (about 2.00) indicating that Doha seawater contains significant amount of aromatic compounds mainly re- sulting from natural distribution of humic acids. The presence of humic substances favors THMs formation from their reactions with halogenated oxidants. The preservation of seawater at room temperature leads to important changes in organic and inorganic con- tent in Doha seawater. Rapid decrease of free and total chlorine is observed, ending to their total disappearance after half hour from collecting seawater samples. The disappearance of chlorine was accompanied with a rapid decrease in UV absorbance at 254 nm, a slight decrease in organic carbon concentration and a large increase in TTTMs content. The decrease of TOC from 6.64 ppm to 5.02 ppm indicates that only 25% of organic carbon is transformed into CO2, H2O and other inorganic ions. UV absorbance at 254 nm decreased from 1.99 to 0.265 up to 120 hours which is indicative of natural organic matter degradation to small organic molecules without TOC removal, but only small fraction of organic carbon is transformed into trihalogenated methanes. TTHMs concentration increased with time up to 120 hours to reach 23 ppb, before it became invariant for 168 hours. Particularly, chloroform (CHCl3) and bromodi- chloromethane (CHCl2Br) became the major halogenated components in seawater, while, in fresh seawater, CHCl3 was not detected and only traces of BDCM were moni- tored. Chloroform was detected, for the first time, after 18 hours seawater preservation at room temperature. Chloroform concentration was found to increase with time up to 120 hours before it leveled off and remained constant for 168 hours. Furthermore, a significant in- crease with time of bromodichloromethane concentration was observed to reach 4.25 ppb after 168 hours. Results indicate also that bromoform concentration increased with time to reach a maximum after 6 hours before it slightly decreased with time up to 18 hours and ended to be constant. The evolution of dibromochloromethane concentration was markedly different from other THMs since it was quickly disappeared during seawater preser- vation. The evolution of THMs with time can be ex- plained by the nature of residual chlorine present in sea- water. Less than 40% of total chlorine contained in sea- water was free chlorine. As it is largely reported, free chlorine mainly reacts with bromide to form bromine that oxidizes natural organic matter leading to an increase in bromoform concentration. In contrast, other forms of chlorine such as chloroamines react directly with natural organic matter to form chlorinated methanes which is in agreement with the increase of chloroform and BDCM content and the disappearance of DBCM. 3.2. THMs Formation during Chlorination of Doha Seawater Figure 1 shows the evolution of free and total chlorine concentrations as function of time during chlorination of seawater with 1ppm chlorine dose. As it can be seen, the two concentrations decreased continuously with time. Free chlorine disappeared from solution after less than 48 hours, while at this time 80% total chlorine is consumed. The disappearance of chlo- rine from seawater is indicative of consumption of high oxidation state chlorine element during redox reactions including oxidation of bromide to bromine and formation of chlorination by-products from natural organic matter degradation. It is generally reported that seawater con- tains high amounts of bromide which is rapidly trans- formed by chlorine to hypobromous acid and other forms of bromine. These compounds are well known to be more powerful oxidant than chlorine species transform- ing organic matter mainly to brominated by-products. The evolution with time of TOC and DOC concentra- tions and UV absorbance during chlorination of seawater samples is shown in Figure 2. During the first half hour of the treatment, a rapid de- crease in the UV absorbance at 254 nm was observed and  Formation of Trihalomethanes during Seawater Chlorination Copyright © 2010 SciRes. JEP 459 Figure 1. Evolution with time of free and total chlorine concentrations during Doha seawater chlorination with 1 ppm chlorine at room temperature (25℃) and natural pH (pH = 8.3). Figure 2. Evolution with time of TOC, DOC and UV ab- sorbance at 254 nm during Doha seawater chlorination with 1 ppm chlorine at room temperature (25℃) and natural pH (pH = 8.3). then it hung about 0.4-0.5 after 6 hours. TOC and DOC undergone a little decrease at the beginning of seawater chlorination up to 72 hours and they became invariant for the rest of experiment. These results are indicative of the degradation of the natural organic matter during Doha seawater chlorination to form several chlorination by- products including THMs, haloacetic acids and other volatile halogenated compounds (haloacetonitriles and haloketones). Chlorination of fresh seawater with 1 ppm chlorine dose has shown a significant increase in TTHMs concen- tration. Figure 3 presents the evolution with time of THMs concentrations during chlorination of Doha sea- water with 1ppm chlorine dose. As it can be seen, TTHMs Figure 3. Evolution with time of THMs concentrations during Doha seawater chlorination with 1 ppm chlorine at room temperature (25℃) and natural pH (pH = 8.3). concentration increased rapidly with time and reached a plateau at 0.5 µmol L-1 (50 ppb) after 72 hours chlorina- tion with only 1ppm chlorine dose which indicates that a part of the natural organic matter contained in seawater was transformed into halogenated by-products. Bromo- form, chloroform, DBCM and BDCM were identified as chlorination by-products in Doha seawater with molecu- lar fractions of 40.3, 31.4, 22.8 and 5.4 %, respectively. THMs concentrations increased with time during chlo- rination, but in different manner. Bromoform concentra- tion has shown the most rapid increase to remaining con- stant at 0.2 µmol L-1 after half hour. The increase with time in BDCM and DBCM concentrations is similar, but less rapid than that of bromoform concentration since they reached highest concentrations after 18 and 72 hours from the beginning of experiments. Chloroform concen- tration evolution presented different pattern than other THMs; chloroform is not detectable at the beginning, but after 18 hours chlorination its concentration increased with time up to 120 hours and then leveled off and re- mained constant for the rest of experiment. It is remark- able that at the end of experiments CHBr3 and CHCl3 have comparable molar concentrations which are indica- tive of a competitive formation of chlorinated and bro- minated chlorination by-products from natural organic matter oxidation contained in Doha seawater by 1ppm chlorine dose. Regarding these results, it can be perceived that both THMs concentrations and their speciation were noticea- bly different from those recently reported in literature concerning seawater chlorination by-products. Fabbricino and Korshin [13], reported that THMs concentration de- pends largely on seawater quality and TOC content, but in all cases they found that bromoform was the predomi-  Formation of Trihalomethanes during Seawater Chlorination Copyright © 2010 SciRes. JEP 460 nant trihalomethane detected during chlorination with 1ppm chlorine dose of Pacific Ocean and Seattle (Wash- ington State, USA) coastal seawaters. Fayad and Iqbal [14] have shown that the nature of chlorination by-pro- ducts resulting from seawater treatment depend on the chemical structure of humic materials present in seawater. They also identified bromoform and DBCM as main chlorination by-products during treatment with chlorine doses 0.8-1.6 ppm of Halfmoon Bay beach seawater in Saudi Arabia. According to the results obtained here and those reported in literature [4-14], it can be concluded that THMs levels formed during seawater chlorination (with low chlorine dose) depend on different parameters including seawater location (costal, Ocean and depth), TOC concentration, organic matter chemical structure, and bromide concentration. The influence of chlorine dose on the evolution of THMs concentrations during chlorination of Doha sea- water is illustrated in Figure 4. As it can be observed, only bromoform concentration and predominance were largely affected by chlorine dose change. Increasing chlorine dose from 1 ppm to 4 ppm, bromoform concen- tration increased also from 50 ppb to 260 ppb and its molar fraction in TTHMs passed from 4.6% with residual chlorine to 75.4% with 4 ppm chlorine (see Table 2). As it can be also seen, seawater chlorination had no significant influence on concentrations of chloroform, BDCM and DBCM, but their molar fractions were largely decreased. These observations show that the contribution of bromine in the formation of THMs in chlorinated (a) (b) (c) (d) Figure 4. Influence of chlorine dose on the evolution with time of THMs concentrations during Doha seawater chlorination at room temperature (25℃) and natural pH (pH = 8.3); (a) bromoform; (b) chloroform; (c) DBCM and (d) BDCM. 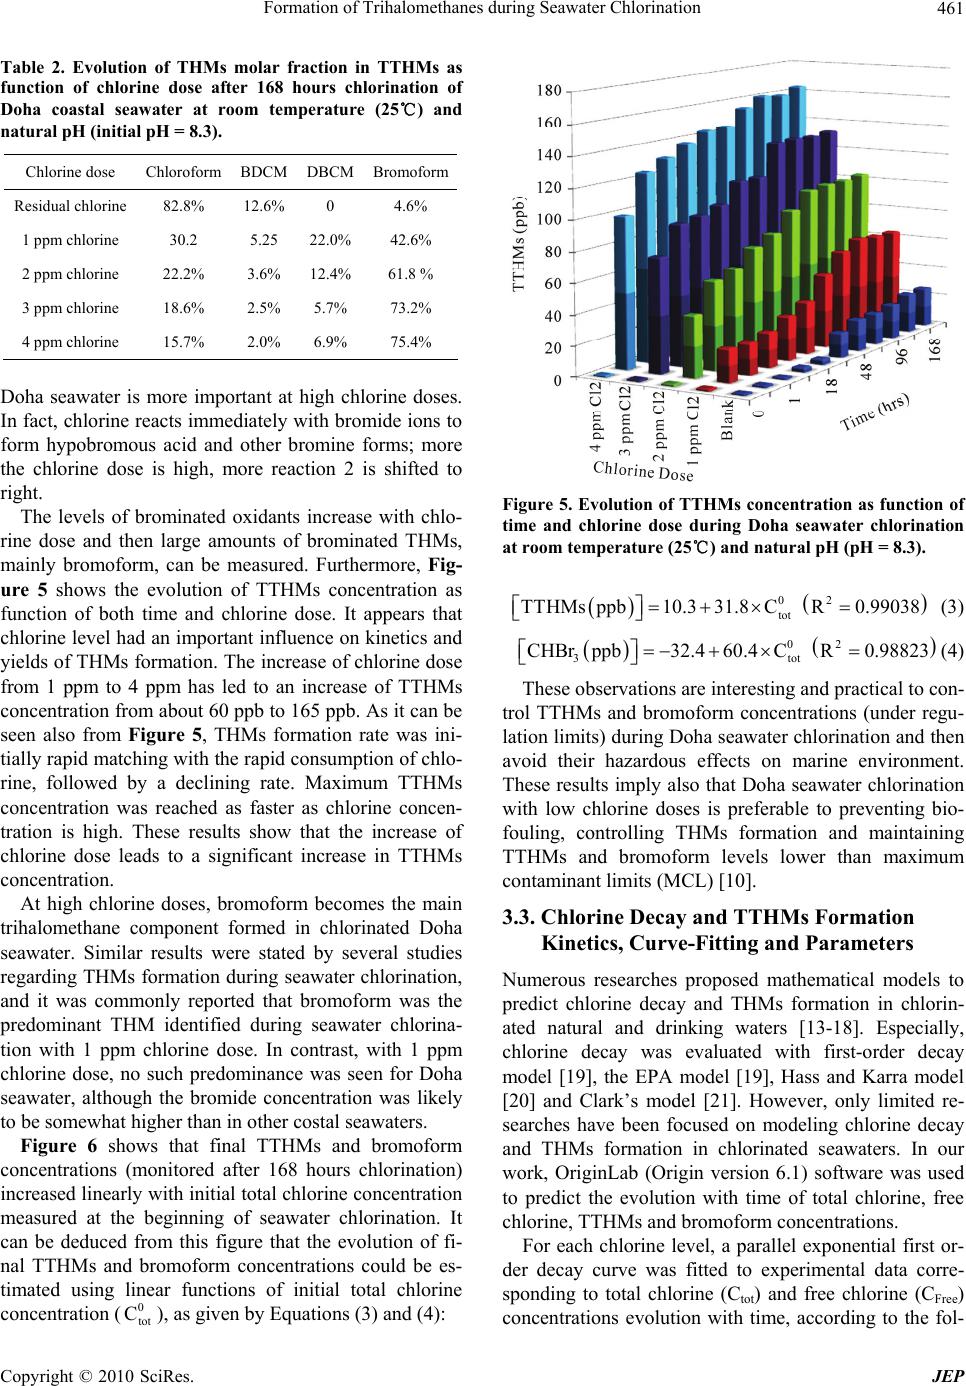 Formation of Trihalomethanes during Seawater Chlorination Copyright © 2010 SciRes. JEP 461 Table 2. Evolution of THMs molar fraction in TTHMs as function of chlorine dose after 168 hours chlorination of Doha coastal seawater at room temperature (25℃) and natural pH (initial pH = 8.3). Chlorine dose Chloroform BDCM DBCM Bromoform Residual chlorine 82.8% 12.6% 0 4.6% 1 ppm chlorine 30.2 5.25 22.0% 42.6% 2 ppm chlorine 22.2% 3.6% 12.4% 61.8 % 3 ppm chlorine 18.6% 2.5% 5.7% 73.2% 4 ppm chlorine 15.7% 2.0% 6.9% 75.4% Doha seawater is more important at high chlorine doses. In fact, chlorine reacts immediately with bromide ions to form hypobromous acid and other bromine forms; more the chlorine dose is high, more reaction 2 is shifted to right. The levels of brominated oxidants increase with chlo- rine dose and then large amounts of brominated THMs, mainly bromoform, can be measured. Furthermore, Fig- ure 5 shows the evolution of TTHMs concentration as function of both time and chlorine dose. It appears that chlorine level had an important influence on kinetics and yields of THMs formation. The increase of chlorine dose from 1 ppm to 4 ppm has led to an increase of TTHMs concentration from about 60 ppb to 165 ppb. As it can be seen also from Figure 5, THMs formation rate was ini- tially rapid matching with the rapid consumption of chlo- rine, followed by a declining rate. Maximum TTHMs concentration was reached as faster as chlorine concen- tration is high. These results show that the increase of chlorine dose leads to a significant increase in TTHMs concentration. At high chlorine doses, bromoform becomes the main trihalomethane component formed in chlorinated Doha seawater. Similar results were stated by several studies regarding THMs formation during seawater chlorination, and it was commonly reported that bromoform was the predominant THM identified during seawater chlorina- tion with 1 ppm chlorine dose. In contrast, with 1 ppm chlorine dose, no such predominance was seen for Doha seawater, although the bromide concentration was likely to be somewhat higher than in other costal seawaters. Figure 6 shows that final TTHMs and bromoform concentrations (monitored after 168 hours chlorination) increased linearly with initial total chlorine concentration measured at the beginning of seawater chlorination. It can be deduced from this figure that the evolution of fi- nal TTHMs and bromoform concentrations could be es- timated using linear functions of initial total chlorine concentration (0 tot C), as given by Equations (3) and (4): Figure 5. Evolution of TTHMs concentration as function of time and chlorine dose during Doha seawater chlorination at room temperature (25℃) and natural pH (pH = 8.3). 02 tot TTHMsppb10.331.8C R0.99038 (3) 02 3tot CHBrppb32.460.4C R0.98823 (4) These observations are interesting and practical to con- trol TTHMs and bromoform concentrations (under regu- lation limits) during Doha seawater chlorination and then avoid their hazardous effects on marine environment. These results imply also that Doha seawater chlorination with low chlorine doses is preferable to preventing bio- fouling, controlling THMs formation and maintaining TTHMs and bromoform levels lower than maximum contaminant limits (MCL) [10]. 3.3. Chlorine Decay and TTHMs Formation Kinetics, Curve-Fitting and Parameters Numerous researches proposed mathematical models to predict chlorine decay and THMs formation in chlorin- ated natural and drinking waters [13-18]. Especially, chlorine decay was evaluated with first-order decay model [19], the EPA model [19], Hass and Karra model [20] and Clark’s model [21]. However, only limited re- searches have been focused on modeling chlorine decay and THMs formation in chlorinated seawaters. In our work, OriginLab (Origin version 6.1) software was used to predict the evolution with time of total chlorine, free chlorine, TTHMs and bromoform concentrations. For each chlorine level, a parallel exponential first or- der decay curve was fitted to experimental data corre- sponding to total chlorine (Ctot) and free chlorine (CFree) concentrations evolution with time, according to the fol-  Formation of Trihalomethanes during Seawater Chlorination Copyright © 2010 SciRes. JEP 462 (a) (b) Figure 6. Evolution of final concentrations of (a) TTHMs and (b) bromoform as function total chlorine concentration during Doha seawater chlorination at room temperature (25℃) and natural pH (pH = 8.3). () fitting curve with OriginLab soft- ware. lowing Equations (5)-(6): tot1 2 Ctexpkt expkt (5) Free34 Ctexpktexpkt (6) The parameters α, β, , , k1, k2, k3 and k4 were de- termined using curve-fitting software. Values of these parameters and regression coefficient (R2), for each ini- tial chlorine dose, are listed in Tables 3 and 4. As it can be seen from Figure 7, parallel exponential first order decay functions exploited by the Origin soft- ware provided good fit with chlorine experimental data. The R2 values were close to 1 for both free and total chlorine concentrations. This model divided chlorine decay into two parts, fast reaction and slow reaction. Thus, it appears that parallel exponential first order decay is suitable for prediction of chlorine evolution with time during Doha seawater chlorination (up to 168 hours). This model is comparable to that proposed by Hass and Karra [20] for simulation of chlorine decay for filtered natural water. Similar fitting method was used to predict the evolu- tion with time TTHMs and bromoform concentrations. TTHMs and bromoform profiles can be also approxi- mated using OriginLab curve-fitting software by Equa- tions (7) and (8): 01 1 2 2 t TTHMs ppbtxA1expt t A1exp t (7) 03 3 3 4 4 t CHBrppbtyA1exp t t A1exp t (8) Values of fitting parameters (x0, y0, A1, A2, A3, A4, t1 and t2) and regression coefficients for TTHMs and bro- moform profiles are given in Tables 5 and 6, respec- tively. In addition, Figure 8 presents the evolution with time of both experimental and predicted (using Equations (7) and (8) and parameters from Tables 5 and 6) data for TTHMs and bromoform concentrations. As it can be ob- served predictive curves fit well experimental data for both TTHMs and CHBr3 concentrations; which is con- firmed by regression coefficients (R2) > 0.98. Although OriginLab software gives excellent curve- fitting results for chlorine decay and THMs formation during Doha seawater chlorination, the influence of many other parameters in seawater, including DOC con- tent, natural organic matter, bromide concentration, pH and temperature, should be detailed. Therefore, further research is needed for modeling chlorine decay and THMs formation in seawater. 4. Conclusions The main conclusions of this work can be summarized in the following points: Collected seawater was characterized by the pres- ence of 0.35 ppm total chlorine, 6.64 ppm TOC, 64 ppm bromide and 1 ppb TTHMs. A rapid disap- pearance of chlorine, a decrease in UV absorbance 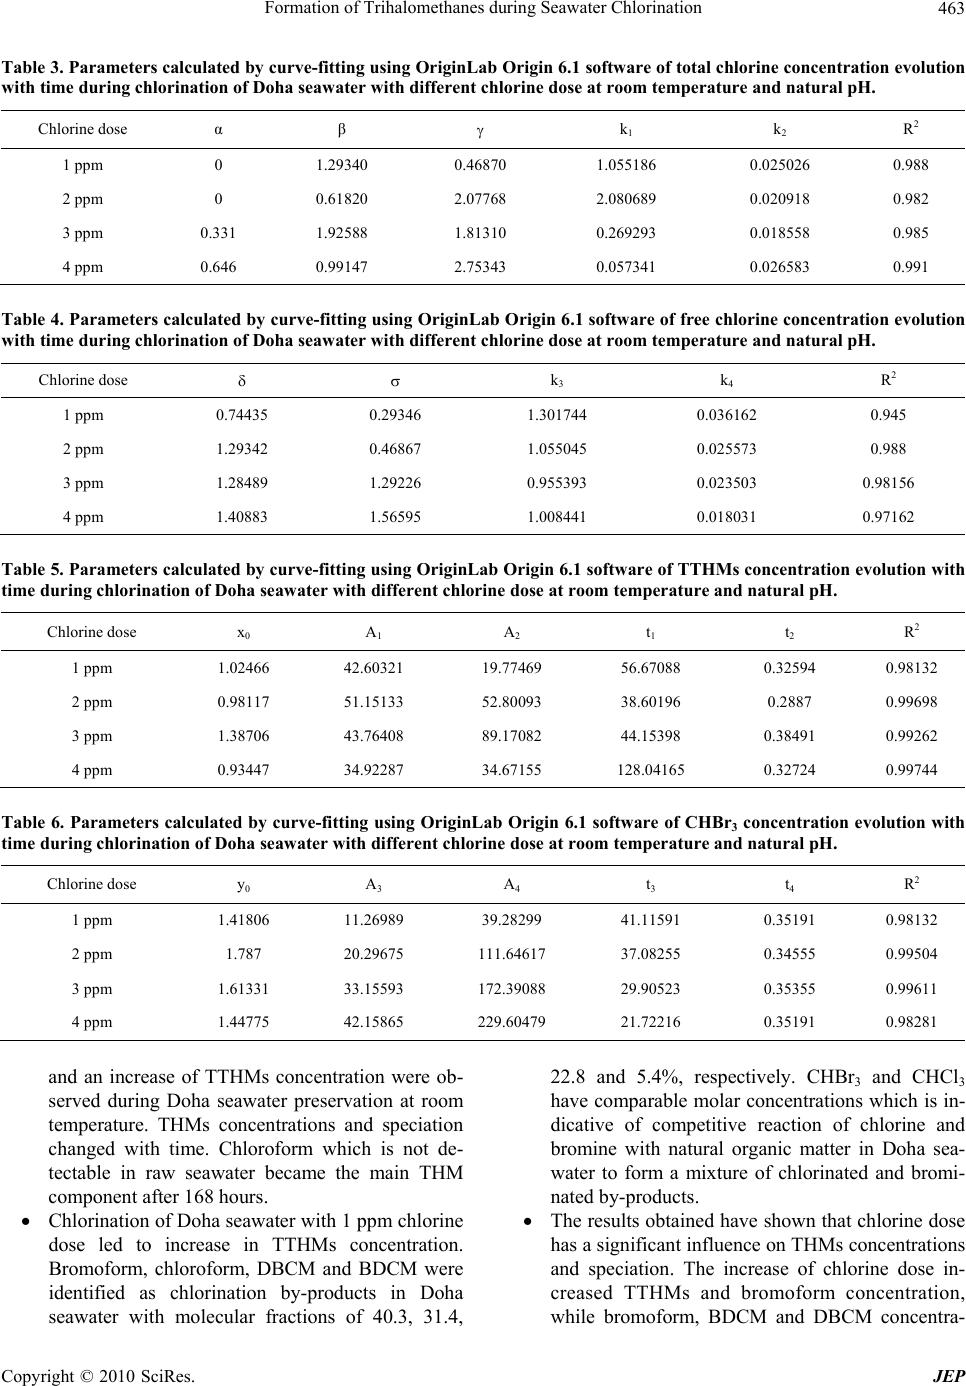 Formation of Trihalomethanes during Seawater Chlorination Copyright © 2010 SciRes. JEP 463 Table 3. Parameters calculated by curve-fitting using OriginLab Origin 6.1 software of total chlorine concentration evolution with time during chlorination of Doha seawater with different chlorine dose at room temperature and natural pH. Chlorine dose α β k1 k 2 R 2 1 ppm 0 1.29340 0.46870 1.055186 0.025026 0.988 2 ppm 0 0.61820 2.07768 2.080689 0.020918 0.982 3 ppm 0.331 1.92588 1.81310 0.269293 0.018558 0.985 4 ppm 0.646 0.99147 2.75343 0.057341 0.026583 0.991 Table 4. Parameters calculated by curve-fitting using OriginLab Origin 6.1 software of free chlorine concentration evolution with time during chlorination of Doha seawater with different chlorine dose at room temperature and natural pH. Chlorine dose k3 k 4 R 2 1 ppm 0.74435 0.29346 1.301744 0.036162 0.945 2 ppm 1.29342 0.46867 1.055045 0.025573 0.988 3 ppm 1.28489 1.29226 0.955393 0.023503 0.98156 4 ppm 1.40883 1.56595 1.008441 0.018031 0.97162 Table 5. Parameters calculated by curve-fitting using OriginLab Origin 6.1 software of TTHMs concentration evolution with time during chlorination of Doha seawater with different chlorine dose at room temperature and natural pH. Chlorine dose x0 A 1 A 2 t 1 t 2 R 2 1 ppm 1.02466 42.60321 19.77469 56.67088 0.32594 0.98132 2 ppm 0.98117 51.15133 52.80093 38.60196 0.2887 0.99698 3 ppm 1.38706 43.76408 89.17082 44.15398 0.38491 0.99262 4 ppm 0.93447 34.92287 34.67155 128.04165 0.32724 0.99744 Table 6. Parameters calculated by curve-fitting using OriginLab Origin 6.1 software of CHBr3 concentration evolution with time during chlorination of Doha seawater with different chlorine dose at room temperature and natural pH. Chlorine dose y0 A 3 A 4 t 3 t 4 R 2 1 ppm 1.41806 11.26989 39.28299 41.11591 0.35191 0.98132 2 ppm 1.787 20.29675 111.64617 37.08255 0.34555 0.99504 3 ppm 1.61331 33.15593 172.39088 29.90523 0.35355 0.99611 4 ppm 1.44775 42.15865 229.60479 21.72216 0.35191 0.98281 and an increase of TTHMs concentration were ob- served during Doha seawater preservation at room temperature. THMs concentrations and speciation changed with time. Chloroform which is not de- tectable in raw seawater became the main THM component after 168 hours. Chlorination of Doha seawater with 1 ppm chlorine dose led to increase in TTHMs concentration. Bromoform, chloroform, DBCM and BDCM were identified as chlorination by-products in Doha seawater with molecular fractions of 40.3, 31.4, 22.8 and 5.4%, respectively. CHBr3 and CHCl3 have comparable molar concentrations which is in- dicative of competitive reaction of chlorine and bromine with natural organic matter in Doha sea- water to form a mixture of chlorinated and bromi- nated by-products. The results obtained have shown that chlorine dose has a significant influence on THMs concentrations and speciation. The increase of chlorine dose in- creased TTHMs and bromoform concentration, while bromoform, BDCM and DBCM concentra- 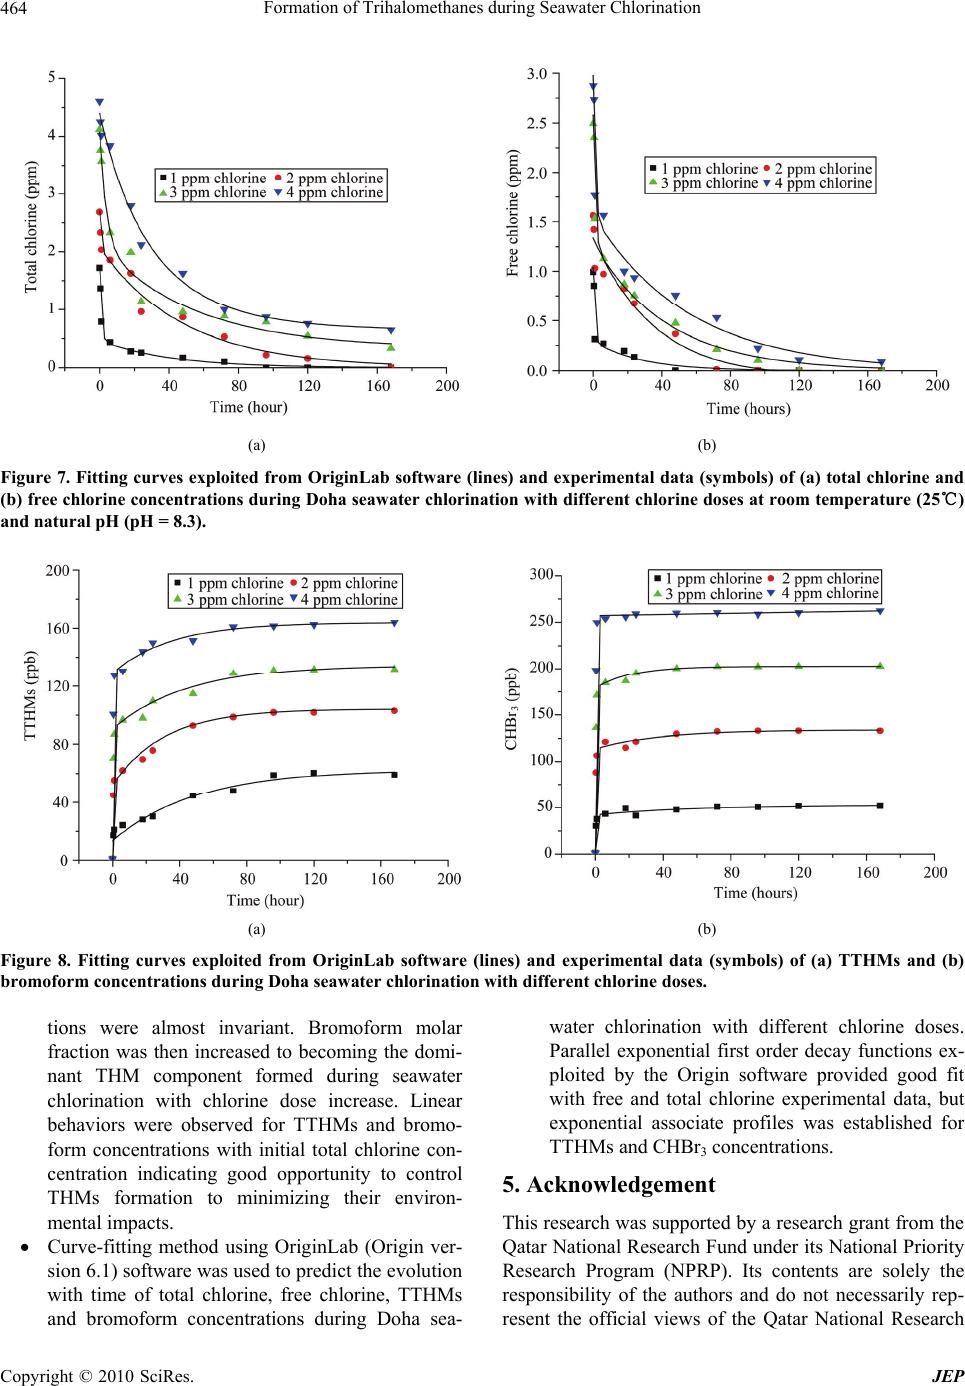 Formation of Trihalomethanes during Seawater Chlorination Copyright © 2010 SciRes. JEP 464 (a) (b) Figure 7. Fitting curves exploited from OriginLab software (lines) and experimental data (symbols) of (a) total chlorine and (b) free chlorine concentrations during Doha seawater chlorination with different chlorine doses at room temperature (25℃) and natural pH (pH = 8.3). (a) (b) Figure 8. Fitting curves exploited from OriginLab software (lines) and experimental data (symbols) of (a) TTHMs and (b) bromoform concentrations during Doha seawater chlorination with different chlorine doses. tions were almost invariant. Bromoform molar fraction was then increased to becoming the domi- nant THM component formed during seawater chlorination with chlorine dose increase. Linear behaviors were observed for TTHMs and bromo- form concentrations with initial total chlorine con- centration indicating good opportunity to control THMs formation to minimizing their environ- mental impacts. Curve-fitting method using OriginLab (Origin ver- sion 6.1) software was used to predict the evolution with time of total chlorine, free chlorine, TTHMs and bromoform concentrations during Doha sea- water chlorination with different chlorine doses. Parallel exponential first order decay functions ex- ploited by the Origin software provided good fit with free and total chlorine experimental data, but exponential associate profiles was established for TTHMs and CHBr3 concentrations. 5. Acknowledgement This research was supported by a research grant from the Qatar National Research Fund under its National Priority Research Program (NPRP). Its contents are solely the responsibility of the authors and do not necessarily rep- resent the official views of the Qatar National Research 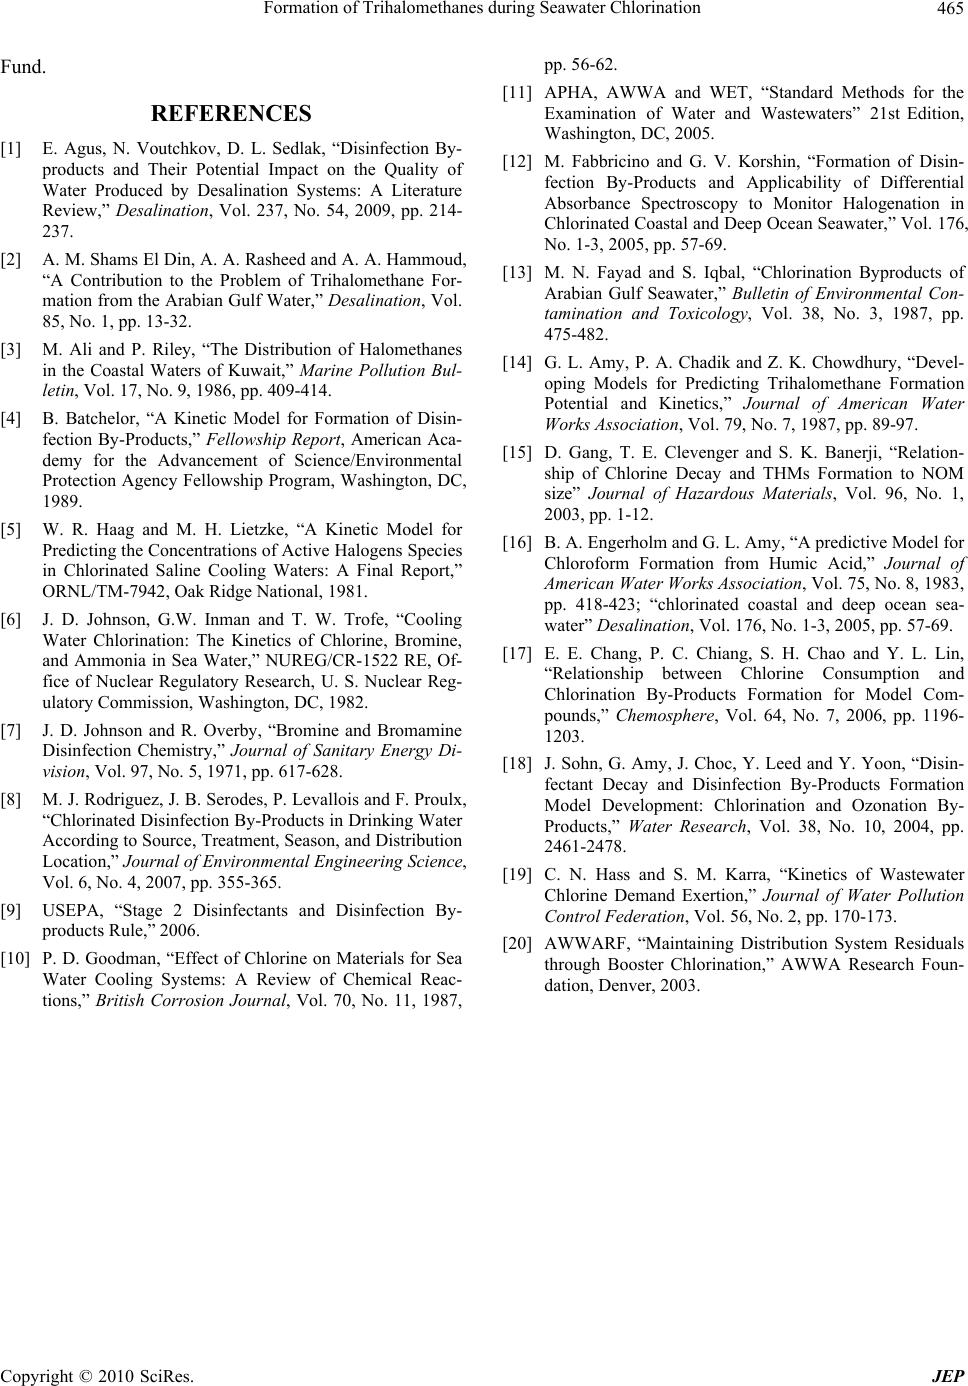 Formation of Trihalomethanes during Seawater Chlorination Copyright © 2010 SciRes. JEP 465 Fund. REFERENCES [1] E. Agus, N. Voutchkov, D. L. Sedlak, “Disinfection By- products and Their Potential Impact on the Quality of Water Produced by Desalination Systems: A Literature Review,” Desalination, Vol. 237, No. 54, 2009, pp. 214- 237. [2] A. M. Shams El Din, A. A. Rasheed and A. A. Hammoud, “A Contribution to the Problem of Trihalomethane For- mation from the Arabian Gulf Water,” Desalination, Vol. 85, No. 1, pp. 13-32. [3] M. Ali and P. Riley, “The Distribution of Halomethanes in the Coastal Waters of Kuwait,” Marine Pollution Bul- letin, Vol. 17, No. 9, 1986, pp. 409-414. [4] B. Batchelor, “A Kinetic Model for Formation of Disin- fection By-Products,” Fellowship Report, American Aca- demy for the Advancement of Science/Environmental Protection Agency Fellowship Program, Washington, DC, 1989. [5] W. R. Haag and M. H. Lietzke, “A Kinetic Model for Predicting the Concentrations of Active Halogens Species in Chlorinated Saline Cooling Waters: A Final Report,” ORNL/TM-7942, Oak Ridge National, 1981. [6] J. D. Johnson, G.W. Inman and T. W. Trofe, “Cooling Water Chlorination: The Kinetics of Chlorine, Bromine, and Ammonia in Sea Water,” NUREG/CR-1522 RE, Of- fice of Nuclear Regulatory Research, U. S. Nuclear Reg- ulatory Commission, Washington, DC, 1982. [7] J. D. Johnson and R. Overby, “Bromine and Bromamine Disinfection Chemistry,” Journal of Sanitary Energy Di- vision, Vol. 97, No. 5, 1971, pp. 617-628. [8] M. J. Rodriguez, J. B. Serodes, P. Levallois and F. Proulx, “Chlorinated Disinfection By-Products in Drinking Water According to Source, Treatment, Season, and Distribution Location,” Journal of Environmental Engineering Science, Vol. 6, No. 4, 2007, pp. 355-365. [9] USEPA, “Stage 2 Disinfectants and Disinfection By- products Rule,” 2006. [10] P. D. Goodman, “Effect of Chlorine on Materials for Sea Water Cooling Systems: A Review of Chemical Reac- tions,” British Corrosion Journal, Vol. 70, No. 11, 1987, pp. 56-62. [11] APHA, AWWA and WET, “Standard Methods for the Examination of Water and Wastewaters” 21st Edition, Washington, DC, 2005. [12] M. Fabbricino and G. V. Korshin, “Formation of Disin- fection By-Products and Applicability of Differential Absorbance Spectroscopy to Monitor Halogenation in Chlorinated Coastal and Deep Ocean Seawater,” Vol. 176, No. 1-3, 2005, pp. 57-69. [13] M. N. Fayad and S. Iqbal, “Chlorination Byproducts of Arabian Gulf Seawater,” Bulletin of Environmental Con- tamination and Toxicology, Vol. 38, No. 3, 1987, pp. 475-482. [14] G. L. Amy, P. A. Chadik and Z. K. Chowdhury, “Devel- oping Models for Predicting Trihalomethane Formation Potential and Kinetics,” Journal of American Water Works Association, Vol. 79, No. 7, 1987, pp. 89-97. [15] D. Gang, T. E. Clevenger and S. K. Banerji, “Relation- ship of Chlorine Decay and THMs Formation to NOM size” Journal of Hazardous Materials, Vol. 96, No. 1, 2003, pp. 1-12. [16] B. A. Engerholm and G. L. Amy, “A predictive Model for Chloroform Formation from Humic Acid,” Journal of American Water Works Association, Vol. 75, No. 8, 1983, pp. 418-423; “chlorinated coastal and deep ocean sea- water” Desalination, Vol. 176, No. 1-3, 2005, pp. 57-69. [17] E. E. Chang, P. C. Chiang, S. H. Chao and Y. L. Lin, “Relationship between Chlorine Consumption and Chlorination By-Products Formation for Model Com- pounds,” Chemosphere, Vol. 64, No. 7, 2006, pp. 1196- 1203. [18] J. Sohn, G. Amy, J. Choc, Y. Leed and Y. Yoon, “Disin- fectant Decay and Disinfection By-Products Formation Model Development: Chlorination and Ozonation By- Products,” Water Research, Vol. 38, No. 10, 2004, pp. 2461-2478. [19] C. N. Hass and S. M. Karra, “Kinetics of Wastewater Chlorine Demand Exertion,” Journal of Water Pollution Control Federation, Vol. 56, No. 2, pp. 170-173. [20] AWWARF, “Maintaining Distribution System Residuals through Booster Chlorination,” AWWA Research Foun- dation, Denver, 2003. |