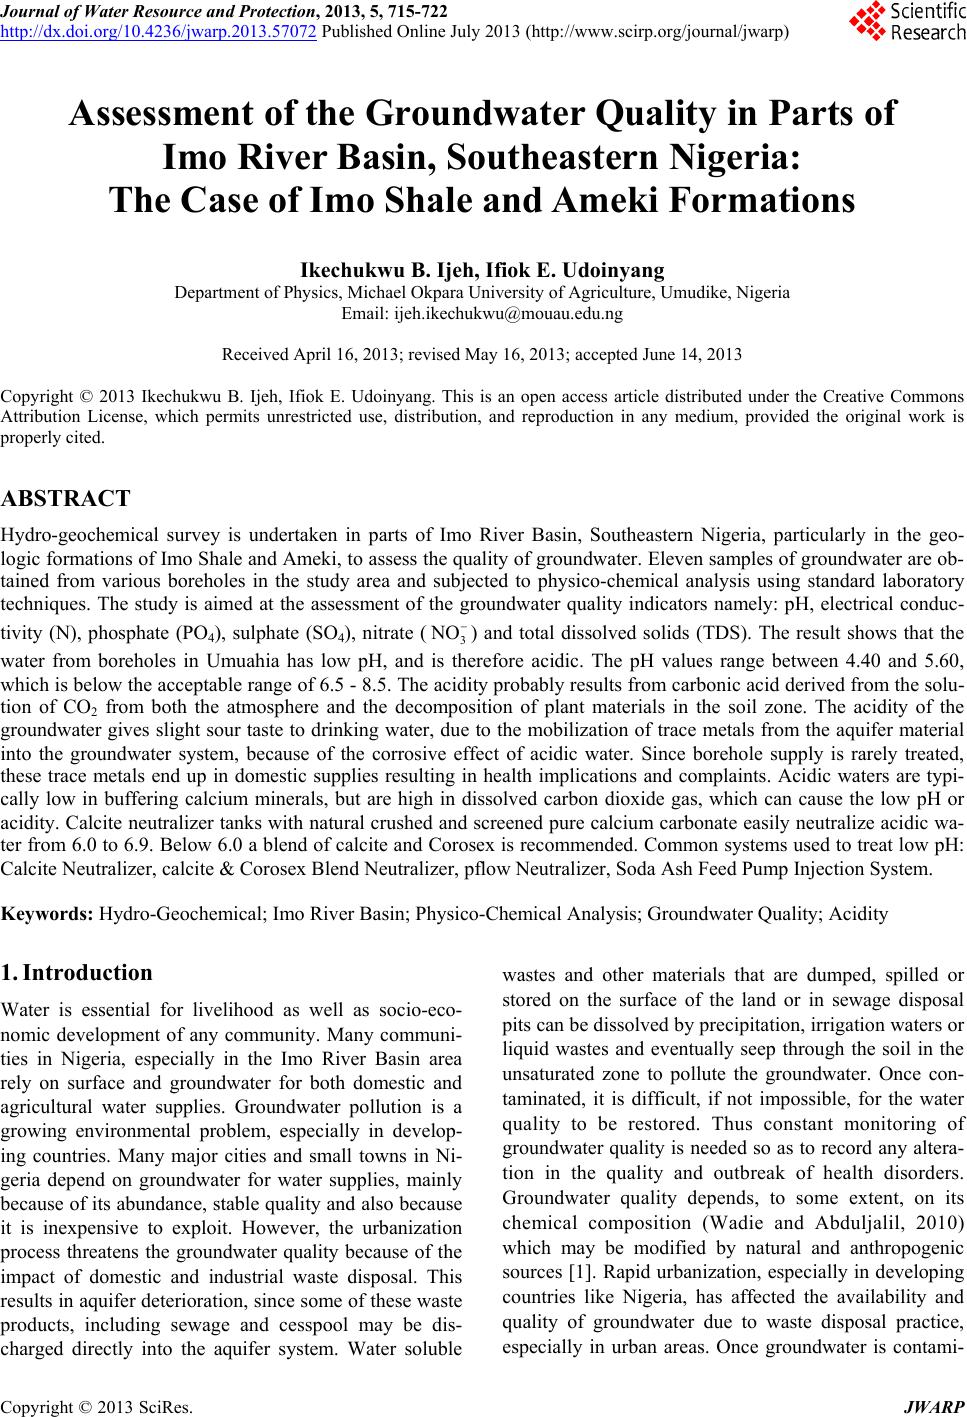
 Journal of Water Resource and Protection, 2013, 5, 715-722 http://dx.doi.org/10.4236/jwarp.2013.57072 Published Online July 2013 (http://www.scirp.org/journal/jwarp) Assessment of the Groundwater Quality in Parts of Imo River Basin, Southeastern Nigeria: The Case of Imo Shale and Ameki Formations Ikechukwu B. Ijeh, Ifiok E. Udoinyang Department of Physics, Michael Okpara University of Agriculture, Umudike, Nigeria Email: ijeh.ikechukwu@mouau.edu.ng Received April 16, 2013; revised May 16, 2013; accepted June 14, 2013 Copyright © 2013 Ikechukwu B. Ijeh, Ifiok E. Udoinyang. This is an open access article distributed under the Creative Commons Attribution License, which permits unrestricted use, distribution, and reproduction in any medium, provided the original work is properly cited. ABSTRACT Hydro-geochemical survey is undertaken in parts of Imo River Basin, Southeastern Nigeria, particularly in the geo- logic formations of Imo Shale and Ameki, to assess the quality of groundwater. Eleven samples of groundwater are ob- tained from various boreholes in the study area and subjected to physico-chemical analysis using standard laboratory techniques. The study is aimed at the assessment of the groundwater quality indicators namely: pH, electrical conduc- tivity (N), phosphate (PO4), sulphate (SO4), nitrate (3 NO ) and total dissolved solids (TDS). The result shows that the water from boreholes in Umuahia has low pH, and is therefore acidic. The pH values range between 4.40 and 5.60, which is below the acceptable range of 6.5 - 8.5. The acidity probably results from carbonic acid derived from the solu- tion of CO2 from both the atmosphere and the decomposition of plant materials in the soil zone. The acidity of the groundwater gives slight sour taste to drinking water, due to the mobilization of trace metals from the aquifer material into the groundwater system, because of the corrosive effect of acidic water. Since borehole supply is rarely treated, these trace metals end up in domestic supplies resulting in health implications and complaints. Acidic waters are typi- cally low in buffering calcium minerals, but are high in dissolved carbon dioxide gas, which can cause the low pH or acidity. Calcite neutralizer tanks with natural crushed and screened pure calcium carbonate easily neutralize acidic wa- ter from 6.0 to 6.9. Below 6.0 a blend of calcite and Corosex is recommended. Common systems used to treat low pH: Calcite Neutralizer, calcite & Corosex Blend Neutralizer, pflow Neutralizer, Soda Ash Feed Pump Injection System. Keywords: Hydro-Geochemical; Imo River Basin; Physico-Chemical Analysis; Groundwater Quality; Acidity 1. Introduction Water is essential for livelihood as well as socio-eco- nomic development of any community. Many communi- ties in Nigeria, especially in the Imo River Basin area rely on surface and groundwater for both domestic and agricultural water supplies. Groundwater pollution is a growing environmental problem, especially in develop- ing countries. Many major cities and small towns in Ni- geria depend on groundwater for water supplies, mainly because of its abundance, stable quality and also because it is inexpensive to exploit. However, the urbanization process threatens the groundwater quality because of the impact of domestic and industrial waste disposal. This results in aquifer deterioration, since some of these waste products, including sewage and cesspool may be dis- charged directly into the aquifer system. Water soluble wastes and other materials that are dumped, spilled or stored on the surface of the land or in sewage disposal pits can be dissolved by precipitation, irrigation waters or liquid wastes and eventually seep through the soil in the unsaturated zone to pollute the groundwater. Once con- taminated, it is difficult, if not impossible, for the water quality to be restored. Thus constant monitoring of groundwater quality is needed so as to record any altera- tion in the quality and outbreak of health disorders. Groundwater quality depends, to some extent, on its chemical composition (Wadie and Abduljalil, 2010) which may be modified by natural and anthropogenic sources [1]. Rapid urbanization, especially in developing countries like Nigeria, has affected the availability and quality of groundwater due to waste disposal practice, especially in urban areas. Once groundwater is contami- C opyright © 2013 SciRes. JWARP 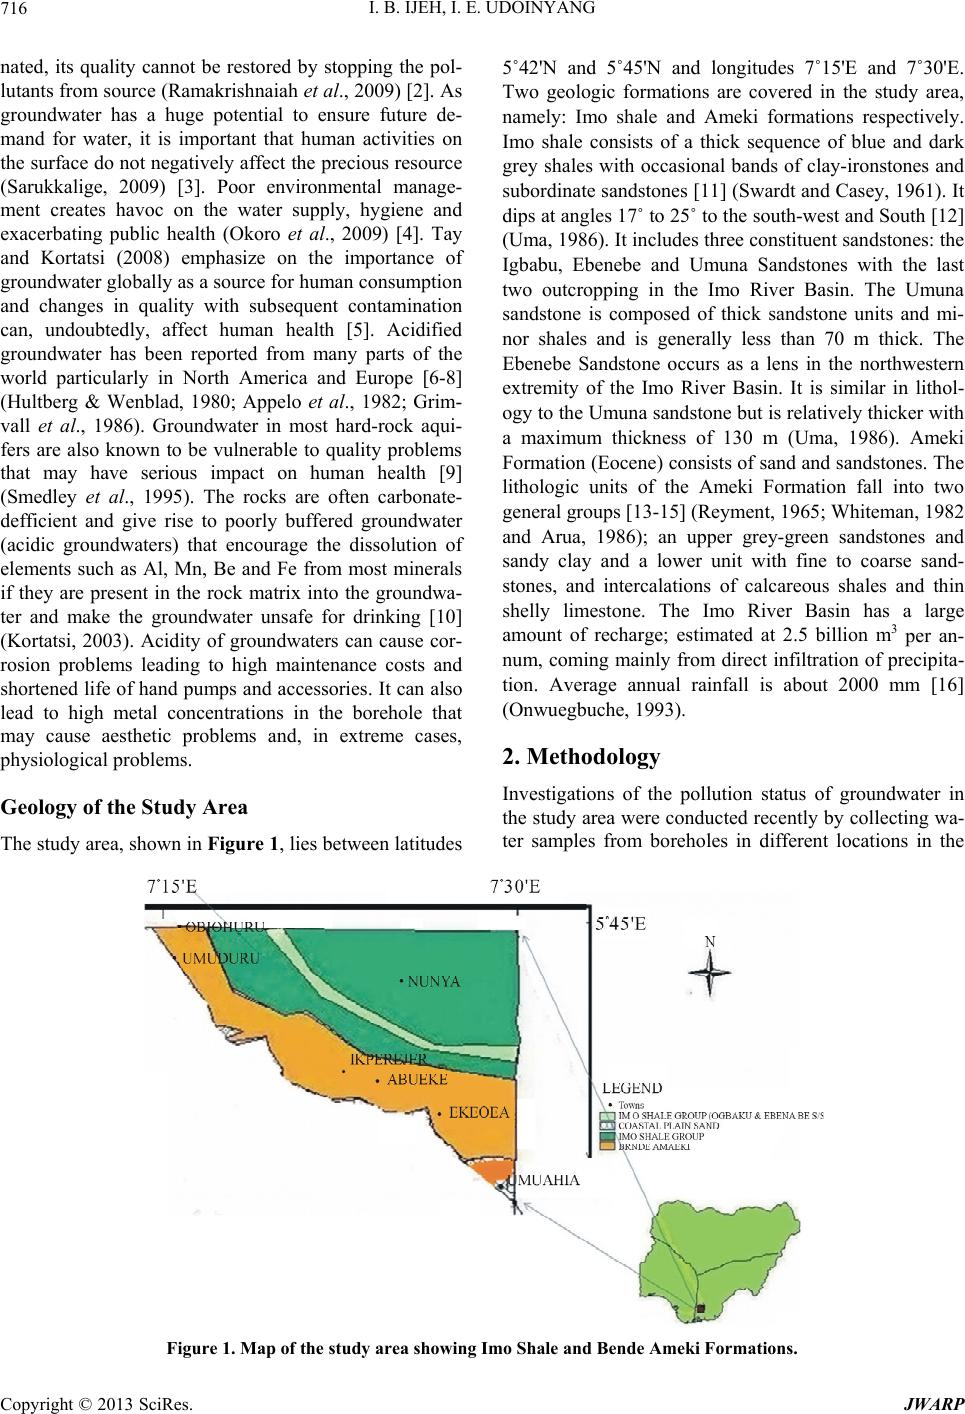 I. B. IJEH, I. E. UDOINYANG 716 nated, its quality cannot be restored by stopping the pol- lutants from source (Ramakrishnaiah et al., 2009) [2]. As groundwater has a huge potential to ensure future de- mand for water, it is important that human activities on the surface do not negatively affect the precious resource (Sarukkalige, 2009) [3]. Poor environmental manage- ment creates havoc on the water supply, hygiene and exacerbating public health (Okoro et al., 2009) [4]. Tay and Kortatsi (2008) emphasize on the importance of groundwater globally as a source for human consumption and changes in quality with subsequent contamination can, undoubtedly, affect human health [5]. Acidified groundwater has been reported from many parts of the world particularly in North America and Europe [6-8] (Hultberg & Wenblad, 1980; Appelo et al., 1982; Grim- vall et al., 1986). Groundwater in most hard-rock aqui- fers are also known to be vulnerable to quality problems that may have serious impact on human health [9] (Smedley et al., 1995). The rocks are often carbonate- defficient and give rise to poorly buffered groundwater (acidic groundwaters) that encourage the dissolution of elements such as Al, Mn, Be and Fe from most minerals if they are present in the rock matrix into the groundwa- ter and make the groundwater unsafe for drinking [10] (Kortatsi, 2003). Acidity of groundwaters can cause cor- rosion problems leading to high maintenance costs and shortened life of hand pumps and accessories. It can also lead to high metal concentrations in the borehole that may cause aesthetic problems and, in extreme cases, physiological problems. Geology of the Study Area The study area, shown in Figure 1, lies between latitudes 5˚42'N and 5˚45'N and longitudes 7˚15'E and 7˚30'E. Two geologic formations are covered in the study area, namely: Imo shale and Ameki formations respectively. Imo shale consists of a thick sequence of blue and dark grey shales with occasional bands of clay-ironstones and subordinate sandstones [11] (Swardt and Casey, 1961). It dips at angles 17˚ to 25˚ to the south-west and South [12] (Uma, 1986). It includes three constituent sandstones: the Igbabu, Ebenebe and Umuna Sandstones with the last two outcropping in the Imo River Basin. The Umuna sandstone is composed of thick sandstone units and mi- nor shales and is generally less than 70 m thick. The Ebenebe Sandstone occurs as a lens in the northwestern extremity of the Imo River Basin. It is similar in lithol- ogy to the Umuna sandstone but is relatively thicker with a maximum thickness of 130 m (Uma, 1986). Ameki Formation (Eocene) consists of sand and sandstones. The lithologic units of the Ameki Formation fall into two general groups [13-15] (Reyment, 1965; Whiteman, 1982 and Arua, 1986); an upper grey-green sandstones and sandy clay and a lower unit with fine to coarse sand- stones, and intercalations of calcareous shales and thin shelly limestone. The Imo River Basin has a large amount of recharge; estimated at 2.5 billion m3 per an- num, coming mainly from direct infiltration of precipita- tion. Average annual rainfall is about 2000 mm [16] (Onwuegbuche, 1993). 2. Methodology Investigations of the pollution status of groundwater in the study area were conducted recently by collecting wa- ter samples from boreholes in different locations in the Figure 1. Map of the study area show ing Imo Shale and Bende Ameki Formations. Copyright © 2013 SciRes. JWARP 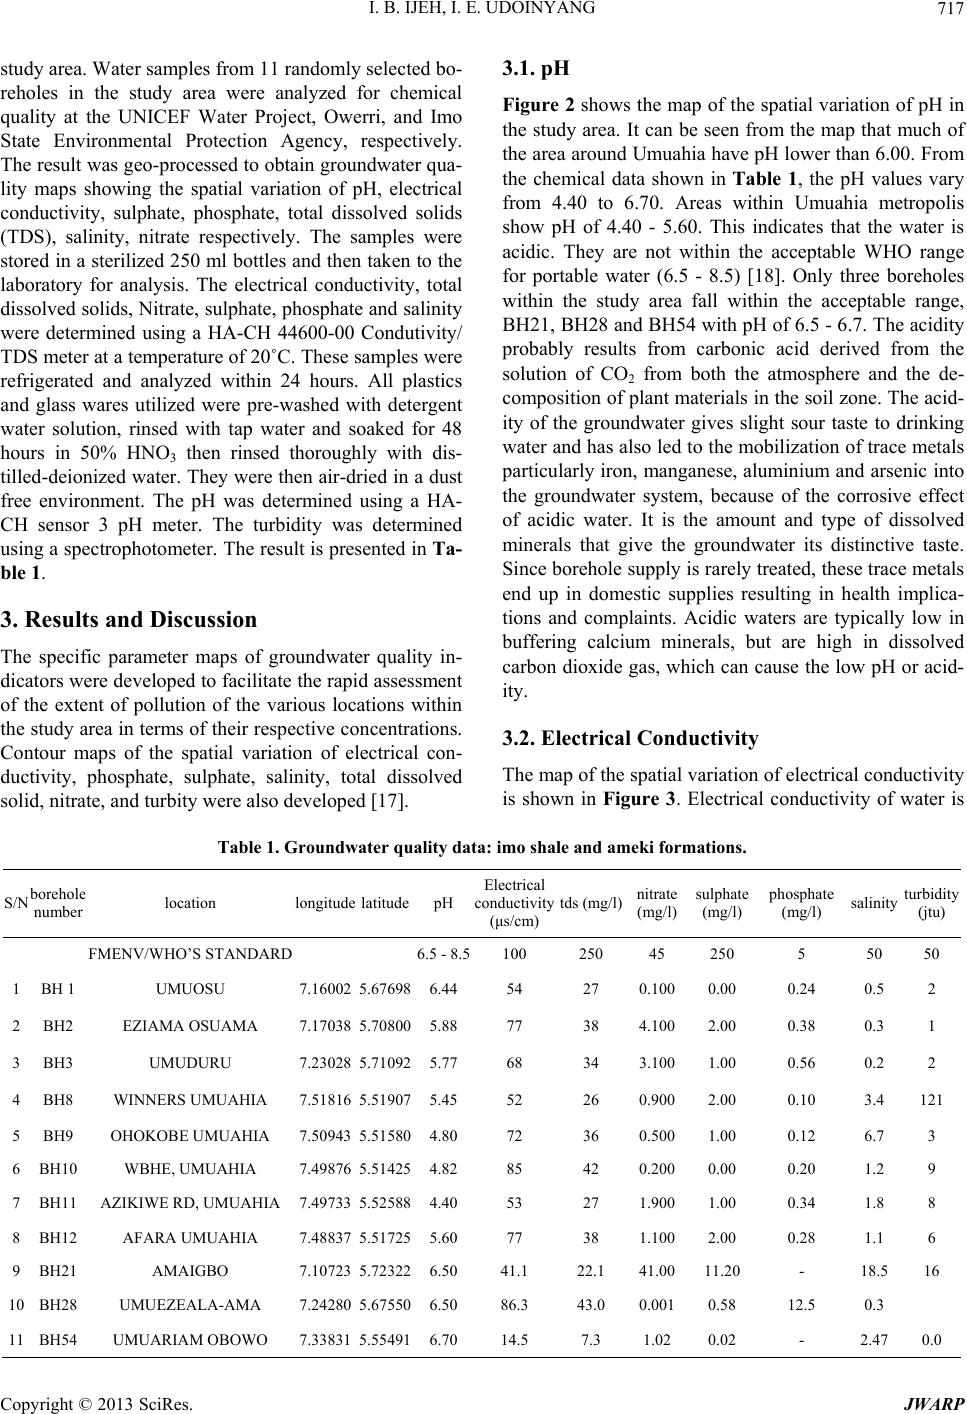 I. B. IJEH, I. E. UDOINYANG 717 study area. Water samples from 11 randomly selected bo- reholes in the study area were analyzed for chemical quality at the UNICEF Water Project, Owerri, and Imo State Environmental Protection Agency, respectively. The result was geo-processed to obtain groundwater qua- lity maps showing the spatial variation of pH, electrical conductivity, sulphate, phosphate, total dissolved solids (TDS), salinity, nitrate respectively. The samples were stored in a sterilized 250 ml bottles and then taken to the laboratory for analysis. The electrical conductivity, total dissolved solids, Nitrate, sulphate, phosphate and salinity were determined using a HA-CH 44600-00 Condutivity/ TDS meter at a temperature of 20˚C. These samples were refrigerated and analyzed within 24 hours. All plastics and glass wares utilized were pre-washed with detergent water solution, rinsed with tap water and soaked for 48 hours in 50% HNO3 then rinsed thoroughly with dis- tilled-deionized water. They were then air-dried in a dust free environment. The pH was determined using a HA- CH sensor 3 pH meter. The turbidity was determined using a spectrophotometer. The result is presented in Ta- ble 1. 3. Results and Discussion The specific parameter maps of groundwater quality in- dicators were developed to facilitate the rapid assessment of the extent of pollution of the various locations within the study area in terms of their respective concentrations. Contour maps of the spatial variation of electrical con- ductivity, phosphate, sulphate, salinity, total dissolved solid, nitrate, and turbity were also developed [17]. 3.1. pH Figure 2 shows the map of the spatial variation of pH in the study area. It can be seen from the map that much of the area around Umuahia have pH lower than 6.00. From the chemical data shown in Table 1, the pH values vary from 4.40 to 6.70. Areas within Umuahia metropolis show pH of 4.40 - 5.60. This indicates that the water is acidic. They are not within the acceptable WHO range for portable water (6.5 - 8.5) [18]. Only three boreholes within the study area fall within the acceptable range, BH21, BH28 and BH54 with pH of 6.5 - 6.7. The acidity probably results from carbonic acid derived from the solution of CO2 from both the atmosphere and the de- composition of plant materials in the soil zone. The acid- ity of the groundwater gives slight sour taste to drinking water and has also led to the mobilization of trace metals particularly iron, manganese, aluminium and arsenic into the groundwater system, because of the corrosive effect of acidic water. It is the amount and type of dissolved minerals that give the groundwater its distinctive taste. Since borehole supply is rarely treated, these trace metals end up in domestic supplies resulting in health implica- tions and complaints. Acidic waters are typically low in buffering calcium minerals, but are high in dissolved carbon dioxide gas, which can cause the low pH or acid- ity. 3.2. Electrical Conductivity The map of the spatial variation of electrical conductivity is shown in Figure 3. Electrical conductivity of water is Table 1. Groundwater quality data: imo shale and ameki formations. S/N borehole number location longitude latitude pH Electrical conductivity (μs/cm) tds (mg/l)nitrate (mg/l) sulphate (mg/l) phosphate (mg/l) salinity turbidity (jtu) FMENV/WHO’S STANDARD 6.5 - 8.5100 250 45 250 5 50 50 1 BH 1 UMUOSU 7.16002 5.676986.44 54 27 0.1000.00 0.24 0.5 2 2 BH2 EZIAMA OSUAMA 7.17038 5.708005.88 77 38 4.1002.00 0.38 0.3 1 3 BH3 UMUDURU 7.23028 5.710925.77 68 34 3.1001.00 0.56 0.2 2 4 BH8 WINNERS UMUAHIA 7.51816 5.519075.45 52 26 0.9002.00 0.10 3.4 121 5 BH9 OHOKOBE UMUAHIA 7.50943 5.515804.80 72 36 0.5001.00 0.12 6.7 3 6 BH10 WBHE, UMUAHIA 7.49876 5.514254.82 85 42 0.2000.00 0.20 1.2 9 7 BH11 AZIKIWE RD, UMUAHIA 7.49733 5.525884.40 53 27 1.9001.00 0.34 1.8 8 8 BH12 AFARA UMUAHIA 7.48837 5.517255.60 77 38 1.1002.00 0.28 1.1 6 9 BH21 AMAIGBO 7.10723 5.723226.50 41.1 22.1 41.0011.20 - 18.516 10 BH28 UMUEZEALA-AMA 7.24280 5.675506.50 86.3 43.0 0.0010.58 12.5 0.3 11 BH54 UMUARIAM OBOWO 7.33831 5.554916.70 14.5 7.3 1.02 0.02 - 2.470.0 Copyright © 2013 SciRes. JWARP  I. B. IJEH, I. E. UDOINYANG 718 Figure 2. Spatial variation of pH in the study area. Figure 3. Spatial variation of electrical conduc tivity in the study area. used as an indicator of how salt-free, ion-free, or impu- rity-free the sample is; the purer the water the lower the conductivity (the higher the resitivity). The World Health Organization standard for acceptable electrical conduc- tivity is 100 μs/cm. Pure water has an electrical conduc- tivity of 5.5 μs/cm, a measure of the total dissolved solid (TDS), while rain water and ocean water have 5000 to 30,000 μs/cm and 45,000 to 60,000 μs/cm respectively. Normal groundwater has a range of 100 to 2000 μs/cm [19] (Offodile, 2002). All areas within the study area fall within the WHO standard for electrical conductivity. 3.3. Phosphate Figure 4 shows the map of phosphate concentration in the study area. Phosphorus is one of the key elements necessary for the growth of plants and animals. Phos- phates are not toxic to people or animals unless they are present in very high levels. Digestive problems could occur from extremely high levels of phosphate. The WHO standard for phosphate in drinking water is 5 mg/l. This standard is exceeded only in Umuezeala-ama, BH28 (12.50 mg/l). This is probably because of the extensive use of fertilizer for farming in the area. The rest of the area have generally low concentration of phosphate (≤2 mg/l), perhaps, due to less farming in those urban cen- ters. 3.4. Nitrate Figure 5 shows the contour map of spatial variation of nitrate concentration in the study area. Nitrate is an es- sential ingredient of plant nutrition. It is, however re- garded as an indicator of pollution in public water supply Copyright © 2013 SciRes. JWARP 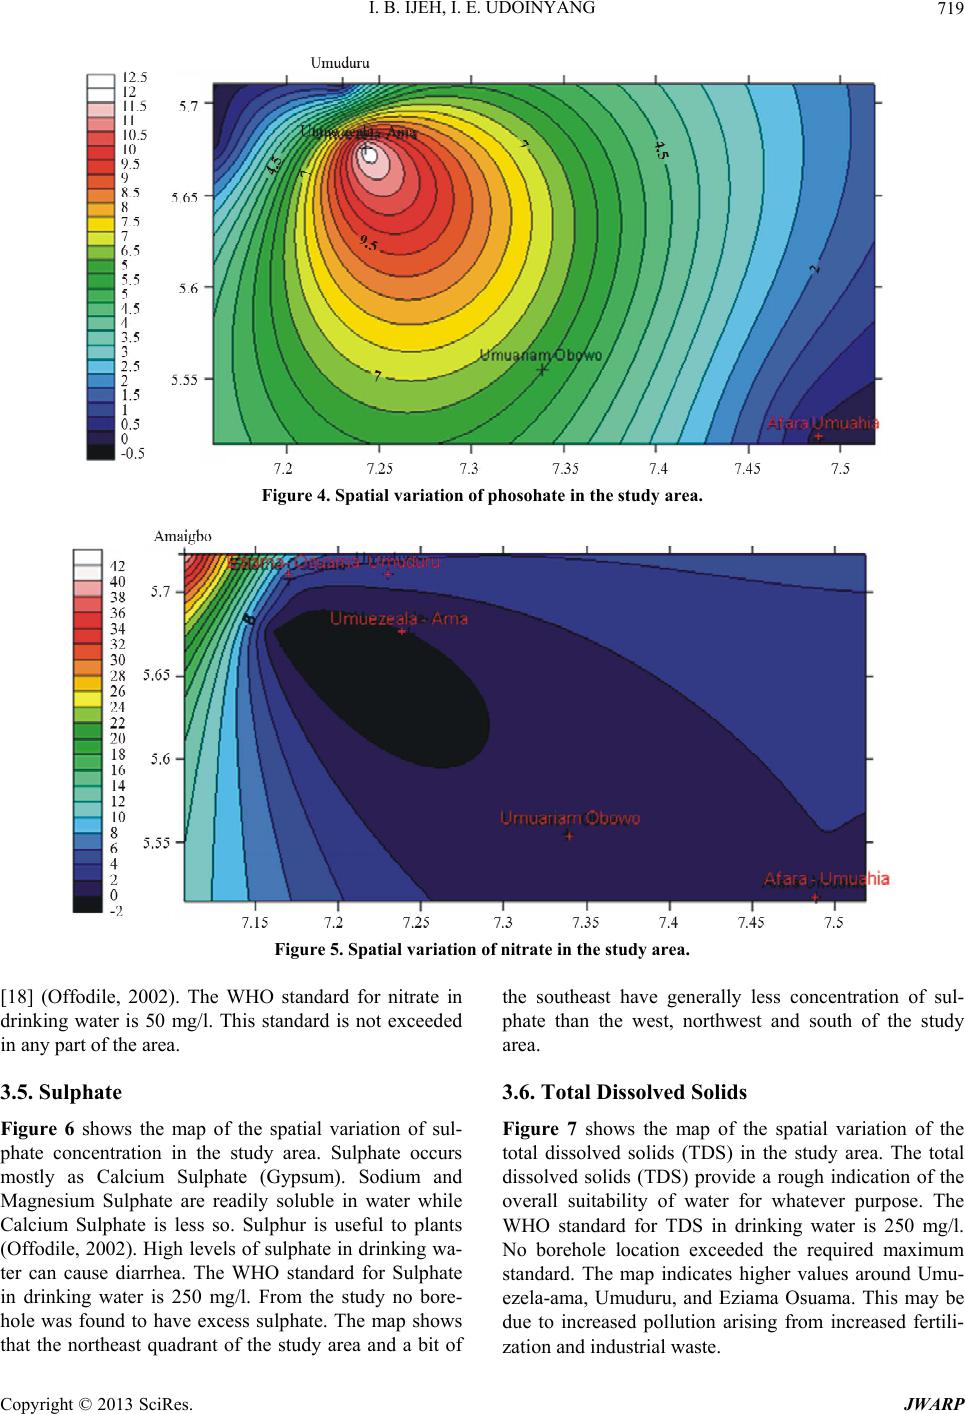 I. B. IJEH, I. E. UDOINYANG 719 Figure 4. Spatial variation of phosohate in the study area. Figure 5. Spatial variation of nitrate in the study area. [18] (Offodile, 2002). The WHO standard for nitrate in drinking water is 50 mg/l. This standard is not exceeded in any part of the area. 3.5. Sulphate Figure 6 shows the map of the spatial variation of sul- phate concentration in the study area. Sulphate occurs mostly as Calcium Sulphate (Gypsum). Sodium and Magnesium Sulphate are readily soluble in water while Calcium Sulphate is less so. Sulphur is useful to plants (Offodile, 2002). High levels of sulphate in drinking wa- ter can cause diarrhea. The WHO standard for Sulphate in drinking water is 250 mg/l. From the study no bore- hole was found to have excess sulphate. The map shows that the northeast quadrant of the study area and a bit of the southeast have generally less concentration of sul- phate than the west, northwest and south of the study area. 3.6. Total Dissolved Solids Figure 7 shows the map of the spatial variation of the total dissolved solids (TDS) in the study area. The total dissolved solids (TDS) provide a rough indication of the overall suitability of water for whatever purpose. The WHO standard for TDS in drinking water is 250 mg/l. No borehole location exceeded the required maximum standard. The map indicates higher values around Umu- ezela-ama, Umuduru, and Eziama Osuama. This may be due to increased pollution arising from increased fertili- zation and industrial waste. Copyright © 2013 SciRes. JWARP 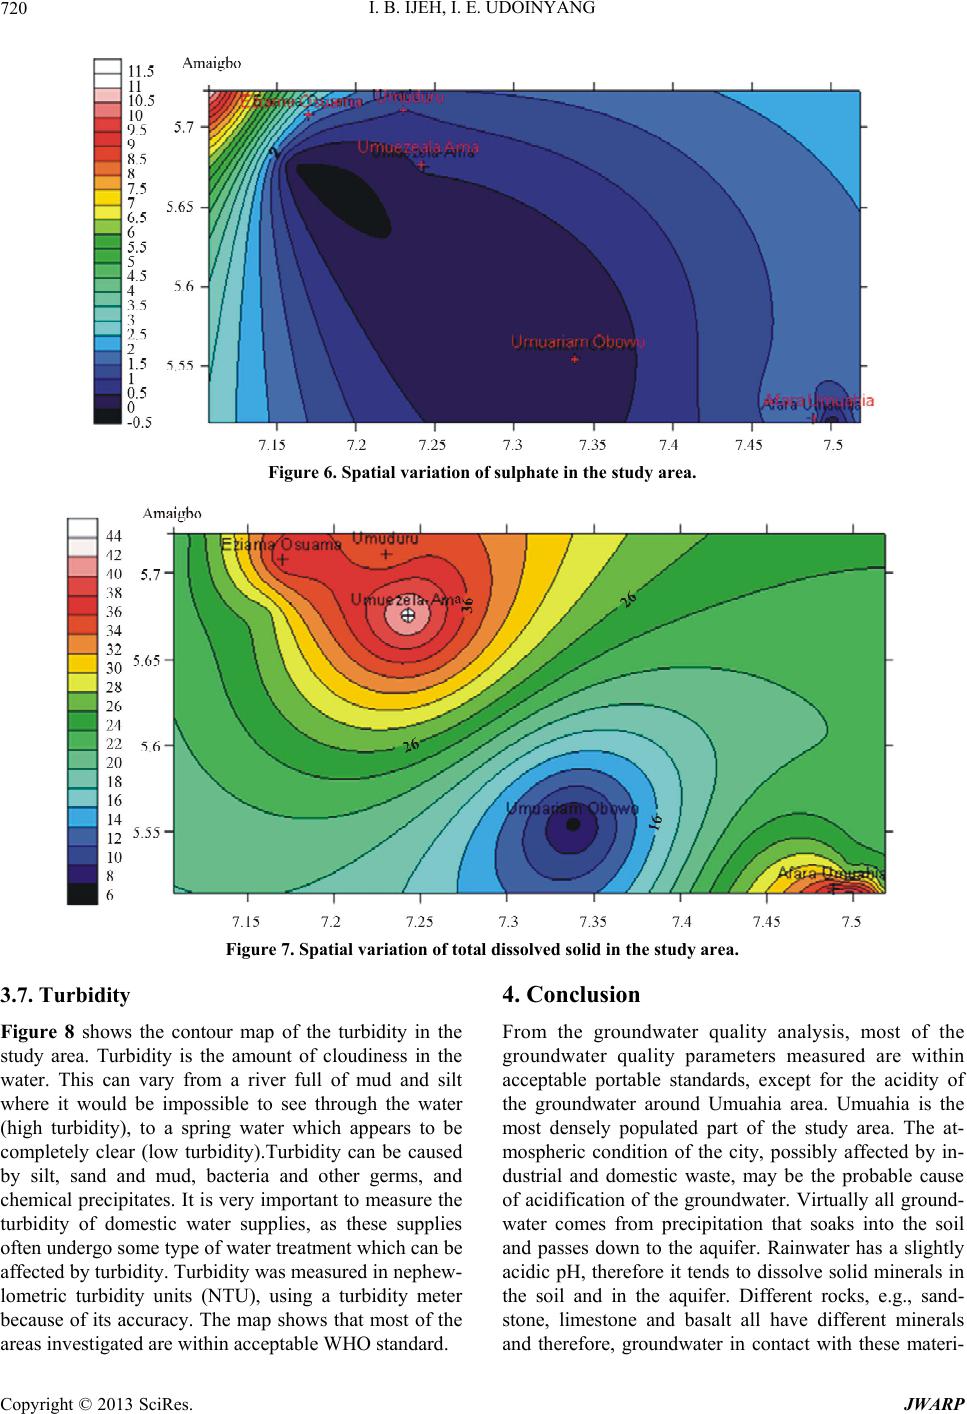 I. B. IJEH, I. E. UDOINYANG 720 Figure 6. Spatial variation of sulphate in the study area. Figure 7. Spatial variation of total dissolved solid in the study area. 3.7. Turbidity Figure 8 shows the contour map of the turbidity in the study area. Turbidity is the amount of cloudiness in the water. This can vary from a river full of mud and silt where it would be impossible to see through the water (high turbidity), to a spring water which appears to be completely clear (low turbidity).Turbidity can be caused by silt, sand and mud, bacteria and other germs, and chemical precipitates. It is very important to measure the turbidity of domestic water supplies, as these supplies often undergo some type of water treatment which can be affected by turbidity. Turbidity was measured in nephew- lometric turbidity units (NTU), using a turbidity meter because of its accuracy. The map shows that most of the areas investigated are within acceptable WHO standard. 4. Conclusion From the groundwater quality analysis, most of the groundwater quality parameters measured are within acceptable portable standards, except for the acidity of the groundwater around Umuahia area. Umuahia is the most densely populated part of the study area. The at- mospheric condition of the city, possibly affected by in- dustrial and domestic waste, may be the probable cause of acidification of the groundwater. Virtually all ground- water comes from precipitation that soaks into the soil and passes down to the aquifer. Rainwater has a slightly acidic pH, therefore it tends to dissolve solid minerals in the soil and in the aquifer. Different rocks, e.g., sand- stone, limestone and basalt all have different minerals and therefore, groundwater in contact with these materi- Copyright © 2013 SciRes. JWARP 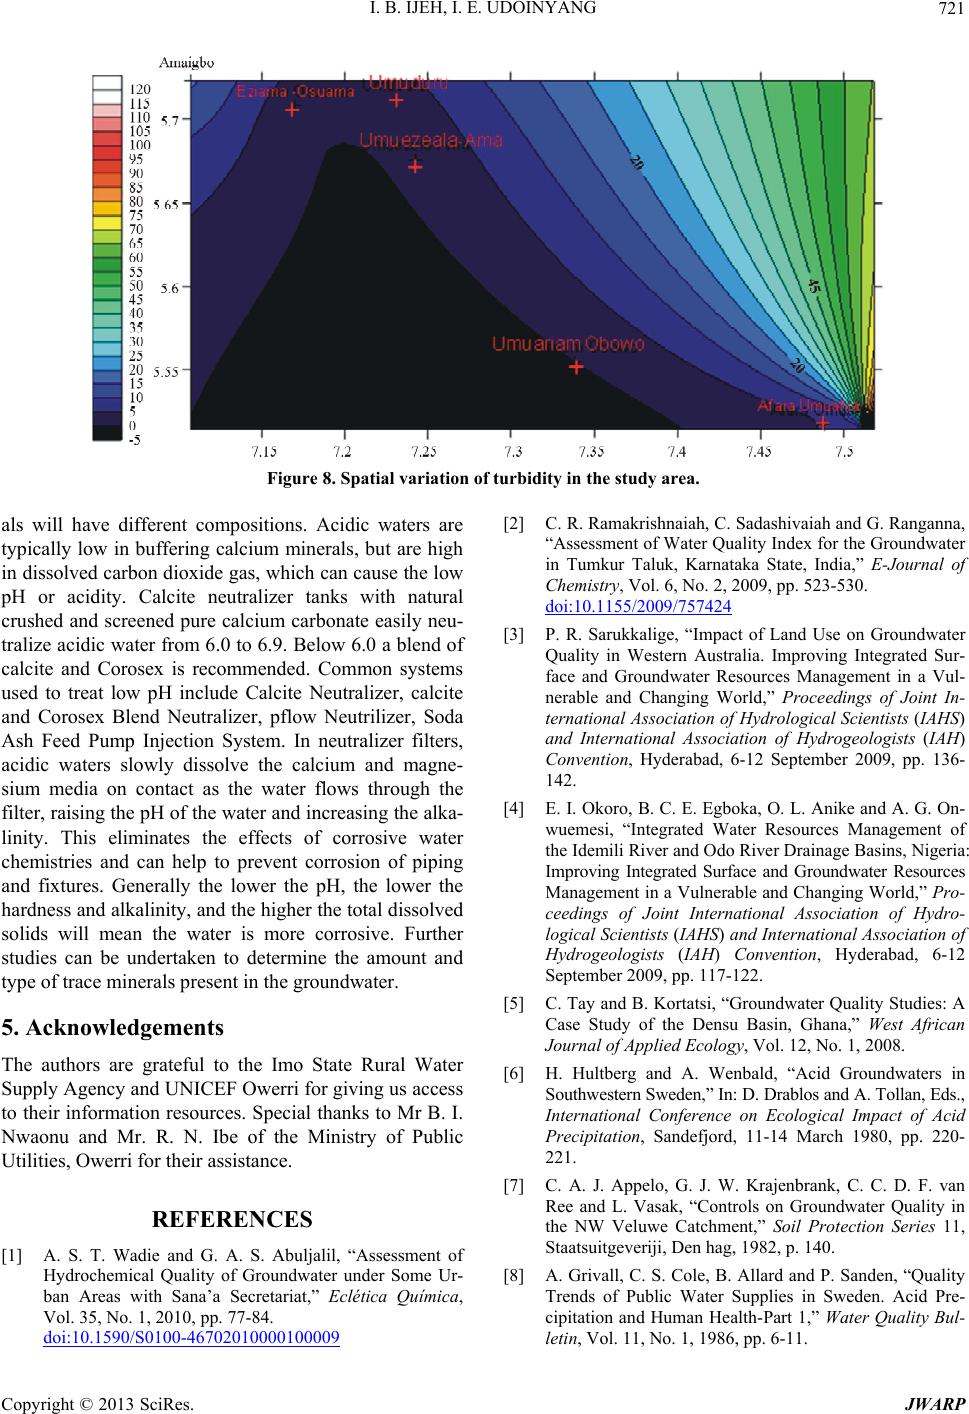 I. B. IJEH, I. E. UDOINYANG 721 Figure 8. Spatial variation of turbidity in the study area. als will have different compositions. Acidic waters are typically low in buffering calcium minerals, but are high in dissolved carbon dioxide gas, which can cause the low pH or acidity. Calcite neutralizer tanks with natural crushed and screened pure calcium carbonate easily neu- tralize acidic water from 6.0 to 6.9. Below 6.0 a blend of calcite and Corosex is recommended. Common systems used to treat low pH include Calcite Neutralizer, calcite and Corosex Blend Neutralizer, pflow Neutrilizer, Soda Ash Feed Pump Injection System. In neutralizer filters, acidic waters slowly dissolve the calcium and magne- sium media on contact as the water flows through the filter, raising the pH of the water and increasing the alka- linity. This eliminates the effects of corrosive water chemistries and can help to prevent corrosion of piping and fixtures. Generally the lower the pH, the lower the hardness and alkalinity, and the higher the total dissolved solids will mean the water is more corrosive. Further studies can be undertaken to determine the amount and type of trace minerals present in the groundwater. 5. Acknowledgements The authors are grateful to the Imo State Rural Water Supply Agency and UNICEF Owerri for giving us access to their information resources. Special thanks to Mr B. I. Nwaonu and Mr. R. N. Ibe of the Ministry of Public Utilities, Owerri for their assistance. REFERENCES [1] A. S. T. Wadie and G. A. S. Abuljalil, “Assessment of Hydrochemical Quality of Groundwater under Some Ur- ban Areas with Sana’a Secretariat,” Eclética Química, Vol. 35, No. 1, 2010, pp. 77-84. doi:10.1590/S0100-46702010000100009 [2] C. R. Ramakrishnaiah, C. Sadashivaiah and G. Ranganna, “Assessment of Water Quality Index for the Groundwater in Tumkur Taluk, Karnataka State, India,” E-Journal of Chemistry, Vol. 6, No. 2, 2009, pp. 523-530. doi:10.1155/2009/757424 [3] P. R. Sarukkalige, “Impact of Land Use on Groundwater Quality in Western Australia. Improving Integrated Sur- face and Groundwater Resources Management in a Vul- nerable and Changing World,” Proceedings of Joint In- ternational Association of Hydrological Scientists (IAHS) and International Association of Hydrogeologists (IAH) Convention, Hyderabad, 6-12 September 2009, pp. 136- 142. [4] E. I. Okoro, B. C. E. Egboka, O. L. Anike and A. G. On- wuemesi, “Integrated Water Resources Management of the Idemili River and Odo River Drainage Basins, Nigeria: Improving Integrated Surface and Groundwater Resources Management in a Vulnerable and Changing World,” Pro- ceedings of Joint International Association of Hydro- logical Scientists (IAHS) and International Association of Hydrogeologists (IAH) Convention, Hyderabad, 6-12 September 2009, pp. 117-122. [5] C. Tay and B. Kortatsi, “Groundwater Quality Studies: A Case Study of the Densu Basin, Ghana,” West African Journal of Applied Ecology, Vol. 12, No. 1, 2008. [6] H. Hultberg and A. Wenbald, “Acid Groundwaters in Southwestern Sweden,” In: D. Drablos and A. Tollan, Eds., International Conference on Ecological Impact of Acid Precipitation, Sandefjord, 11-14 March 1980, pp. 220- 221. [7] C. A. J. Appelo, G. J. W. Krajenbrank, C. C. D. F. van Ree and L. Vasak, “Controls on Groundwater Quality in the NW Veluwe Catchment,” Soil Protection Series 11, Staatsuitgeveriji, Den hag, 1982, p. 140. [8] A. Grivall, C. S. Cole, B. Allard and P. Sanden, “Quality Trends of Public Water Supplies in Sweden. Acid Pre- cipitation and Human Health-Part 1,” Water Quality Bul- letin, Vol. 11, No. 1, 1986, pp. 6-11. Copyright © 2013 SciRes. JWARP 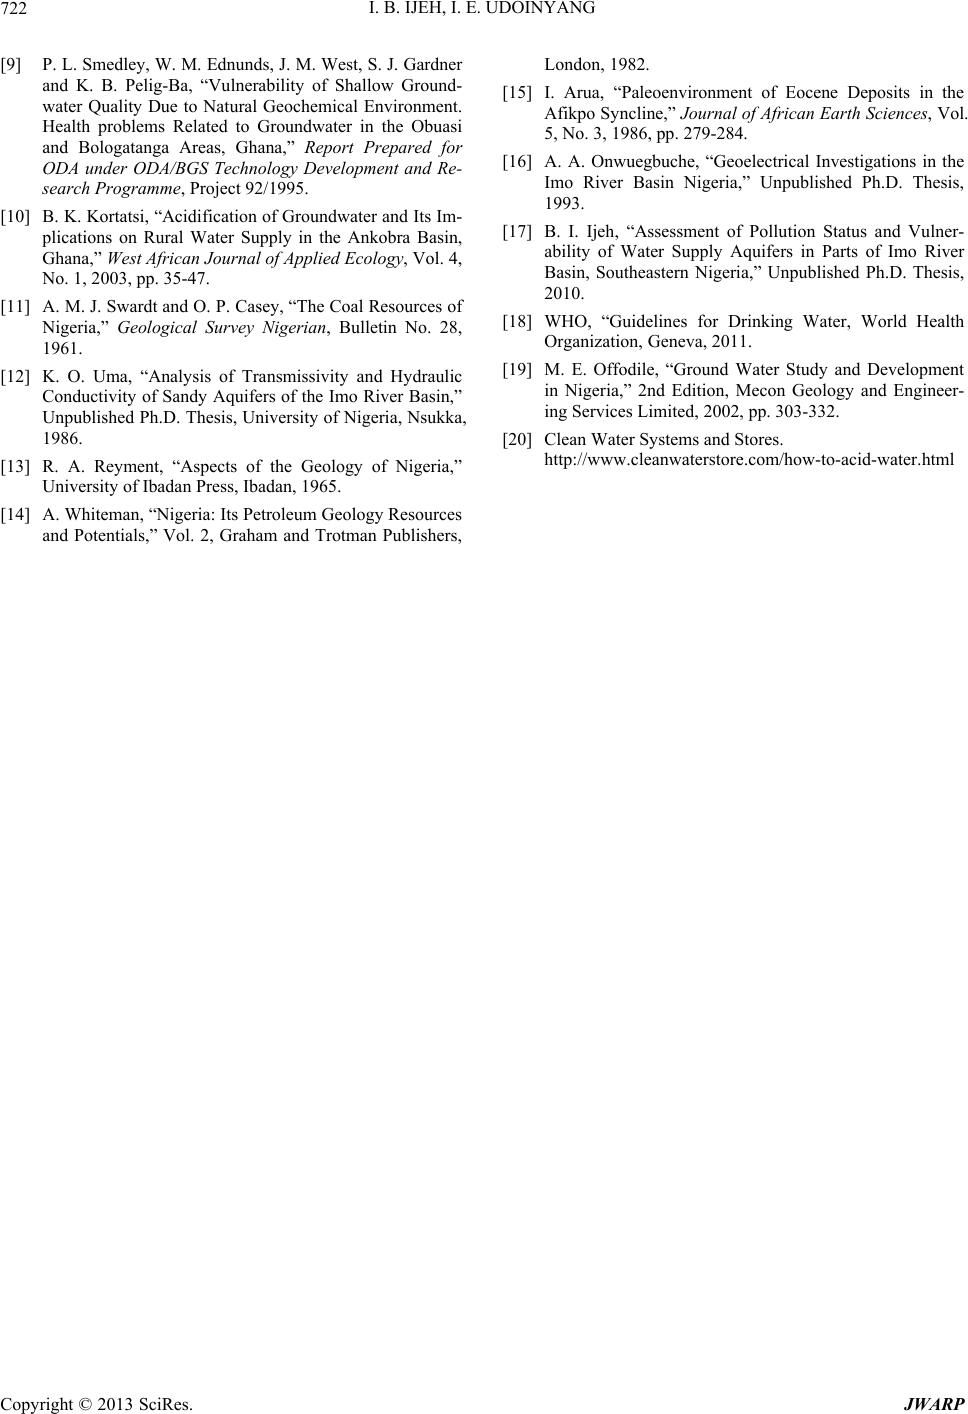 I. B. IJEH, I. E. UDOINYANG 722 [9] P. L. Smedley, W. M. Ednunds, J. M. West, S. J. Gardner and K. B. Pelig-Ba, “Vulnerability of Shallow Ground- water Quality Due to Natural Geochemical Environment. Health problems Related to Groundwater in the Obuasi and Bologatanga Areas, Ghana,” Report Prepared for ODA under ODA/BGS Technology Development and Re- search Programme, Project 92/1995. [10] B. K. Kortatsi, “Acidification of Groundwater and Its Im- plications on Rural Water Supply in the Ankobra Basin, Ghana,” West African Journal of Applied Ecology, Vol. 4, No. 1, 2003, pp. 35-47. [11] A. M. J. Swardt and O. P. Casey, “The Coal Resources of Nigeria,” Geological Survey Nigerian, Bulletin No. 28, 1961. [12] K. O. Uma, “Analysis of Transmissivity and Hydraulic Conductivity of Sandy Aquifers of the Imo River Basin,” Unpublished Ph.D. Thesis, University of Nigeria, Nsukka, 1986. [13] R. A. Reyment, “Aspects of the Geology of Nigeria,” University of Ibadan Press, Ibadan, 1965. [14] A. Whiteman, “Nigeria: Its Petroleum Geology Resources and Potentials,” Vol. 2, Graham and Trotman Publishers, London, 1982. [15] I. Arua, “Paleoenvironment of Eocene Deposits in the Afikpo Syncline,” Journal of African Earth Sciences, Vol. 5, No. 3, 1986, pp. 279-284. [16] A. A. Onwuegbuche, “Geoelectrical Investigations in the Imo River Basin Nigeria,” Unpublished Ph.D. Thesis, 1993. [17] B. I. Ijeh, “Assessment of Pollution Status and Vulner- ability of Water Supply Aquifers in Parts of Imo River Basin, Southeastern Nigeria,” Unpublished Ph.D. Thesis, 2010. [18] WHO, “Guidelines for Drinking Water, World Health Organization, Geneva, 2011. [19] M. E. Offodile, “Ground Water Study and Development in Nigeria,” 2nd Edition, Mecon Geology and Engineer- ing Services Limited, 2002, pp. 303-332. [20] Clean Water Systems and Stores. http://www.cleanwaterstore.com/how-to-acid-water.html Copyright © 2013 SciRes. JWARP
|