Paper Menu >>
Journal Menu >>
 J. Service Science & Management, 2010, 3, 429-439 doi:10.4236/jssm.2010.34049 Published Online December 2010 (http://www.SciRP.org/journal/jssm) Copyright © 2010 SciRes. JSSM 429 Urban Soundscape Informational Quantization: Validation Using a Comparative Approach Philippe Woloszyn1, Thomas Leduc2 1ESO Lab., Université de Haute Bretagne and CNRS, Rennes, France; 2CERMA Lab., ENSA Nantes and CNRS, Nantes, France. Email: philippe.woloszyn@univ-rennes2.fr, thom a s.leduc@cerma.archi.fr Received September 1st, 2010; revised October 12th, 2010; accepted November 17th, 2010. ABSTRACT Through interaction with environmental parameters such as light or sound, urban and architectural spaces generate ambiences with identifiab le characteristics. This notion of ambiences is related to the human being position through its perception o f environmental physica l phenomenon du ring a pedestrian walk. Presented work aims to evaluate, so as to characterize, the impact of sound ambiences (soundscape) onto an urban pedestrian pathway using GIS spatial dy- namical mapping. To carry out this scheme, our research work within AMBIOFLUX project concerns spatial interac- tion between sound ambience (soundscape) and man urban spatial trajectory (soundwalk). Spatial impression of soundsources or soundmarks has to be both defined through acoustical measurement and perception informational evaluation. The remainder of this paper is dedicated to the evaluation’s methodology of the pedestrian pathway’s acoustic fingerprint using the GearScape spatial formalism described thereafter. Preliminary results we have obtained will also be presented and validated. Keywords: Ambience, Soundscape, Soundmarks, Entropy evaluation, Information dimensioning, GIS semantics 1. Ambient Environment Perception and Representation AMBIOFLUX project concerns spatial interaction be- tween sound ambience (soundscape) and a human urban spatial trajectory (soundwalk). It defines ambiences as an anthropocentric view of the global environmental pro- duction through physical, human and built constraints of architectural and urban design. To model it, we consider urban space as a field of data aimed at ambiences physi- cal parameters description through multi-phenomenal characterization [1]. An application of this principle is currently proceeded through this interdisciplinary research project, called AMBIOFLUX, funded by CNRS, French National Cen- tre for Scientific Research, and MEEDDAT Ministry (French Ministry dedicated to Ecology, Energy, Sustain- able Development and land use planning) under PIRVE’s contract (Programme Interdisciplinaire de Recherche Ville et Environnement). The corresponding research work aims at producing dynamical urban environmental index for spatial interaction indicators between ambience and urban walkthrough [2]. From a software point of view, GearScape (a customi- zation of the OrbisGIS project initially developed by E. Bocher, F. González Cortés and T. Leduc in the CNRS FR 2488 context [3]) original spatial formalism process- ing aims to qualify pedestrian spatial interactions with producing a set of ambient dynamical indicators. This approach is therefore founded upon elementary sound sources description, organization and recognition with proceeding to its elementary hierarchic identifica- tion and systemic modeling [4,5]. 2. Soundmarks as Soundscape Psychophysical Encoded Elements Soundscape informational dimensioning will be consid- ered through urban sound sources spatial psychophysical indicators formulation, soundmarks. Murray Schäfer in- troduces the word “soundmarks” as a derivation of the word “landmark”, to identify sounds which sign the out- standing role of sounds to characterize a place [6]. In this sense, soundmarks describe sound events which get a specific informational status, mainly deno tative, that me- ans they are strong identity revealers. The dedicated informational order scaling corresponds to near-order indices, which can be evaluated through maximal information entropy. Therefore, soundmarks are 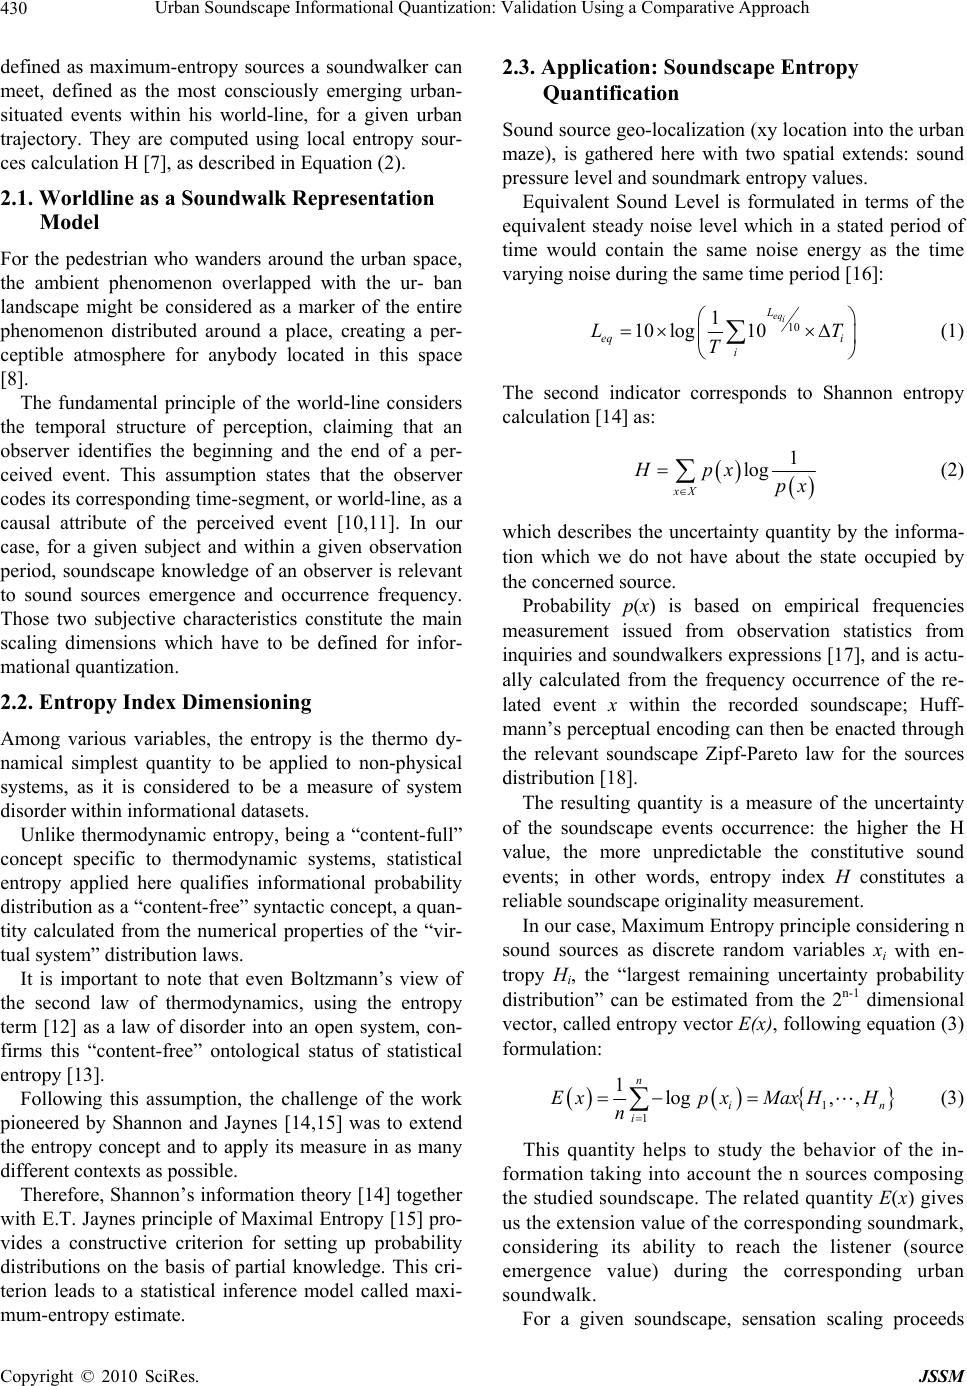 Urban Soundscape Informational Quantization: Validation Using a Comparative Approach 430 defined as maximum-entropy sources a soundwalker can meet, defined as the most consciously emerging urban- situated events within his world-line, for a given urban trajectory. They are computed using local entropy sour- ces calculation H [7], as described in Equation (2). 2.1. Worldline as a Soundwalk Representation Model For the pedestrian who wanders around the urban space, the ambient phenomenon overlapped with the ur- ban landscape might be considered as a marker of the entire phenomenon distributed around a place, creating a per- ceptible atmosphere for anybody located in this space [8]. The fundamental principle of the world-line considers the temporal structure of perception, claiming that an observer identifies the beginning and the end of a per- ceived event. This assumption states that the observer codes its corresponding time-segment, or world-line, as a causal attribute of the perceived event [10,11]. In our case, for a given subject and within a given observation period, soundscape knowledge of an observer is relevant to sound sources emergence and occurrence frequency. Those two subjective characteristics constitute the main scaling dimensions which have to be defined for infor- mational quantization . 2.2. Entropy Index Dimensioning Among various variables, the entropy is the thermo dy- namical simplest quantity to be applied to non-physical systems, as it is considered to be a measure of system disorder within informational datasets. Unlike thermodynamic entropy, being a “content-full” concept specific to thermodynamic systems, statistical entropy applied here qualifies informational probability distribution as a “content-free” syntactic concept, a quan- tity calculated from the numerical properties of the “vir- tual system” distribution laws. It is important to note that even Boltzmann’s view of the second law of thermodynamics, using the entropy term [12] as a law of disorder into an open system, con- firms this “content-free” ontological status of statistical entropy [1 3]. Following this assumption, the challenge of the work pioneered by Shannon and Jaynes [14,15] was to extend the entropy concept and to apply its measure in as many different contexts as possible. Therefore, Shannon’s information theory [14] together with E.T. Jaynes principle of Maximal Entr opy [15] pro- vides a constructive criterion for setting up probability distributions on the basis of partial knowledge. This cri- terion leads to a statistical inference model called maxi- mum-en tropy estimate. 2.3. Application: Soundscape Entropy Quantification Sound source geo-localization (xy location into the urban maze), is gathered here with two spatial extends: sound pressure level and soundmark entropy values. Equivalent Sound Level is formulated in terms of the equivalent steady noise level which in a stated period of time would contain the same noise energy as the time varying noise during the same time period [16]: 10 1 10log10 eqi L eq i i LT T (1) The second indicator corresponds to Shannon entropy calculation [14] as: 1 log xX Hpx px (2) which describes the uncertainty quantity by the informa- tion which we do not have about the state occupied by the concerned source. Probability p(x) is based on empirical frequencies measurement issued from observation statistics from inquiries and so undwalkers expr essions [17], and is actu- ally calculated from the frequency occurrence of the re- lated event x within the recorded soundscape; Huff- mann’s perceptual encoding can then be enacted through the relevant soundscape Zipf-Pareto law for the sources distribution [18]. The resulting quantity is a measure of the uncertainty of the soundscape events occurrence: the higher the H value, the more unpredictable the constitutive sound events; in other words, entropy index H constitutes a reliable soundscape originality measurement. In our case, Maximum Entropy principle considering n sound sources as discrete random variables xi with en- tropy Hi, the “largest remaining uncertainty probability distribution” can be estimated from the 2n-1 dimensional vector, called entropy vector E(x), following equation (3) formulation: 1 1 1log, , n in i Expx MaxHH n (3) This quantity helps to study the behavior of the in- formation taking into account the n sources composing the studied soundscape. The related quantity E(x) gives us the extension value of the corresponding soundmark, considering its ability to reach the listener (source emergence value) during the corresponding urban soundwalk. For a given soundscape, sensation scaling proceeds Copyright © 2010 SciRes. JSSM 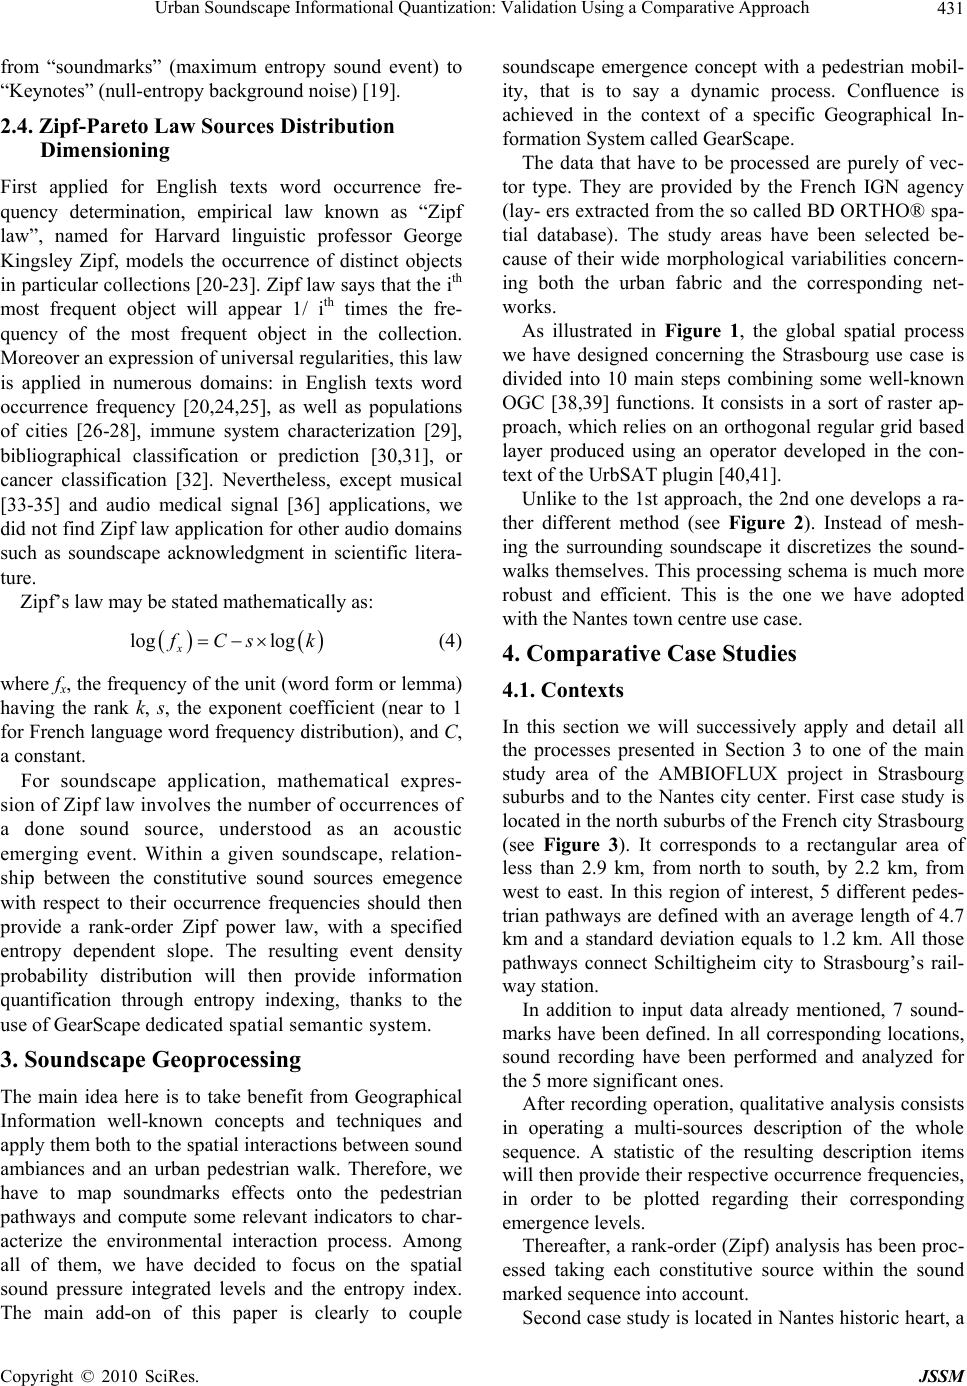 Urban Soundscape Informational Quantization: Validation Using a Comparative Approach 431 fr Firstlish texts word occurrence fre- f’s law may be stated mathematically as: om “soundmarks” (maximum entropy sound event) to “Keynotes” (null-en tropy background noise) [1 9]. 2.4. Zipf-Pareto Law Sources Distribution Dimensioning applied for Eng quency determination, empirical law known as “Zipf law”, named for Harvard linguistic professor George Kingsley Zipf, models the occurrence of distinct objects in particular collections [20 -23]. Zipf law says that the ith most frequent object will appear 1/ ith times the fre- quency of the most frequent object in the collection. Moreover an expression of universal regu larities, this law is applied in numerous domains: in English texts word occurrence frequency [20,24,25], as well as populations of cities [26-28], immune system characterization [29], bibliographical classification or prediction [30,31], or cancer classification [32]. Nevertheless, except musical [33-35] and audio medical signal [36] applications, we did not find Zipf law application for other audio domains such as soundscape acknowledgment in scientific litera- ture. Zip log log x f Cs k (4) where fx, the frequency of the unit (word form or lemma) dscape application, mathematical expres- si m Geographical are purely of vec- to ustrated in Figure 1, the global spatial process w d one develops a ra- th e will successively apply and detail all to input data already mentioned, 7 sound- m qualitative analysis consists in k-order (Zipf) analysis has been proc- es in Nantes historic heart, a having the rank k, s, the exponent coefficient (near to 1 for French language word frequency distribution), and C, a constant. For soun on of Zipf law involves the number of occurrences of a done sound source, understood as an acoustic emerging event. Within a given soundscape, relation- ship between the constitutive sound sources emegence with respect to their occurrence frequencies should then provide a rank-order Zipf power law, with a specified entropy dependent slope. The resulting event density probability distribution will then provide information quantification through entropy indexing, thanks to the use of GearScape dedicat ed s p a t i a l s e ma n t i c s y s t e m . 3. Soundscape Geoprocessing The main idea here is to take benefit fro Information well-known concepts and techniques and apply them both to the sp atial interactions between sou nd ambiances and an urban pedestrian walk. Therefore, we have to map soundmarks effects onto the pedestrian pathways and compute some relevant indicators to char- acterize the environmental interaction process. Among all of them, we have decided to focus on the spatial sound pressure integrated levels and the entropy index. The main add-on of this paper is clearly to couple soundscape emergence concept with a pedestrian mobil- ity, that is to say a dynamic process. Confluence is achieved in the context of a specific Geographical In- formation System called GearScape. The data that have to be processed r type. They are provided by the French IGN agency (lay- ers extracted from the so called BD ORTHO® spa- tial database). The study areas have been selected be- cause of their wide morphological variabilities concern- ing both the urban fabric and the corresponding net- works. As ill e have designed concerning the Strasbourg use case is divided into 10 main steps combining some well-known OGC [38,39] functions. It consists in a sort of raster ap- proach, which relies on an orthogonal regular grid based layer produced using an operator developed in the con- text of the UrbSAT plugin [40,41]. Unlike to the 1st approach, the 2n er different method (see Figure 2). Instead of mesh- ing the surrounding soundscape it discretizes the sound- walks themselves. This processing schema is much more robust and efficient. This is the one we have adopted with the Nantes town centre use case. 4. Comparative Case Studies 4.1. Contexts In this section w the processes presented in Section 3 to one of the main study area of the AMBIOFLUX project in Strasbourg suburbs and to the Nantes city center. First case study is located in the north suburbs of the French city S tr a s b ou rg (see Figure 3). It corresponds to a rectangular area of less than 2.9 km, from north to south, by 2.2 km, from west to east. In this region of interest, 5 different pedes- trian pathways are defined with an average length of 4.7 km and a standard deviation equals to 1.2 km. All those pathways connect Schiltigheim city to Strasbourg’s rail- way station. In addition arks have been defined. In all corresponding locations, sound recording have been performed and analyzed for the 5 more significant ones. After recording operation, operating a multi-sources description of the whole sequence. A statistic of the resulting description items will then provide their respective o ccurrence frequencies, in order to be plotted regarding their corresponding emergence levels. Thereafter, a ran sed taking each constitutive source within the sound marked sequence into account. Second case study is located Copyright © 2010 SciRes. JSSM 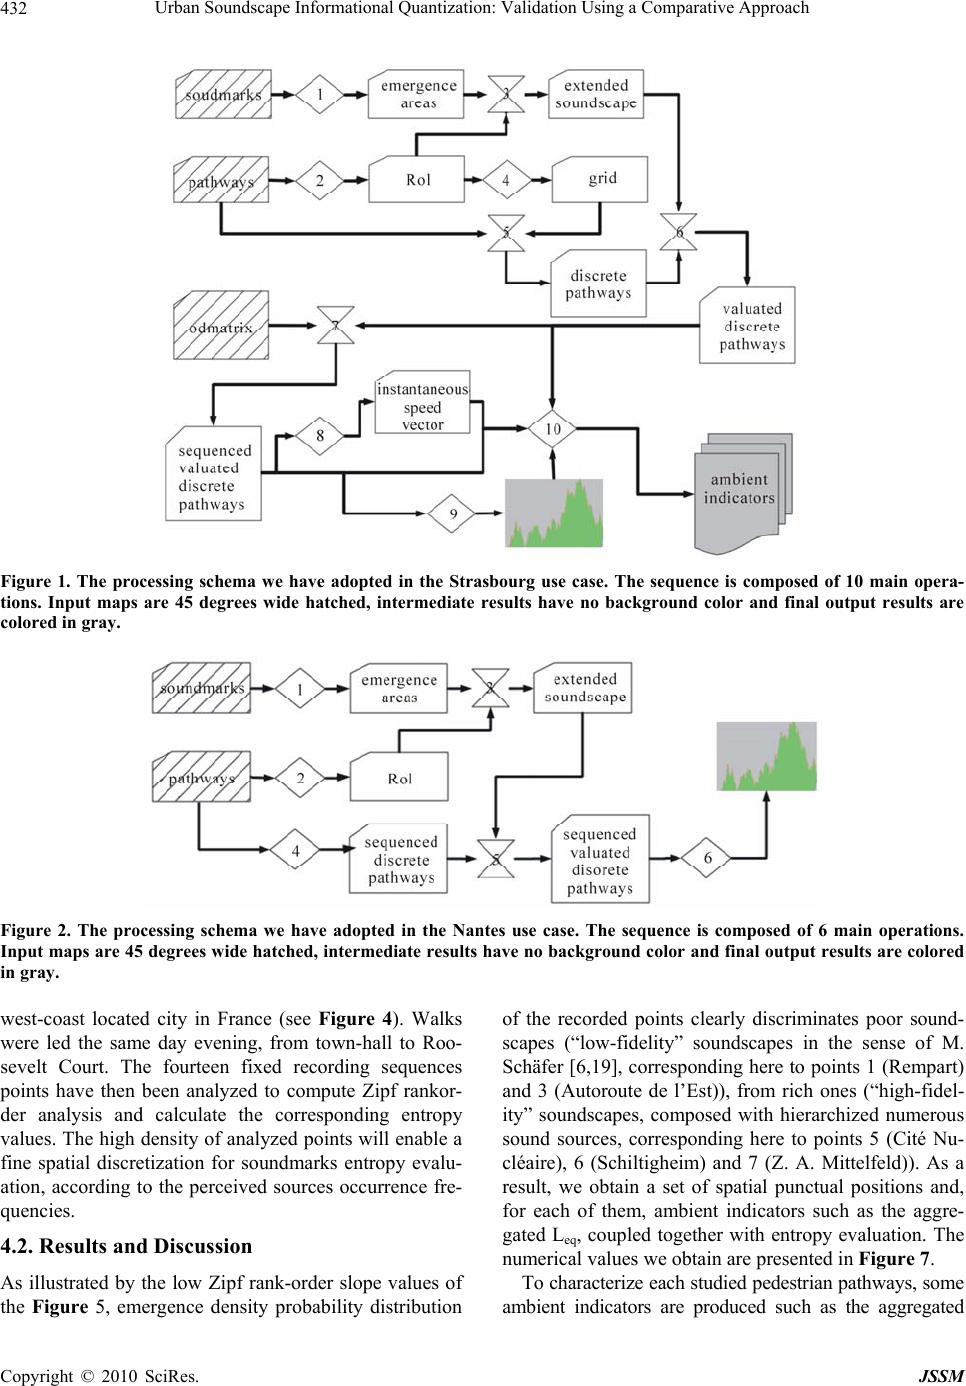 Urban Soundscape Informational Quantization: Validation Using a Comparative Approach Copyright © 2010 SciRes. JSSM 432 Figure 1. The processing schema we have adopted in the Strasbourg use case. The sequence is composedf 10 main opera- o tions. Input maps are 45 degrees wide hatched, intermediate results have no background color and final output results are colored in gray. Figure 2. The processing schema we have adopted in the Nantes use case. The sequence is composed of main operations. est-coast located city in France (see Figure 4). Walks lts and Discussion nk-order slope values of of the recorded points clearly discriminates poor sound- ed 6 Input maps are 45 degrees wide hatched, interme diate results have no background color and final output results are colored in gray. w were led the same day evening, from town-hall to Roo- sevelt Court. The fourteen fixed recording sequences points have then been analyzed to compute Zipf rankor- der analysis and calculate the corresponding entropy values. The high dens ity of analyzed points will enable a fine spatial discretization for soundmarks entropy evalu- ation, according to the perceived sources occurrence fre- quencies. 4.2. Resu As illustrated by the low Zipf ra the Figure 5, emergence density probability distribution scapes (“low-fidelity” soundscapes in the sense of M. Schäfer [6,19], corresponding here to points 1 (Rempart) and 3 (Autoroute de l’Est)), from rich ones (“high-fidel- ity” soundscapes, composed with hierarchized numerous sound sources, corresponding here to points 5 (Cité Nu- cléaire), 6 (Schiltigheim) and 7 (Z. A. Mittelfeld)). As a result, we obtain a set of spatial punctual positions and, for each of them, ambient indicators such as the aggre- gated Leq, coupled together with entropy evaluation. The numerical values we obtain are presented in Figure 7. To characterize each studied pedestr ian pathways, some ambient indicators are produced such as the aggregat 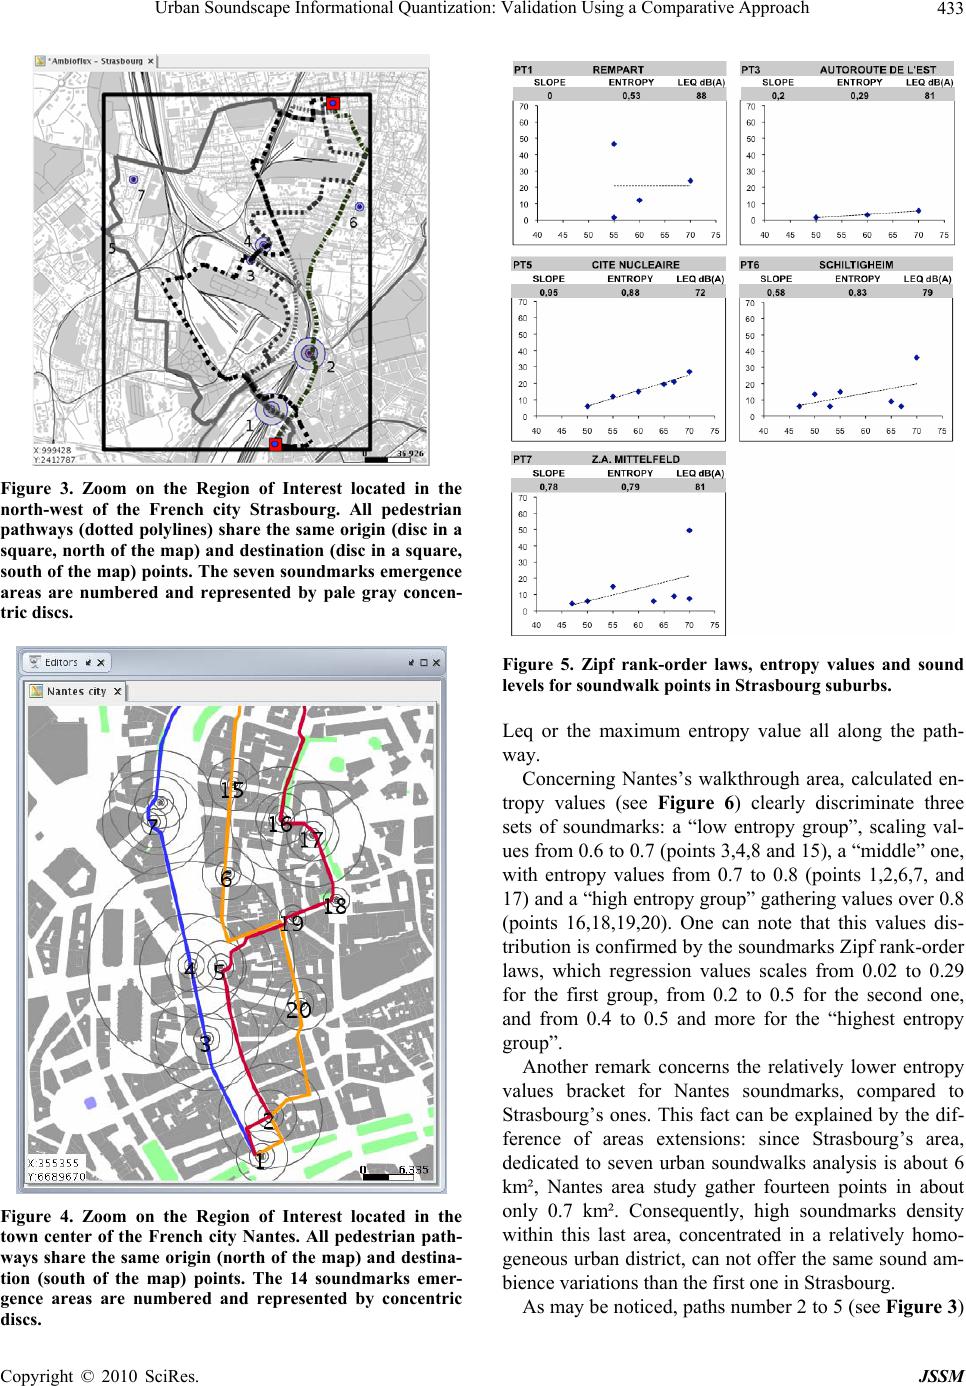 Urban Soundscape Informational Quantization: Validation Using a Comparative Approach 433 Figure 3. Zoom on the Region of Interest located ine north-west of the French city Strasbourg. All pedesian th tr pathways (dotted poly lines) share the same origin (disc in a square, north of the map) and destination (disc in a square, south of the map) points. The seven soundmarks emergence areas are numbered and represented by pale gray concen- tric discs. Figure 4. Zoom on the Region of Interest located in the town center of the French city Nantes. All pedestrian pa- th ways share the same origin (north of the map) and destina- tion (south of the map) points. The 14 soundmarks emer- gence areas are numbered and represented by concentric discs. Figure 5. Zipf rank-order laws, entropy values and sound levels for soundwalk points in Strasbourg suburbs. Leq or the maximum entropy value all along the path- way. Concerning Nantes’s walkthrough area, calculated en- tropy values (see Figure 6) clearly discriminate three sets of soundmarks: a “low entropy group”, scaling val- ues from 0.6 to 0.7 (points 3,4,8 and 15), a “middle” one, with entropy values from 0.7 to 0.8 (points 1,2,6,7, and 17) and a “high entropy group” gathering values over 0.8 (points 16,18,19,20). One can note that this values dis- tribution is confirmed by the so undmarks Zipf rank-order laws, which regression values scales from 0.02 to 0.29 for the first group, from 0.2 to 0.5 for the second one, and from 0.4 to 0.5 and more for the “highest entropy group”. Another remark concerns the relatively lower entropy values bracket for Nantes soundmarks, compared to Strasbourg’s ones. This fact can be explained by the dif- ference of areas extensions: since Strasbourg’s area, dedicated to seven urban soundwalks analysis is about 6 km², Nantes area study gather fourteen points in about only 0.7 km². Consequently, high soundmarks density within this last area, concentrated in a relatively homo- geneous urban district, can not offer the same sound am- bience variations than the first one in Strasbourg. As may be noticed, paths number 2 to 5 (see Figure 3) Copyright © 2010 SciRes. JSSM 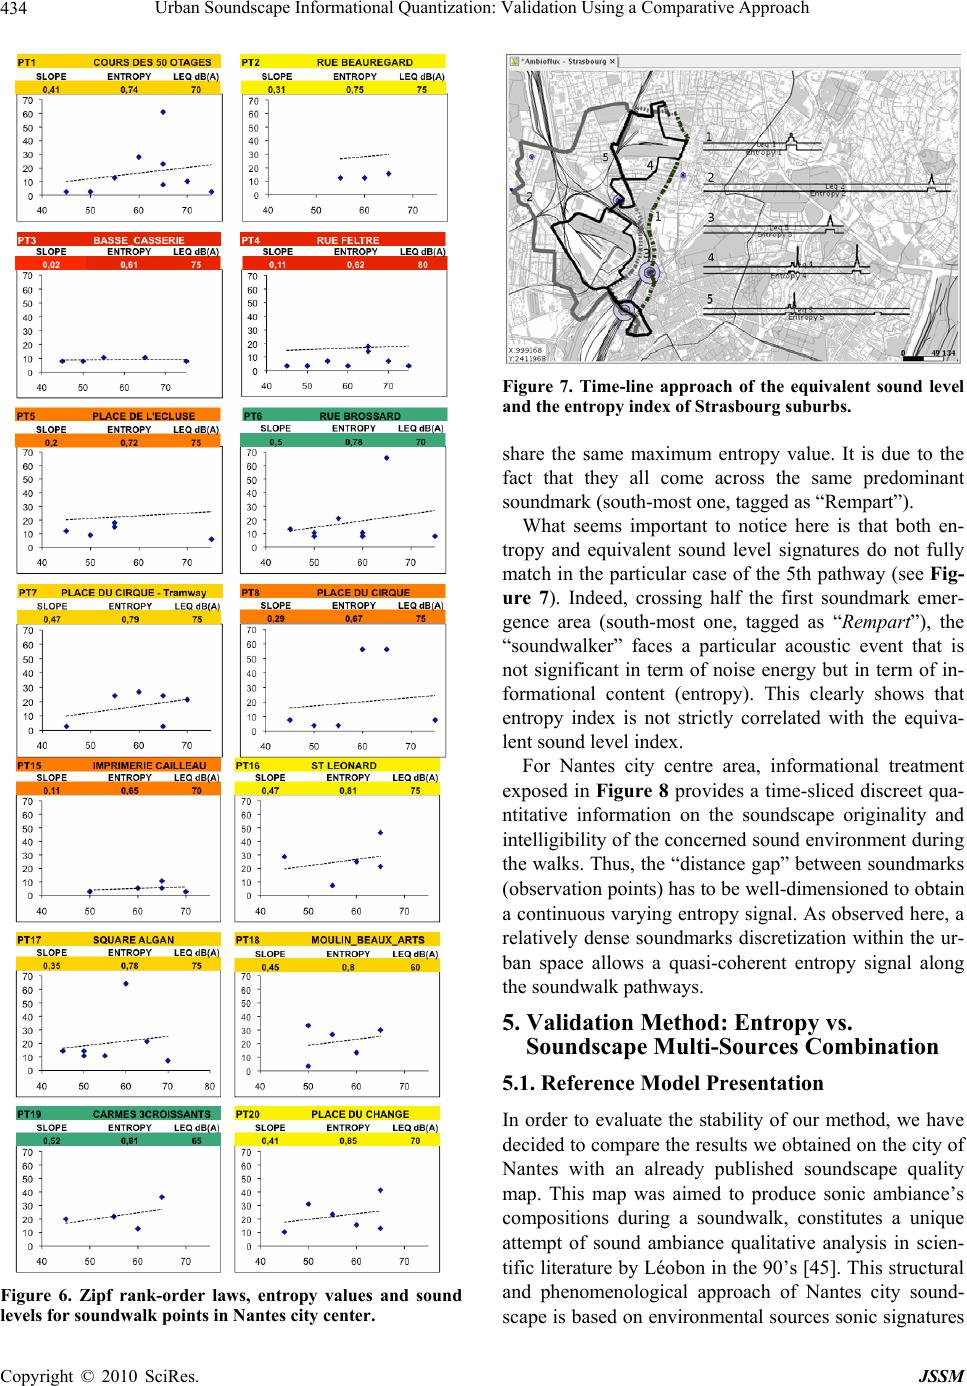 Urban Soundscape Informational Quantization: Validation Using a Comparative Approach 434 Figure 7. Time-line approach of the equivalent sound level and the entropy index of Strasbourg subur bs. share the same maximum entropy value. It is due to the fact that they all come across the same predominant soundmark (south-most one, tagged as “Rempart”). What seems important to notice here is that both en- tropy and equivalent sound level signatures do not fully match in the particular case of the 5th pathway (see Fig- ure 7). Indeed, crossing half the first soundmark emer- gence area (south-most one, tagged as “Rempart”), the “soundwalker” faces a particular acoustic event that is not significant in term of noise energy but in term of in- formational content (entropy). This clearly shows that entropy index is not strictly correlated with the equiva- lent sound level index. For Nantes city centre area, informational treatment exposed in Figure 8 provides a time-sliced discreet qua- ntitative information on the soundscape originality and intelligibility o f the concern ed sound environment dur ing the walks. Thus, the “distance gap” between sound marks (observation points) has to be well-dimensioned to obtain a continuous varying entrop y signal. As observed here, a relatively dense soundmarks discretization within the ur- ban space allows a quasi-coherent entropy signal along the soundwalk pathways. 5. Validation Method: Entropy vs. Soundscape Multi-Sources Combination 5.1. Reference Model Presentation In order to evaluate the stability of our method, we have decided to compare the results we obtained on the city of Nantes with an already published soundscape quality map. This map was aimed to produce sonic ambiance’s compositions during a soundwalk, constitutes a unique attempt of sound ambiance qualitative analysis in scien- tific literature by Léobon in the 90’s [45]. This structural ignatures and phenomenological approach of Nantes city sound- scape is based on environmental sources sonic s Figure 6. Zipf rank-order laws, entropy values and sound levels for soundwalk points in Nantes city center. Copyright © 2010 SciRes. JSSM 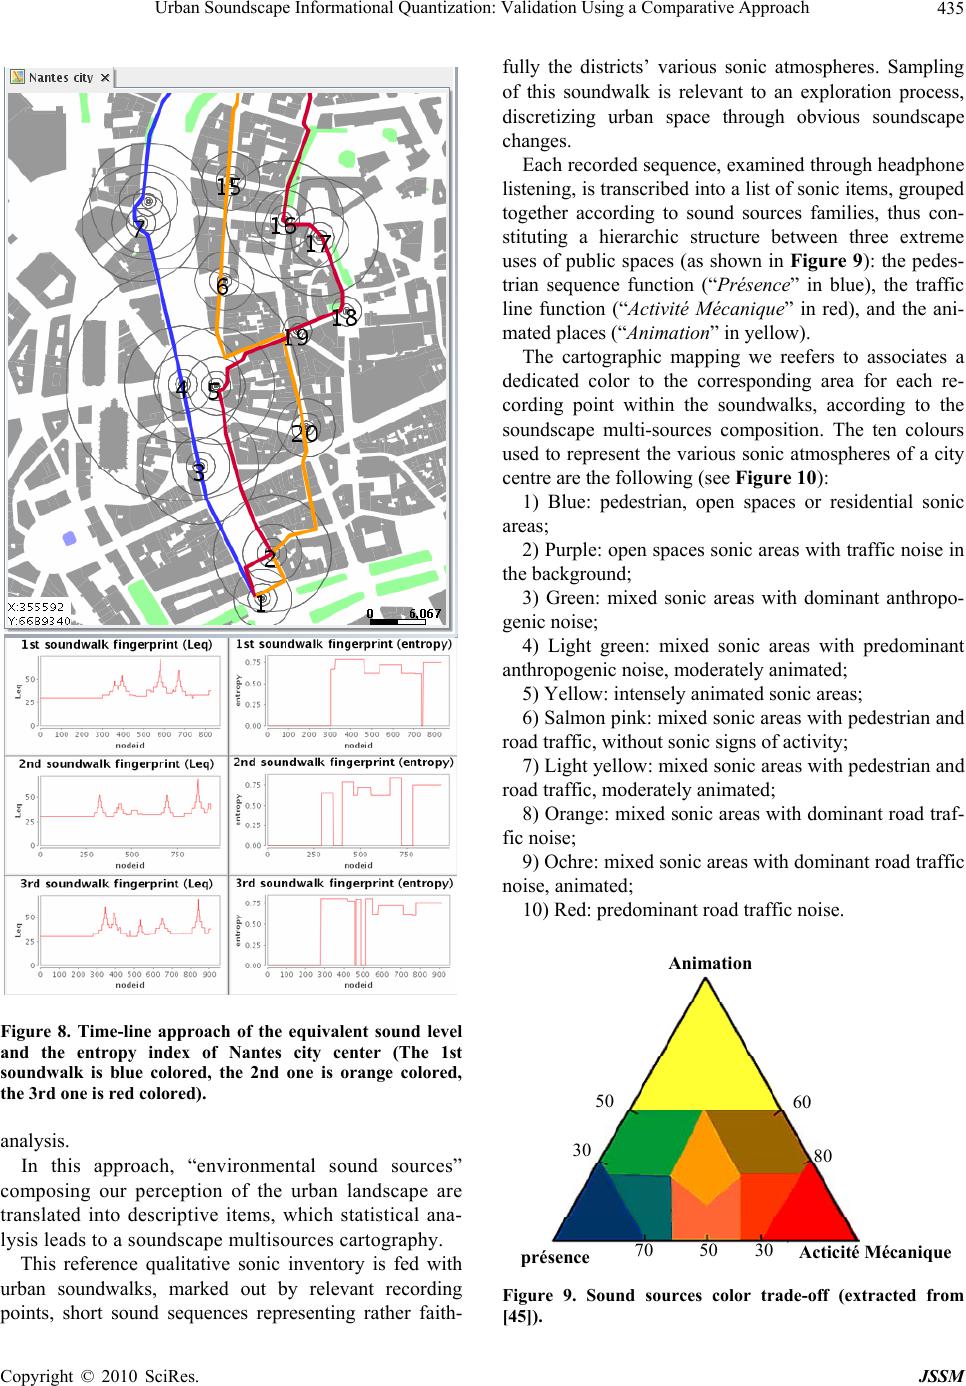 Urban Soundscape Informational Quantization: Validation Using a Comparative Approach 435 Figure 8. Time-line approach of the equivalent sound lev d the entropy index of Nantes city center (The 1el anst orange colored, fully the districts’ various sonic atmospheres. Sampling of this soundwalk is relevant to an exploration process, discretizing urban space through obvious soundscape changes. Each record ed sequence, examin ed thro ugh headphon e listening, is transcribed into a list of sonic ite ms, grouped together according to sound sources families, thus con- stituting a hierarchic structure between three extreme uses of public spaces (as shown in Figure 9): the pedes- trian sequence function (“Présence” in blue), the traffic line function (“Activité Mécanique” in red), and the ani- mated places (“Animation” in yellow). The cartographic mapping we reefers to associates a dedicated color to the corresponding area for each re- cording point within the soundwalks, according to the soundscape multi-sources composition. The ten colours used to represent the various sonic atmospheres of a city centre are the following (see Figure 10): 1) Blue: pedestrian, open spaces or residential sonic areas; 2) Purple: open spaces sonic areas with traffic noise in the background; 3) Green: mixed sonic areas with dominant anthropo- genic noise; 4) Light green: mixed sonic areas with predominant anthropogenic noise, moderately animated; 5) Yellow: intensely animated sonic areas; 6) Salmon pink: mixed sonic areas with pedestrian and road traffic, without sonic signs of activity; 7) Light yellow: mixed sonic areas with pedestrian and road traffic, moderately animated; 8) Orange: mixed sonic areas with dominant road traf- fic noise; 9) Ochre: mixed sonic areas with dominant road traffic noise, animated; 10) Red: predominant road traffic noise. soundwalk is blue colored, the 2nd one is the 3rd one is red colored). analysis. In this approach, “environmental sound sources” composing our perception of the urban landscape are translated into descriptive items, which statistical ana- lysis leads to a soundscape multisources cartography. This reference qualitative sonic inventory is fed with urban soundwalks, marked out by relevant recording points, short sound sequences representing rather faith- Animation présence Acticité Mécanique 70 50 30 Figure 9. Sound sources color trade-off (extracted from [45]). 50 60 30 80 Copyright © 2010 SciRes. JSSM 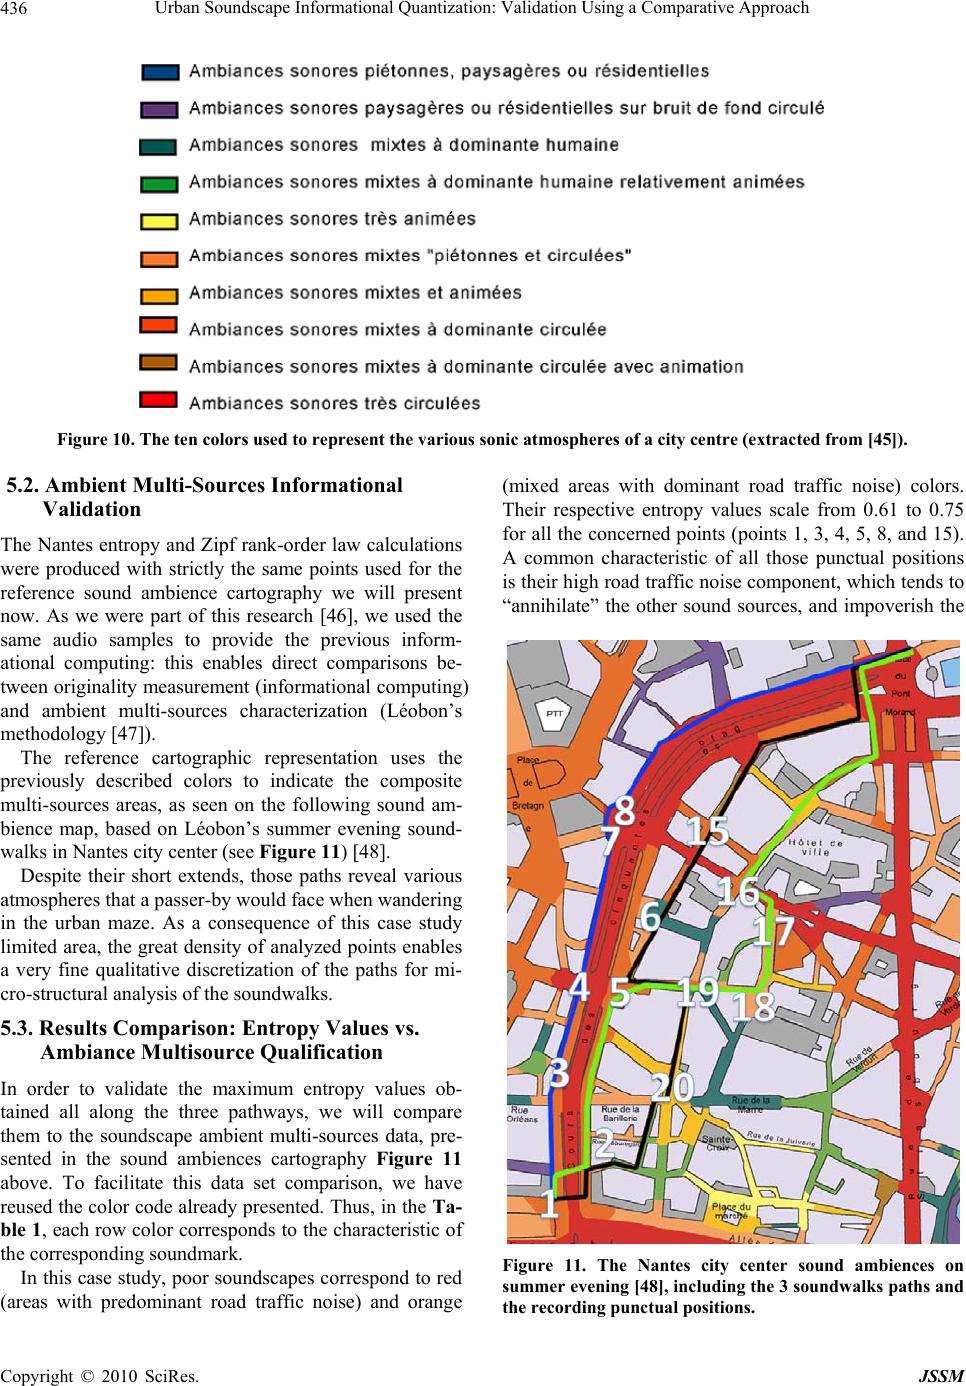 Urban Soundscape Informational Quantization: Validation Using a Comparative Approach Copyright © 2010 SciRes. JSSM 436 Figure 10. The ten colors used to represent the various 5.2. Ambient Multi-Sources Inform sonic atmospheres of a city centre (extracted from [45]). Th ith strictly the same points used for the re mputing) and am methodology [47]). The reference cartographic representation uses the previously described colors to indicate the composite multi-sources areas, as seen on the following sound am- bience map, based on Léobon’s summer evening sound- walks in Nantes city center (see Figure 11) [48]. Despite their short extends, those paths reveal various atmospheres that a passer-by would face when wandering in the urban maze. As a consequence of this case study limited area, the great density of analyzed points enables a very fine qualitative discretization of the paths for mi- cro-structural an alysis of the soundwalks. 5.3. Results Comparison: Entropy Values vs. Ambiance Multisource Qualification In ord ined all along the three pathways, we will compare pre- sented ambiences cartography Figure 11 (mixed areas with dominant road traffic noise) colors. Their respective entropy values scale from 0.61 to 0.75 for all the concerned points (points 1, 3, 4, 5, 8, and 15). A common characteristic of all those punctual positions is their high road traffic noise component, which tends to “annihilate” the other sound sources, and impoverish th ational Validation e Nantes entropy and Zipf rank-order law calculations were produced w ference sound ambience cartography we will present now. As we were part of this research [46], we used the sa e me audio samples to provide the previous inform- ational computing: this enables direct comparisons be- tween originality measurement (informational co bient multi-sources characterization (Léobon’s er to validate the maximum entropy values ob- ta them to the soundscape ambient multi-sources data, d in the soun above. To facilitate this data set comparison, we have reused th e color code alr eady presen ted. Thus, in th e Ta- ble 1, each row color corresponds to the characteristic of the corresponding soundmark. In this case study, poor sou ndscapes correspond to red (areas with predominant road traffic noise) and orange Figure 11. The Nantes city center sound ambiences on summer evening [48], including the 3 soundw alks paths and the recording punctual positions. 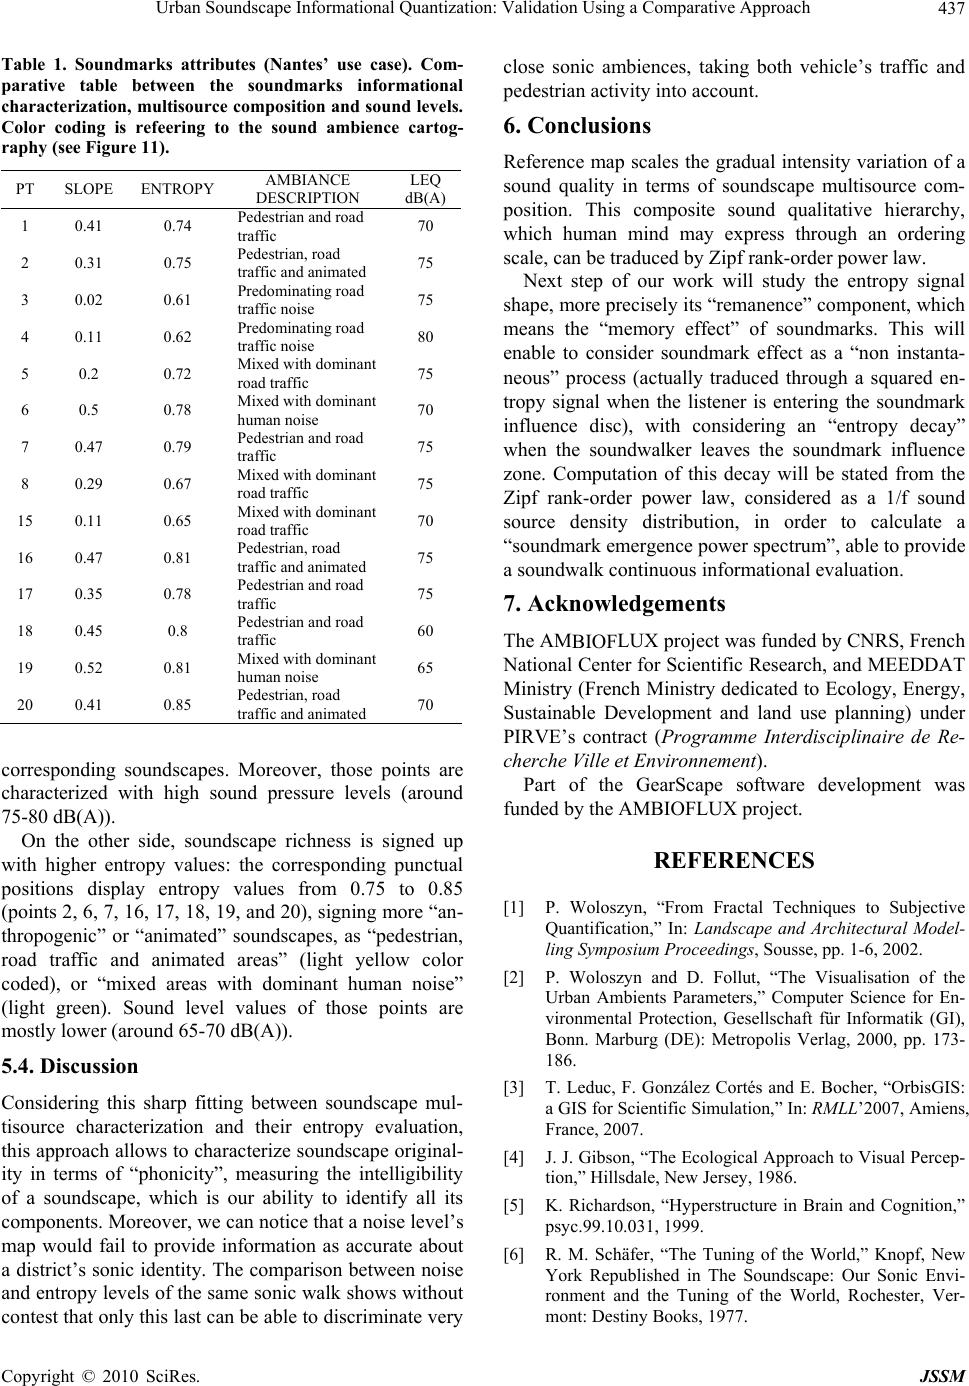 Urban Soundscape Informational Quantization: Validation Using a Comparative Approach 437 Ta N LEQ dB(A) ble 1. Soundmarks attributes (Nantes’ use case). Com- parative table between the soundmarks informational characterization, multisource composition and sound levels. Color coding is refeering to the sound ambience cartog- raphy (see Figure 11). PT SLOPE ENTROPY AMBIANCE DESCRIPTIO 1 0.41 0.74 Pedestrian and road traffic 70 2 0.31 0.75 traffic and animated 75 3 0.02 0.61 Predominating road traffic noise 75 4 0.11 0.62 Predominating road traffic noise 80 5 0.2 0.72 Mixed with dominant road traffic 75 6 0.5 0.78 Mixed with dominant human noise 70 7 0.47 0.79 Pedestrian and road Pedestrian, road traffic 8 0.29 0.67 Mixed with dominant road traffic 75 15 0.11 0.65 Mixed with dominant road traffic 70 16 0.47 0.81 Pedestrian, road traffic and animated 75 17 0.35 0.78 Pedestrian and road traffic 75 18 0.45 0.8 Pedestrian and road traffic 60 75 19 0.52 0.81 ixed with dominant human noise 65 20 0.41 0.85 Pedestrian, road traffic and animated 70 M corresponding soundscapes. Moreover, those points are characterized with high sound pressure levels (around 75-80 dB(A)). On the other side, soundscape richness is signed up with higher entropy values: the corresponding punctual positions display entropy values from 0.75 to 0.85 (points 2, 6, 7, 16, 17, 18, 19, and 20), signing more “an- thropogenic” or “animated” soundscapes, as “pedestrian, road traffic and animated areas” (light yellow color coded), or “mixed areas with dominant human noise” (light green). Sound level values of those points are mostly lower (around 65-70 dB(A)). 5.4. Discussion Considering this sharp fitting between soundscape mul- tisource characterization and their entropy evaluation, this approach allows to characterize soundscape original- ity in terms of “phonicity”, measuring the intelligibility of a soundscape, which is our ability to identify all its components. Moreover, we can notice that a noise level’s map would fail to provide information as accurate about a district’s sonic identity. The comparison between noise oth vehicle’s traffic and s of soundurce co- pion csou hi wh hu mindy en o sc, caraduc Ziprder power law xt f ourk wy signal shape, more precisely its “rem ent, which means temofect”marks. This will enle tosider man inta- neous” process (actually traduared en- tro sigen tteneng the sounrk influencec), wonsiy dy” when the soundwalker leav influence zone. Coation is ded frohe Zianer polaw,/f nd source density distributionlculate a “dmmergewo prde a soundwontininfoation. 7. Acknowledgements The AMLUX ect wRS, Fch National ter for ScientifiEDDAT Mstrych M de, E, Sustnablevelopm ananning) uder PIRVE’s cPramire de Re- herche Ville et Environnemen t). onzález Cortés and E. Bocher, “OrbisGIS: and entropy lev els of the same sonic walk shows without contest that only this last can be able to discri minate very close sonic ambiences, taking b pedestrian activity into account. 6. Conclusions Reference map scales the gradual intensity variation of a sound quality in termscape multisom erarchy, rding osit. Thisomposite nd qualitative ich ale man n be t ma ed byxpress through a f rank-oer . Nestep o worill study the entrop anence” compon of soundhe “mry ef ab consoundrk effect as a “nostan uced through a sq r is enteripynal whhe lisdma disith cdering an “entropeca es the soundmark ecay will be statmputof thm t pf rk-ordwer considered as a 1sou , in order to ca er spectrum”, able tsounark ence poovi alk cuous rmational evalu BIOF Cen projas funded by CN c Reseren arch, an d ME dicated to Ecologyini (Freninistrynergy aie D ontract (ent ogr d land use pl me Interdisciplinan cPart of the GearScape software development was funded by the AMBIOFLUX project. REFERENCES [1] P. Woloszyn, “From Fractal Techniques to Subjective Quantification,” In: Landscape and Architectural Model- ling Symposium Proceedings, Sousse, pp. 1-6, 2002. [2] P. Woloszyn and D. Follut, “The Visualisation of the Urban Ambients Parameters,” Computer Science for En- vironmental Protection, Gesellschaft für Informatik (GI), Bonn. Marburg (DE): Metropolis Verlag, 2000, pp. 173- 186. [3] T. Leduc, F. G a GIS for Scientific Simulation,” In: RMLL’2007, Amiens, France, 2007. [4] J. J. Gibson, “The Ecological Approach to Visual Percep- tion,” Hillsdale, New Jersey, 1986. [5] K. Richardson, “Hyperstructure in Brain and Cognition,” psyc.99.10.031, 1999. [6] R. M. Schäfer, “The Tuning of the World,” Knopf, New York Republished in The Soundscape: Our Sonic Envi- ronment and the Tuning of the World, Rochester, Ver- mont: Destiny Books, 1977. Copyright © 2010 SciRes. JSSM  Urban Soundscape Informational Quantization: Validation Using a Comparative Approach 438 [7] P. Woloszyn and G. Bourdin, “Urban HyperScape: A Community Game for Territorial Knowledge,” In: Second International Annual Conference of Territorial Intelli- gence, Huelva (Spain) October 24th-27th, 2007, Obser- Empleo, Huelva, pp. 219-242. l The- ,” University of Illinois Pre [17] P. Woloszyn, “An Acoustic Ambience Study by Immer- sive Sound Reonference Bu with Sounds, Par f the ledge), 1992. rsity Press, 1932. al of Documentation Place of Zipf’s and Pareto’s Law Vol. 13, No. 5-6, 1988, pp. Informa- 3, pp. 717-720. and Urban Economics ystem,” Biosystems, Vol. 39, No. rowicz, “The Theoretical Foundation of Zipf’s w in Importance of Genes uters: MIDI-Encoded Music and the ic Journal, Vol. 29, No. 1, and the vatorio Local de [8] P. Woloszyn and G. Bourdin, “The Hyperscape Project: Participative Game Informational Construction,” 6th An- nual International Conference of Territorial Intelligence, Besançon, 2008. [9] A. A. Moles, “Théorie Structurale de la Communication et Société,”Paris, Masson/CNET/ENST, 1988, p. 295. htt [10] R. G. Barker, “Structure of the Stream of Behavior,” Pr- oceedings of the 15th International Congress of Psychol- ogy, 1957, pp. 155-156. [11] R. G. Barker, “The Stream of Behavior as an Empirical Problem,” The Stream of Behavior, New York, Appleton of Century Crofts, 1963, pp. 1-22. [12] D. A. Salvo, “Boltzmann and Hertz on the Bild- concep- tion of Physical Theory,” History of Science, Vol. 28, No. 79, 1990, pp. 380-398. [13] K. D. Bailey, “Social Entropy Theory: An Application of Nonequilibrium Thermodynamics in Human Ecology,” Advances in Human Ecology, Vol. 2, 1993, pp. 133-161. [14] C. E. Shannon and W. Weaver “The Mathematica ory of Information Urbana 1949. ss, a [15] E. T. Jaynes, “Where do We Stand on Maximum En- tropy?” The Maximum Entropy Formalism, Raphael D. Levine and Myron Tribus, editors, The MIT Press, Cam- bridge, MA, 1979, pp. 15-118. [16] EPA (U. S. Environmental Protection Agency), “Infor- mation on Levels of Environmental Noise Requisite to Protect Public Health and Welfare with an Adequate Margin of Safety,” EPA/ONAC 550/974004 Washington, D.C., 1974. cognition,” European C is, March 2005. ilding Zipf-Mandelbrot Law,” Proceedings of the IEEE South- eastCon 2002, New York: Institute of Electrical and Electronics Engineers, 2002, pp. 52-57. [34] B. Manaris and Alii, “Zipf’s Law, Music Classification, and Aesthetics,” Computer Mus http://rp.urbanisme.equipe-ment.gouv.fr/puca/agenda/DA FAG_WoloszynA_170305.pdf [18] G. K. Zipf, “Human Behaviour and the Principle o Least Effort,” Addison-Wesley, Reading, 1949. [19] R. M. Schafer, “Music, Non-Music and the Soundscape,” Companion to Contemporary Musical Thought, Vol. 1, Paynter, J. Howell, T. R. Orton and P. Seymour, (ed.’s) (Rout [20] G. K. Zipf, “Selected Studies of the Principle of Relative Frequencies of Language,” Cambridge, Massachusetts: Harvard Unive [21] B. C. Brookes, “The Derivation and Application of the Bradford-Zipf Distribution,” Journ , ti Vol. 24, No. 4, 1968, pp. 247-265. [22] L. Egghe, “The Exact amongst the Classical Information Laws,” Scientometrics, Vol. 20, No. 1, 1991, pp. 93-106. [23] M. Kunz, M. Lotka and G. K. Zipf “Paper Dragons with Fuzzy Tails,” Scientometrics, 289-297. [24] D. C. Blair, “Language and Representation in Information Retrieval,” Amsterdam, Elsevier, 1990. [25] W. Li, “Random Texts Exhibit Zipf’s-Law-Like Word Frequency Distribution,” IEEE Transactions on tion Theory, Vol. 38, No. 6, 1992, pp. 1842-1845. [26] X. Gabaix, “Zips’s Law for Cities: An Explanation,” Quarterly Journal of Economics, Vol. 114, No. 3, 1999, pp. 739-767. p://econ-www.mit.edu/faculty/download_pdf.php?id=5 30. [27] R. Kali, “The City as a Giant Component: A Random Graph Approach to Zipf’s Law,” Applied Economics Let- ters, Vol. 10, No. 11, 200 [28] K. T. Soo, “Zipf’s Law for Cities: A Cross Country In- vestigation, Mimeo,” An Updated Version has been Pub- lished in 2005 in Regional Science Vol. 35, No. 3, 2002, pp. 239-263. [29] J. D. Burgos and P. Moreno-Tovar, “Zipf-Scaling Be- havior in the Immune S 3, 1996, pp. 227-232. [30] R. A. Fairthorne, “Empirical Hyperbolic Distributions (Bradford-Zipf-Mandelbrot) for Bibliometric Description nd Prediction,” Journal of Documentation, Vol. 25, No. 4, 1969, pp. 319-343. [31] J. Fedo Law and its Application to the Bibliographic Database Environment,” Journal of the American Society for In- formation Science, Vol. 33, No. 5, 1982, pp. 285-293. [32] W. Li and Y. Yang, “Zipf’s La for Cancer Classification Using Microarray Data,” Jour- nal of Theoretical Biology, 2002, pp. 539-551. [33] B. Manaris, T. Purewal and C. McCormick, “Progress Towards Recognizing and Classifying Beautiful Music with Comp 2005, pp. 55-69. [35] B. Manaris et al., “Evolutionary Music Zipf-Mandelbrot Law: Progress towards Developing Fit- ness Functions for Pleasant Music,” Proceedings of Evo- MUSART2003-1st European Workshop on Evolutionary Music and Art, Berlin: Springer-Verlag, 2003, pp. 522- 534. [36] E. Dellandréa, P. Makris and N. Vincent, “Zipf analysis of Audio Signals,” Fractals Vol. 12, No. 1, World Scien- fic Publishing, Singapore, 2004, pp.73-85. [37] B. Mandelbrot, “Information Theory and Psycholinguis- tics,” R. C. Oldfield and J. C. Marchall, Eds., Language, Penguin Books, 1968. [38] J. R. Herring, “OpenGIS® Implementation Specification for Geographic information - Simple Feature Access-Part Copyright © 2010 SciRes. JSSM  Urban Soundscape Informational Quantization: Validation Using a Comparative Approach Copyright © 2010 SciRes. JSSM 439 eriza- 008. Spatial SQL to Urban Indicator Definition and Pro- formation Technolo- zalez Cortés, ity Global e L’Acoustique et la Ville, 1: Common architecture,” 2006. http://www.opengeospatial.org/standards/sfs J. R. Herr[39] ing, “OpenGIS® Implementation Specification for Geographic Information - Simple Feature Access - Part 2: SQL option,” October 2006. http://www.opengeospatial.org/standards/sfs [40] N. Long, E. Bocher, T. Leduc and G. Moreau. “Sensitiv- ity of Spatial Indicators for Urban Terrain Charact tion,” In: IEEE International Geoscience & Remote Sensing Symposium, IGARSS-2008, Boston, Massachu- setts, U.S.A., 2 [41] E. Bocher, T. Leduc and F. González Cortés, “UrbSAT: from duction,” In: Free and Open Source Software for Geo- spatial Conference, FOSS4G’2008, Cape Town, South Africa, 2008. [42] T. Leduc, E. Bocher and G. Moreau, “GDMS-R: A Mixed SQL to Manage Raster and Vector Data,” In: J. Horak, L. Halounova, D. Kusendova, P. Rapant, and V. Vozenlek, Eds., Advances in Geoin gies, Chapter 4, pp. 43-56. VSB-Technical University of Ostrava, Czech Republic, 2009. [43] E. Bocher, T. Leduc, G. Moreau and F. Gon “GDMS: an Abstraction Layer to Enhance Spatial Data Infrastructures Usability,” In: 11th AGILE International Conference on Geographic Information Science, AGI- LE’2008, Girona, Spain, 2008. [44] T. Leduc, E. Bocher, F. Gonzalez Cortes and G. Moreau. “GDMS: A Mixed Spatial Semantic to Enhance Urban Knowledge,” In: 1st ECN and Keio Univers COE Joint Workshop, Nantes, France, 2008. [45] A. Léobon, “La Qualification des Ambiances Sonores Urbaines”, Revue Natures - Sciences - Sociétés. Vol. III, No. 1, pp. 26-41, 1995. [46] A. Léobon, P. Woloszyn, M. Demais and E. Pasquier, A-V. Blain, “Identité Sonore et Qualité de vie en Centre Ville (Quartier Graslin, Nantes),” Rapport de Recherche SRETIE, Ministère de l’Environnement, pp. 124, 1994. [47] A. Léobon, “Analyse Sensorielle d’un Environnement Sonore Urbain,” Colloqu EAPLD, pp. 30-34, 1991. [48] A. Léobon, “Qualification et Cartographie des Ambiances Sonores du Centre Historique Nantais,” Rapport de Re- cherche Ville de Nantes, p. 186, 1995. |

