Paper Menu >>
Journal Menu >>
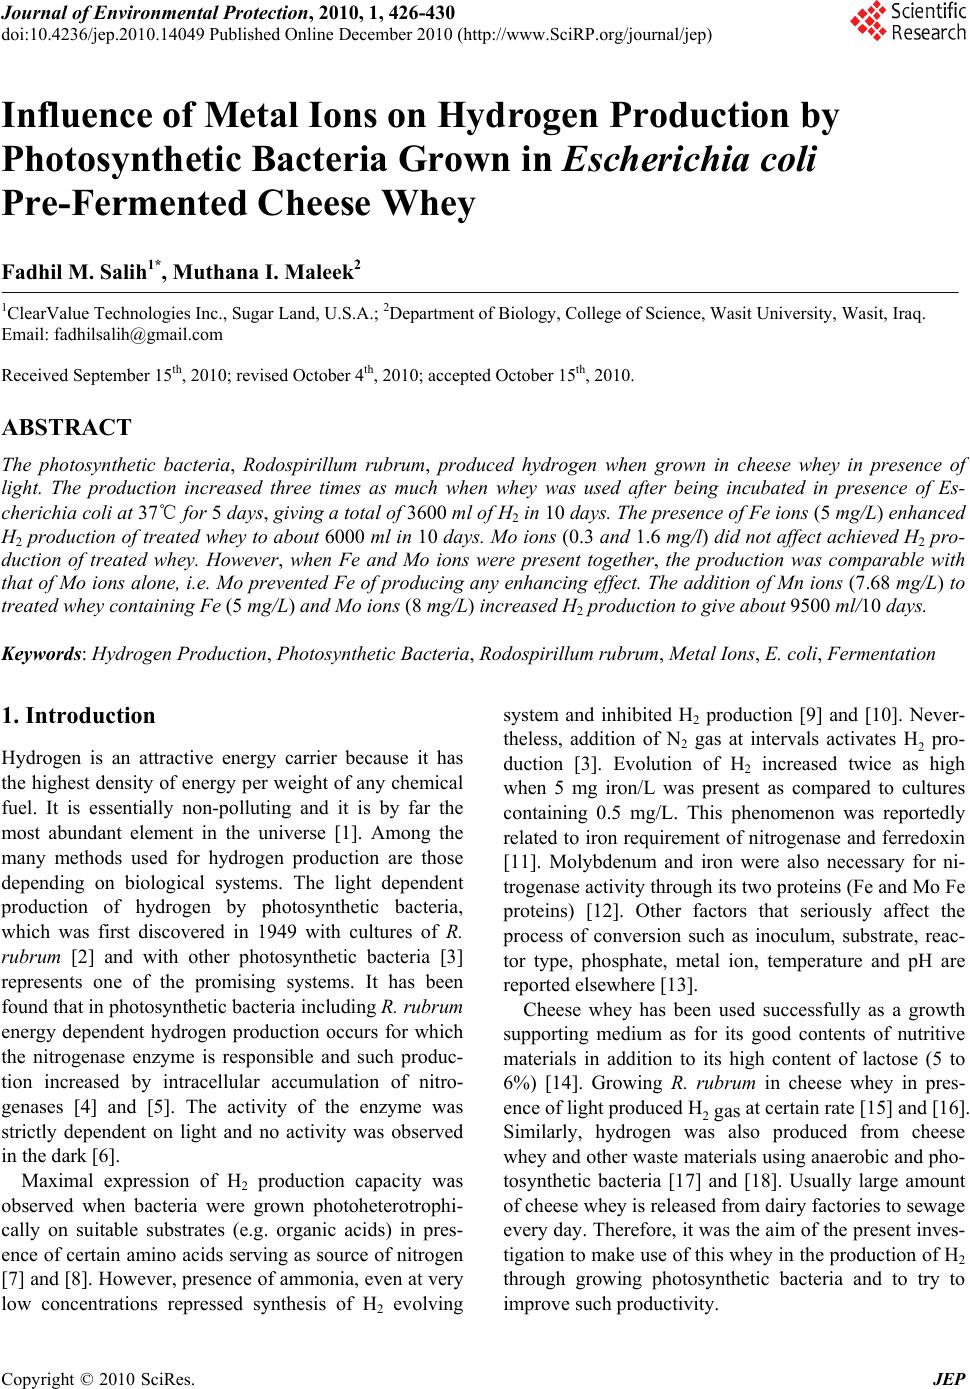 Journal of Environmental Protection, 2010, 1, 426-430 doi:10.4236/jep.2010.14049 Published Online December 2010 (http://www.SciRP.org/journal/jep) Copyright © 2010 SciRes. JEP Influence of Metal Ions on Hydrogen Production by Photosynthetic Bacteria Grown in Escherichia coli Pre-Fermented Cheese Whey Fadhil M. Salih1*, Muthana I. Maleek2 1ClearValue Technologies Inc., Sugar Land, U.S.A.; 2Department of Biology, College of Science, Wasit University, Wasit, Iraq. Email: fadhilsalih@gmail.com Received September 15th, 2010; revised October 4th, 2010; accepted October 15th, 2010. ABSTRACT The photosynthetic bacteria, Rodospirillum rubrum, produced hydrogen when grown in cheese whey in presence of light. The production increased three times as much when whey was used after being incubated in presence of Es- cherichia coli at 37℃ for 5 days, giving a total of 3600 ml of H2 in 10 days. The presence of Fe ions (5 mg/L) enhanced H2 production of treated whey to about 6000 ml in 10 days. Mo ions (0.3 and 1.6 mg/l) did not affect achieved H2 pro- duction of treated whey. However, when Fe and Mo ions were present together, the production was comparable with that of Mo ions alone, i.e. Mo prevented Fe of producing any enhancing effect. The addition of Mn ions (7.68 mg/L) to treated whey containing Fe (5 mg/L) and Mo ions (8 mg/L) increased H2 production to give about 9500 ml/10 days. Keywords: Hydrogen Production, Photosynthetic Bacteria, Rodospirillum rubrum, Metal Ions, E. coli, Fermentation 1. Introduction Hydrogen is an attractive energy carrier because it has the highest density of energy per weight of any chemical fuel. It is essentially non-polluting and it is by far the most abundant element in the universe [1]. Among the many methods used for hydrogen production are those depending on biological systems. The light dependent production of hydrogen by photosynthetic bacteria, which was first discovered in 1949 with cultures of R. rubrum [2] and with other photosynthetic bacteria [3] represents one of the promising systems. It has been found that in photosynthetic bacteria including R. rubrum energy dependent hydrogen production occurs for which the nitrogenase enzyme is responsible and such produc- tion increased by intracellular accumulation of nitro- genases [4] and [5]. The activity of the enzyme was strictly dependent on light and no activity was observed in the dark [6]. Maximal expression of H2 production capacity was observed when bacteria were grown photoheterotrophi- cally on suitable substrates (e.g. organic acids) in pres- ence of certain amino acids serving as source of nitrogen [7] and [8]. However, presence of ammonia, even at very low concentrations repressed synthesis of H2 evolving system and inhibited H2 production [9] and [10]. Never- theless, addition of N2 gas at intervals activates H2 pro- duction [3]. Evolution of H2 increased twice as high when 5 mg iron/L was present as compared to cultures containing 0.5 mg/L. This phenomenon was reportedly related to iron requirement of nitrogenase and ferredoxin [11]. Molybdenum and iron were also necessary for ni- trogenase activity through its two proteins (Fe and Mo Fe proteins) [12]. Other factors that seriously affect the process of conversion such as inoculum, substrate, reac- tor type, phosphate, metal ion, temperature and pH are reported elsewhere [13]. Cheese whey has been used successfully as a growth supporting medium as for its good contents of nutritive materials in addition to its high content of lactose (5 to 6%) [14]. Growing R. rubrum in cheese whey in pres- ence of light produced H2 gas at certain rate [15] and [16]. Similarly, hydrogen was also produced from cheese whey and other waste materials using anaerobic and pho- tosynthetic bacteria [17] and [18]. Usually large amount of cheese whey is released from dairy factories to sewage every day. Therefore, it was the aim of the present inves- tigation to make use of this whey in the production of H2 through growing photosynthetic bacteria and to try to improve such productivity. 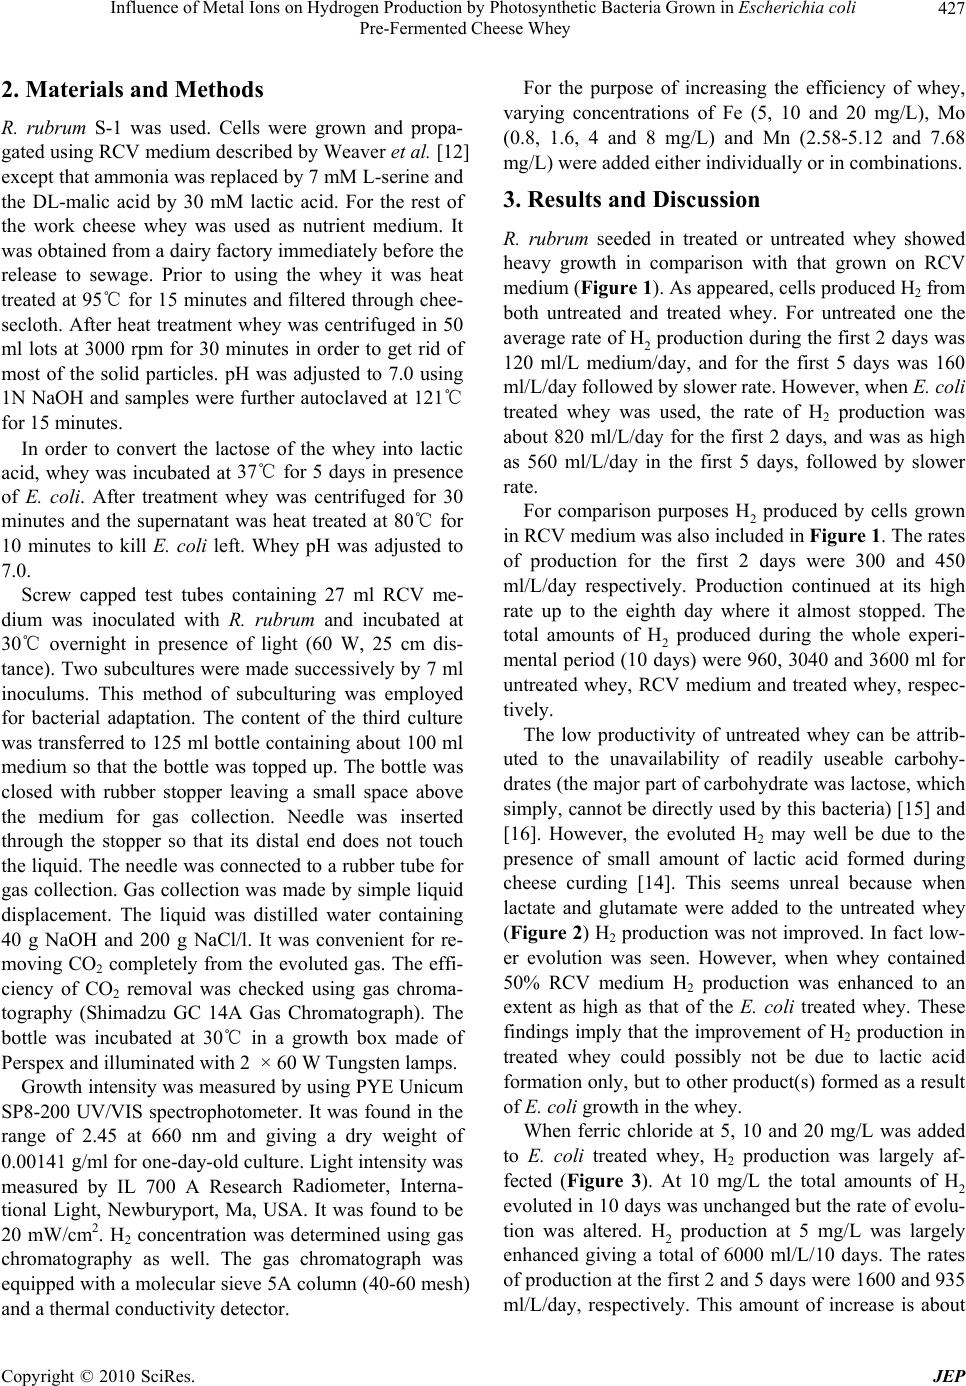 Influence of Metal Ions on Hydrogen Production by Photosynthetic Bacteria Grown in Escherichia coli Pre-Fermented Cheese Whey Copyright © 2010 SciRes. JEP 427 2. Materials and Methods R. rubrum S-1 was used. Cells were grown and propa- gated using RCV medium described by Weaver et al. [12] except that ammonia was replaced by 7 mM L-serine and the DL-malic acid by 30 mM lactic acid. For the rest of the work cheese whey was used as nutrient medium. It was obtained from a dairy factory immediately before the release to sewage. Prior to using the whey it was heat treated at 95℃ for 15 minutes and filtered through chee- secloth. After heat treatment whey was centrifuged in 50 ml lots at 3000 rpm for 30 minutes in order to get rid of most of the solid particles. pH was adjusted to 7.0 using 1N NaOH and samples were further autoclaved at 121℃ for 15 minutes. In order to convert the lactose of the whey into lactic acid, whey was incubated at 37℃ for 5 days in presence of E. coli. After treatment whey was centrifuged for 30 minutes and the supernatant was heat treated at 80℃ for 10 minutes to kill E. coli left. Whey pH was adjusted to 7.0. Screw capped test tubes containing 27 ml RCV me- dium was inoculated with R. rubrum and incubated at 30℃ overnight in presence of light (60 W, 25 cm dis- tance). Two subcultures were made successively by 7 ml inoculums. This method of subculturing was employed for bacterial adaptation. The content of the third culture was transferred to 125 ml bottle containing about 100 ml medium so that the bottle was topped up. The bottle was closed with rubber stopper leaving a small space above the medium for gas collection. Needle was inserted through the stopper so that its distal end does not touch the liquid. The needle was connected to a rubber tube for gas collection. Gas collection was made by simple liquid displacement. The liquid was distilled water containing 40 g NaOH and 200 g NaCl/l. It was convenient for re- moving CO2 completely from the evoluted gas. The effi- ciency of CO2 removal was checked using gas chroma- tography (Shimadzu GC 14A Gas Chromatograph). The bottle was incubated at 30℃ in a growth box made of Perspex and illuminated with 2 × 60 W Tungsten lamps. Growth intensity was measured by using PYE Unicum SP8-200 UV/VIS spectrophotometer. It was found in the range of 2.45 at 660 nm and giving a dry weight of 0.00141 g/ml for one-day-old culture. Light intensity was measured by IL 700 A Research Radiometer, Interna- tional Light, Newburyport, Ma, USA. It was found to be 20 mW/cm2. H2 concentration was determined using gas chromatography as well. The gas chromatograph was equipped with a molecular sieve 5A column (40-60 mesh) and a thermal conductivity detector. For the purpose of increasing the efficiency of whey, varying concentrations of Fe (5, 10 and 20 mg/L), Mo (0.8, 1.6, 4 and 8 mg/L) and Mn (2.58-5.12 and 7.68 mg/L) were added either individually or in combinations. 3. Results and Discussion R. rubrum seeded in treated or untreated whey showed heavy growth in comparison with that grown on RCV medium (Figure 1). As appeared, cells produced H2 from both untreated and treated whey. For untreated one the average rate of H2 production during the first 2 days was 120 ml/L medium/day, and for the first 5 days was 160 ml/L/day followed by slower rate. However, when E. coli treated whey was used, the rate of H2 production was about 820 ml/L/day for the first 2 days, and was as high as 560 ml/L/day in the first 5 days, followed by slower rate. For comparison purposes H2 produced by cells grown in RCV medium was also included in Figure 1. The rates of production for the first 2 days were 300 and 450 ml/L/day respectively. Production continued at its high rate up to the eighth day where it almost stopped. The total amounts of H2 produced during the whole experi- mental period (10 days) were 960, 3040 and 3600 ml for untreated whey, RCV medium and treated whey, respec- tively. The low productivity of untreated whey can be attrib- uted to the unavailability of readily useable carbohy- drates (the major part of carbohydrate was lactose, which simply, cannot be directly used by this bacteria) [15] and [16]. However, the evoluted H2 may well be due to the presence of small amount of lactic acid formed during cheese curding [14]. This seems unreal because when lactate and glutamate were added to the untreated whey (Figure 2) H2 production was not improved. In fact low- er evolution was seen. However, when whey contained 50% RCV medium H2 production was enhanced to an extent as high as that of the E. coli treated whey. These findings imply that the improvement of H2 production in treated whey could possibly not be due to lactic acid formation only, but to other product(s) formed as a result of E. coli growth in the whey. When ferric chloride at 5, 10 and 20 mg/L was added to E. coli treated whey, H2 production was largely af- fected (Figure 3). At 10 mg/L the total amounts of H2 evoluted in 10 days was unchanged but the rate of evolu- tion was altered. H2 production at 5 mg/L was largely enhanced giving a total of 6000 ml/L/10 days. The rates of production at the first 2 and 5 days were 1600 and 935 ml/L/day, respectively. This amount of increase is about 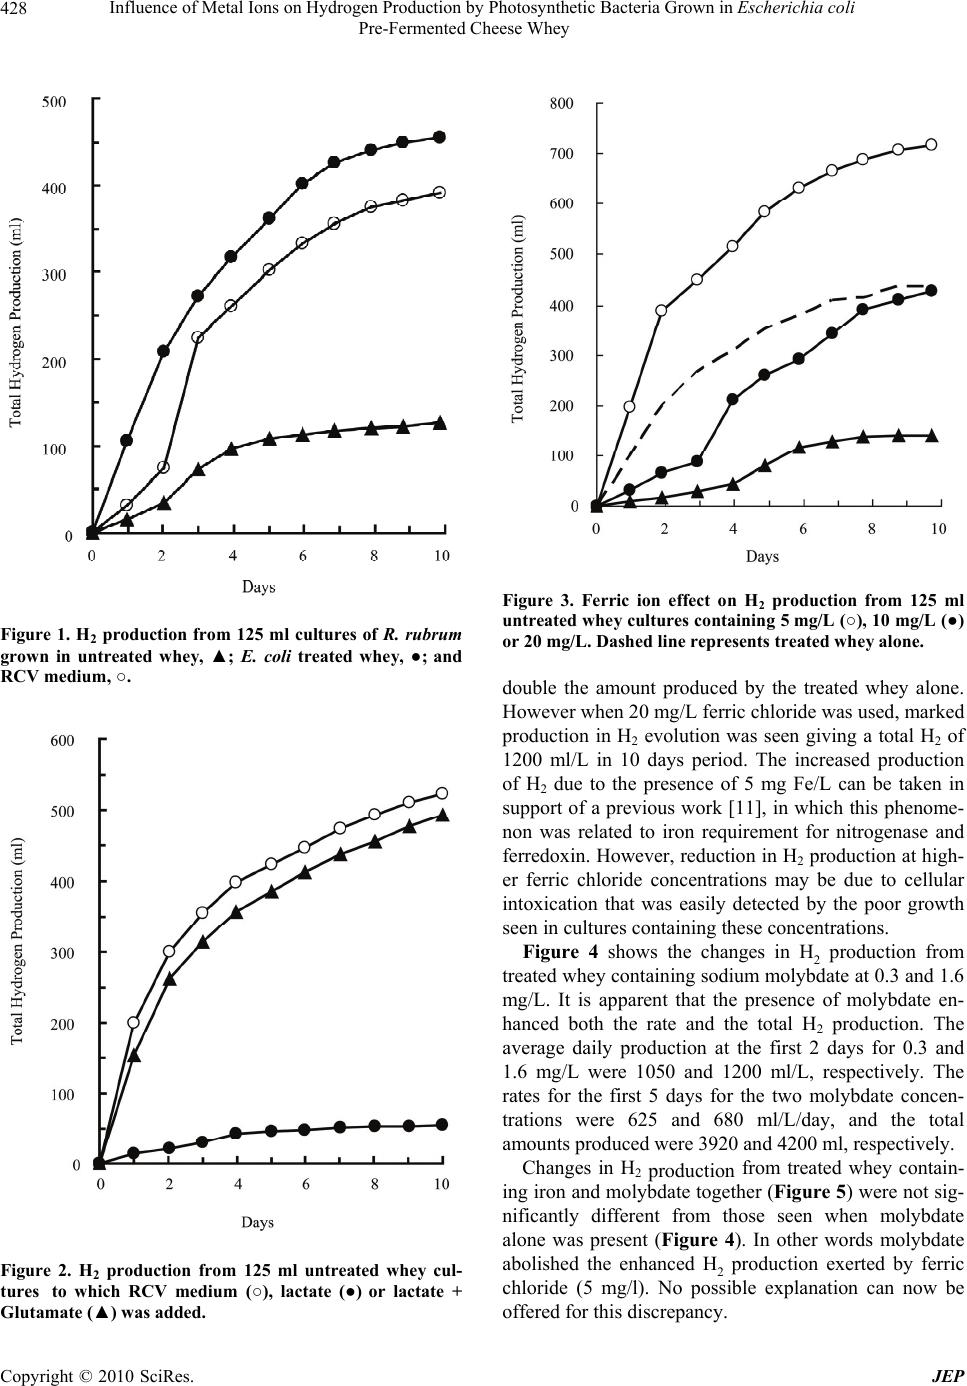 Influence of Metal Ions on Hydrogen Production by Photosynthetic Bacteria Grown in Escherichia coli Pre-Fermented Cheese Whey Copyright © 2010 SciRes. JEP 428 Figure 1. H2 production from 125 ml cultures of R. rubrum grown in untreated whey, ▲; E. coli treated whey, ●; and RCV medium, ○. Figure 2. H2 production from 125 ml untreated whey cul- tures to which RCV medium (○), lactate (●) or lactate + Glutamate (▲) was added. Figure 3. Ferric ion effect on H2 production from 125 ml untreated whey cultures containing 5 mg/L (○), 10 mg/L (●) or 20 mg/L. Dashed line represents treated whey alone. double the amount produced by the treated whey alone. However when 20 mg/L ferric chloride was used, marked production in H2 evolution was seen giving a total H2 of 1200 ml/L in 10 days period. The increased production of H2 due to the presence of 5 mg Fe/L can be taken in support of a previous work [11], in which this phenome- non was related to iron requirement for nitrogenase and ferredoxin. However, reduction in H2 production at high- er ferric chloride concentrations may be due to cellular intoxication that was easily detected by the poor growth seen in cultures containing these concentrations. Figure 4 shows the changes in H2 production from treated whey containing sodium molybdate at 0.3 and 1.6 mg/L. It is apparent that the presence of molybdate en- hanced both the rate and the total H2 production. The average daily production at the first 2 days for 0.3 and 1.6 mg/L were 1050 and 1200 ml/L, respectively. The rates for the first 5 days for the two molybdate concen- trations were 625 and 680 ml/L/day, and the total amounts produced were 3920 and 4200 ml, respectively. Changes in H2 production from treated whey contain- ing iron and molybdate together (Figure 5) were not sig- nificantly different from those seen when molybdate alone was present (Figure 4). In other words molybdate abolished the enhanced H2 production exerted by ferric chloride (5 mg/l). No possible explanation can now be offered for this discrepancy. 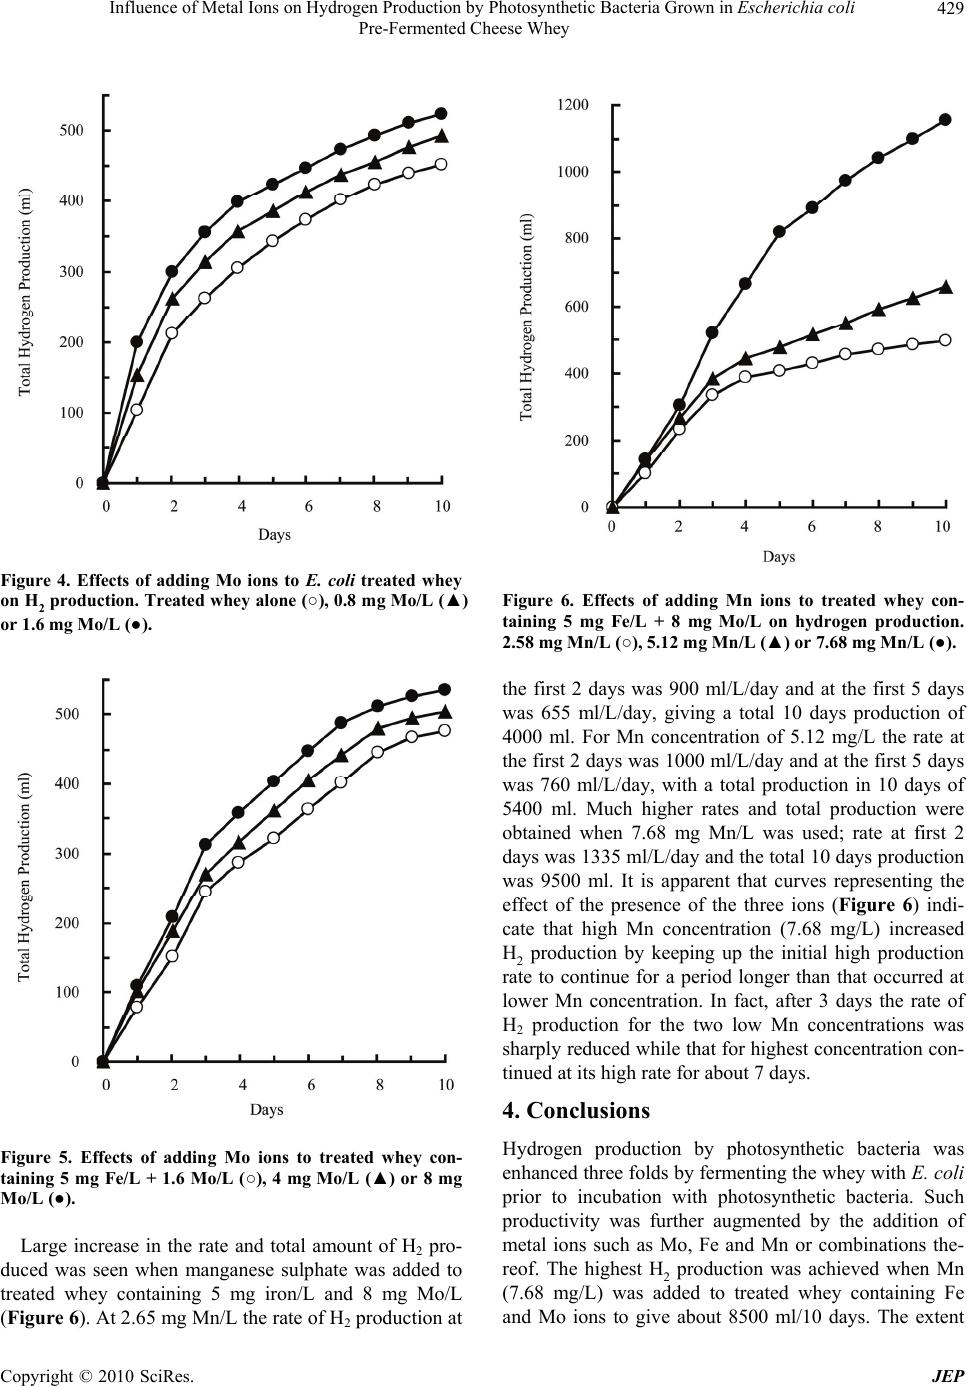 Influence of Metal Ions on Hydrogen Production by Photosynthetic Bacteria Grown in Escherichia coli Pre-Fermented Cheese Whey Copyright © 2010 SciRes. JEP 429 Figure 4. Effects of adding Mo ions to E. coli treated whey on H2 production. Treated whey alone (○), 0.8 mg Mo/L (▲) or 1.6 mg Mo/L (●). Figure 5. Effects of adding Mo ions to treated whey con- taining 5 mg Fe/L + 1.6 Mo/L (○), 4 mg Mo/L (▲) or 8 mg Mo/L (●). Large increase in the rate and total amount of H2 pro- duced was seen when manganese sulphate was added to treated whey containing 5 mg iron/L and 8 mg Mo/L (Figure 6). At 2.65 mg Mn/L the rate of H2 production at Figure 6. Effects of adding Mn ions to treated whey con- taining 5 mg Fe/L + 8 mg Mo/L on hydrogen production. 2.58 mg Mn/L (○), 5.12 mg Mn/L (▲) or 7.68 mg Mn/L (●). the first 2 days was 900 ml/L/day and at the first 5 days was 655 ml/L/day, giving a total 10 days production of 4000 ml. For Mn concentration of 5.12 mg/L the rate at the first 2 days was 1000 ml/L/day and at the first 5 days was 760 ml/L/day, with a total production in 10 days of 5400 ml. Much higher rates and total production were obtained when 7.68 mg Mn/L was used; rate at first 2 days was 1335 ml/L/day and the total 10 days production was 9500 ml. It is apparent that curves representing the effect of the presence of the three ions (Figure 6) indi- cate that high Mn concentration (7.68 mg/L) increased H2 production by keeping up the initial high production rate to continue for a period longer than that occurred at lower Mn concentration. In fact, after 3 days the rate of H2 production for the two low Mn concentrations was sharply reduced while that for highest concentration con- tinued at its high rate for about 7 days. 4. Conclusions Hydrogen production by photosynthetic bacteria was enhanced three folds by fermenting the whey with E. coli prior to incubation with photosynthetic bacteria. Such productivity was further augmented by the addition of metal ions such as Mo, Fe and Mn or combinations the- reof. The highest H2 production was achieved when Mn (7.68 mg/L) was added to treated whey containing Fe and Mo ions to give about 8500 ml/10 days. The extent  Influence of Metal Ions on Hydrogen Production by Photosynthetic Bacteria Grown in Escherichia coli Pre-Fermented Cheese Whey Copyright © 2010 SciRes. JEP 430 of H2 productivity was metal ions concentration depend- ent. REFERENCES [1] A. Margaritis and J. Vogrinetz, “The Effect of Glucose Concentration and pH on Hydrogen Production by Rho- dopseudomonas Spheroids VM 81,” International Jour- nal of Hydrogen Energy, Vol. 8, No. 4, 1983, pp. 281- -284. [2] H. Gest and M. D. Kamen, “Photoproduction of Molecu- lar Hydrogen by Rhodospirillum Rubrum,” Science, Vol. 109, No. 2840, 1949, pp. 558-559. [3] L. Segers and W. Verstraete, “Conversion of Organic Acids to H2 by Rhodospirillaceae Grown with Glutamate or Dinitrogen as Nitrogen Source,” Biotechnology and Bioengineering, Vol. 25, No. 12, 1983, pp. 2843-2853. [4] M. D. Kamen and H. Gest, “Evidence for a Nitroginase System in the Photosynthetic Bacterium Rhodospirillum rubrum,” Science, Vol. 109, No. 2840, 1949, p. 560. [5] W. G. Zumft and D. J. Arp, “Increased Photo-Production of Hydrogen by Intracellular Accumulation of Nitro- genase in Phototrophic Bacteria,” Naturwissenschaften, Vol. 68, No. 8, 1981, pp. 424-425. [6] J. Meyer, B. C. Kelley and P. M. Vignais, “Effect of Light on Nitrogenase Function and Synthesis in Rhodop- seudomonas Capsulata,” Journal of Bacteriology, Vol. 136, No. 1, 1978, pp. 201-208. [7] P. Hillmer and H. Gest, “H2 Metabolism in the Photosyn- thetic Bacterium Rhodopseudomonas Capsulata: H2 Production by Growing Cultures,” Journal of Bacteriol- ogy, Vol. 129, 1977, pp. 724-731. [8] P. Stevens, C. Vertonghen, P. de Vos and J. de Ley, “The Effect of Temperature and Light Intensity on Hydrogen Production by Different Rhodopseudomonas Capsulata strains,” Biotechnology Letters, Vol. 6, No. 5, 1984, pp. 277-282. [9] J. G. Ormerod, K. S. Ormerod and H. Gest, “Light De- pendent Utilization of Organic Compounds and Photo- production of Molecular Hydrogen by Photosynthetic Bacteria: Relationship with Nitrogen Metabolism,” Ar- chive of Biochemistry and Biophysics, Vol. 94, 1961, pp. 449-463. [10] Y. Jouanneau, S. Lebecque and P. M. Vignais, “Ammo- nia and Light Effect on Nitrogenase Activity in Nitrogen Limited Continuous Cultures of Rhodopseudomonas Cap- sulata. Role of Glutamine Synthease,” Archive of Micro- biology, Vol. 139, 1984, pp. 326-331. [11] T. W. Jaffries, H. Timourian and R. L. Ward, “Hydrogen Production by Anabaena cylindrica: Effects of Varying Ammonium and Ferric Ions, pH, and Light,” Applied and Environmental Microbiology, Vol. 35, No. 4, 1978, pp. 704-710. [12] P. F. Weaver, S. Lien and M. Seibert, “Photobiological Production of Hydrogen,” Solar Energy, Vol. 24, No. 4, 1980, pp. 3-45. [13] J. Wang, and W. Wan, “Factors Influencing Fermentative Hydrogen Production: A Review,” International Journal of Hydrogen Energy, Vol. 34, No. 2, 2009, pp. 799-811. [14] M. Frobisher, R. D. Hinsdill, K. T. Crabtree and C. R. Goodheart, “Fundamentals of Microbiology,” W. B. Sau- nders Co., U.S.A., 1974. [15] H. Zurrer and R. Bachofen, “Hydrogen Production by the Photosynthetic Bacterium Rhodospirillum Rubrum,” Ap- plied and Environmental Microbiology, Vol. 37, No. 5, 1979, pp. 789-793. [16] F. M. Salih, “Improvement of Hydrogen Photoproduction from E. coli Pre-Treated Cheese Whey,” International Jo- urnal of Hydrogen Energy, Vol. 14, No. 9, 1989, pp. 661- 663. [17] I. K. Kapdan and F. Kargi, “Bio-Hydrogen Production from Waste Materials,” Enzyme Microbial Technology, Vol. 38, No. 5, 2006, pp. 569-582. [18] M. Yetisa, U. Gündüza, I. Eroglub, M. Yücela and L. Türkerc, “Photoproduction of Hydrogen from Sugar Re- finery Wastewater by Rhodobacter Sphaeroides O.U. 001,” International Journal of Hydrogen Energy, Vol. 25, No. 11, 2000, pp. 1035-1041. |