 J. Service Science & Management, 2010, 3, 390-407 doi: 10.4236/jssm.2010.34046 Published Online December 2010 (http://www.SciRP.org/journal/jssm) Copyright © 2010 SciRes. JSSM Off-Line and User-Oriented Approach for Supplier Selection in Dynamic Environment: A Case Study in the Healthcare Services* Shalom Moalem1, Avi Herbon1,2, Haim Shnaiderman1, Joseph Templeman3 1Department of Management, Bar-Ilan University, Ramat-Gan, Israel; 2Department of Management and Industrial Engineering, Ariel University Center of Samaria, Ariel, Israel; 3Joseph Templeman, The College of Business Administration, Rishon LiTzion, Israel. Email: Email: avher@bezeqint.net Received August 19th, 2010; revised October 4th, 2010; accepted November 10th, 2010. ABSTRACT Evaluating and selecting supplies are critical activities in the process of purchasing and supplying materials. Many manufacturing and service organiza tions operate in a con stantly changing business environmen t and occasionally have to reconsider their steps in terms o f supplier selection. This paper offers a methodology that takes into accoun t the im- pact of a dynamic business environment on the supplier selection process. This methodology represents an applicable tool supported by decision for the planned selection of a single supplier that changes with time out of a supplier group over a finite planning ho rizon. The suggested methodology has been tested in a large Israeli organization-Clalit Health Services, which comprises large-scale logistical entity working with hundreds of suppliers on an ongoing basis. Our analysis of application results shows that the suggested strategy of switching suppliers over a predefined planning ho- rizon according to the business environment forecast is over 10% more efficient compared to a strategy that does not change the leading supplier throughout the planning horizon. This average improvement is translated into expected efficiency gains on most operative dimensions which represent selection parameters, such as cost per unit, supply lead-time, reputation and more. Nevertheless, some of their value is lost due to some dimensions. Keywords: Supplier Selection, Dyn amic Environment, Case Study, Healthcare Services 1. Introduction 1.1. Supplier Selection Manufacturing and service organizations contract with external suppliers for the products or services which they market. These may be raw material, finished products or service suppliers. Selecting the right supplier is a com- plex decision made by companies and organizations, with potentially significant impact on the organization’s ongoing performance. Many studies [1,2] have indicated that finding the right suppliers is essential for business organizations and crucial to their success. It affects criti- cal areas along the organization’s supply chain, such as production, transportation, inventory, and quality. By selecting the right suppliers, the organization can gain in efficiency and enhance supply chain cost-effectiveness. On the other hand, failing to select the right suppliers could compromise the organization in economic/financial terms or in terms of service quality and reputation. A key tool in supplier selection is supplier ranking, which is a central aspect of the quality management field, and is attracting growing attention nowadays [3]. One of the key characteristics of the business envi- ronment in which most organizations currently operate is its dynamics. These dynamics are a significant and deci- sive aspect of business environmental uncertainty [4,5]. Environmental dynamics are governed by several factors, including consumer behavior, and predictable or unpre- dictable events in the local or global business environ- ment. Today’s customers are typically more sensitive to quality, more exposed to competition and hence more demanding in terms of requiring higher quality standards and better value for money. The intense competition en- ables them to demand quicker and more customized re- sponse, which directly impacts the dynamics of the busi- ness environment. Another important factor is the rapid advances in information technology which allow for cost reduction, shorter supply times, informational reliability and accelerated manufacturing and procurement proc- esses, along with more streamlined integration of opera-  Off-Line and User-Oriented Approach for Supplier Selection in Dynamic Environment: 391 A Case Study in the Healthcare Services tional processes with marketing and customer service approaches. Financial parameters also affect the dynamics of the business environments. For example, in a dynamic busi- ness environment manufacturing or service organizations contract with suppliers from many different countries, contracts affected by exchange rate fluctuations. Another important financial factor is changes in interest rates, which may affect inventory maintenance costs. These changes often affect supplier selection considerations, since the cost of products or services provided by the supplier is related to the interest rate. 1.2. Review of Supplier Selection Methods The supplier selection technique literature is extensive, including numerous studies beginning in the 1960’s [6] for a comprehensive review of early works. These tech- niques include using satisfaction level categories to rank suppliers, relying mainly on the experience and skills of the procurement manager charged with selecting a sup- plier [7]. Other techniques discussed in the literature are elimination [8], which specifies minimal standard scores for each supplier selection criterion, as well as various models of linear combinations of criteria weights used to evaluate suppliers [9-11]. Common selection criteria are price, quality and due-dates. The criteria specified by Dickson [11] remain relevant to this day, although their relative importance has changed. Another technique re- lies on converting selection criteria to cost units based on a pricing of various activities, to produce a single, total cost [12]. Finally, the AHP (analytic hierarchy process) technique enables decision makers to use comparative quality assessments instead of qualitative indicators ba- sed on precise weight calculations [13]. The literature also offers many mathematical pro- gramming models, including linear programming [14], MIP (mixed integer programming) [15], non-linear pro- gramming [16], MOP (multi-objective programming) [17], and AHP models [18]. Probabilistic and statistical models are also common. Soukup [19] suggests a supplier selection methodology requiring the decision maker to estimate the probability of obtaining future supplier performance evaluation giv- en certain scenarios. Liao and Rittscher [20] suggest a genetic model designed to enhance supplier flexibility in the supplier selection process given normally distributed random demand and capacity constraints with the ac- ceptable assumption that such enhancement would con- tribute to greater flexibility throughout the supply chain. In a case study of replacing the bus fleet of a large or- ganization, Keles and Hartman [21] used an MIP model and sensitivity analysis to obtain an optimal solution for dynamic business environment changes. The objective of this study was to determine optimal long-term timetables for replacing the old bus fleet, with several manufactur- ers submitting proposals. To conclude, note that as already mentioned the lit- erature lacks direct reference to the dynamic nature of the business environment as a key characteristic informing the supplier selection process. 1.3. The Need for a New Supplier Selection Me- thodology: The Clalit Case Supplier selection is directly affected by factors related to the suppliers and to the nature of supply. According to our approach, supplier selection should also be affected by multiple exogenous factors such as demand and sup- ply, which characterize a dynamic business environment. Dynamic change in parameter values characterizing the business environment represents a change in environ- mental conditions which could make decision makers consider replacing the present supplier or selecting fur- ther suppliers. For example, a supplier deemed irrelevant in the past could become relevant due to the falling ex- change rate of a certain currency and the resulting re- duced procurement cost. Despite the critical importance of the supplier selection process, however, there are still many organizations which do not conduct structured supplier selection processes. Many organizations rely exclusively on economic parameters when selecting their suppliers. The bulk of studies on supplier selection do not enable corporate decision makers to practically deal with chan- ges resulting from the dynamic nature of the business environment, changes that often require rapid response. At the same time, many organizations in Israel and abroad operate under conditions of a constantly changing business environment which requires them to reconsider their decisions at a much higher rate than in the past. The present study presents a supplier selection meth- odology applied in retrospect to data provided by a large Israeli HMO-Clalit Health Services (CHS). This organi- zation comprises Supply and Procurement Administra- tions which are among the largest in the Israeli economy, serving some 60% of the Israeli population. As these work with hundreds of suppliers on an ongoing basis, making an efficient supplier selection process is highly important to them. In view of the common approaches to this problem which lacked sufficient reference to envi- ronmental dynamics, however, CHS has clung to less- than-optimal suppliers without any practical option of replacing them, or with the ability to replace them only by incurring a high financial penalty. The CHS supply and Procurement Administrations Copyright © 2010 SciRes. JSSM  Off-Line and User-Oriented Approach for Supplier Selection in Dynamic Environment: 392 A Case Study in the Healthcare Services S E purchase medicines and medical hardware and distributes them to customers. The Supply Administration works with some 350 suppliers, with about 2,000 supply points, and with more than 5 million units of 5,000 items pro- vided annually, for a total value of around 3.1 billion NIS ($840 m in current values). The specific product selected for applying the sug- gested methodology is latex gloves. Latex is a milky flu- id derived from the rubber tree and processed to its fin- ished form. This product is in high demand among CHS customers. Its price is affected by environmental factors such as sharp raw material cost fluctuations, and strug- gles over controlling the processing industry. Any short- age of latex glove supply could mean immediate sus- pendsion of all medical activities in operating rooms and laboratories. At the same time, unexpected environ- mental changes could significantly affect CHS’s posi- tioning vis-à-vis latex suppliers. For example, due to environmental changes-mainly reduced raw material supply - during 2004-2007, raw material costs have sky- rocketed, and due to CHS’s long-term contractual com- mitment to the supplier of this market-dependent item, it had to pay premium prices. This meant that further busi- ness relations with that supplier were no longer worth- while, and that a new supplier needed to be found, which could better meet the environmental changes. However, lack of preparation to the predictable rise in the item’s price made it difficult for CHS to immediately replace the supplier, leading to high expenses and a lower service level. We suggest that such environmental dynamics should be factored into the organization’s decision mak- ing already at the supplier selection stage. 1.4. Study Framework The present study discusses a representative supplier selection case as a model for large organizations con- tracting with a wide variety of suppliers and operating in a dynamic business environment. Our objective is to ap- ply a methodology for selecting a single supplier at any point in time over a given planning horizon under dy- namic environmental conditions, while enhancing man- agement indicators commonly used in supplier selection. As presented below, supplier selection is the responsibil- ity of a single decision maker or a single representative of a team of decision makers in a manufacturing or ser- vice organization interested in selecting a proposal by a single supplier among a large number of concurrent pro- posals, . The selection process will be based on several evaluation criteria, used by the decision maker to subjectively evaluate each proposal. The dy- namic business environment is represented by several quantitative (environmental) parameters,, whose value could change with time. 1, 2, ,,i 1, 2,j Part 2 describes CHS and its present supplier selection procedure. Part 3 details the methodology for construct- ing dynamic weights as a key element in the supplier selection process. In Part 4 we present the results of our case study application. Finally, our findings are discussed in Part 5. 2. Supplier Selection at Clalit Health Services 2.1. Background Clalit Health Services (CHS) is the largest HMO in Israel, providing medical services to over 3.7 million customers through more than 1,200 clinics, 14 hospitals, some 400 pharmacies, and hundreds of institutes and labs. Its pro- fessional staff includes thousands of physicians, nurses, pharmacists, and paramedics. The present study focuses on CHS’s Supply and Pro- curement Administrations. The Supply Administration is a key element in the organization’s logistical function, as it is in charge of inventory management and supplying medical institutes. The Procurement Administration’s main responsibilities include initiating and managing procurement contracts, constructing infrastructures and developing management and control systems based on market surveys, selecting potential sources and suppliers, creating competition and taking advantage of inherent economies of size. The fundamental concept of CHS’s procurement processes is to secure a high-quality accu- rate procurement channel at minimal cost and maximal flexibility. The Procurement Administration follows sev- eral guidelines, including compliance with medicine prescription authorization requirements, meeting the re- quirements of professional committees, meeting standard safety requirements, reliability and first-rate financial terms. Once potential sources and suppliers are identified, the administration is required to specify the contractual relationship with them. The tender technique is applied based on CHS’s obligatory tender procedure, according to which a dedicated tender committee evaluates the var- ious suppliers in a tender procedure for procuring the hardware in question. Committee members include a comptroller representative, a member of the public, a buyer, a financial executive, an economist and the head of the relevant department. The specific product referred to in this case study is latex gloves (see Figure 1). Latex is a milky fluid de- rived from certain plants and processed using various methods to its finished form. The most important latex ingredient is produced from the Hevea brasiliensis tree, also called “gum tree” (see Figure 2). Many products Copyright © 2010 SciRes. JSSM  Off-Line and User-Oriented Approach for Supplier Selection in Dynamic Environment: 393 A Case Study in the Healthcare Services used in medicine and science, as well as every- day life, are made of or contain latex. Apart from gloves, they include ventilation masks, operating room equip- ment, dental medicine equipment, balloons, toys, balls and condoms. Latex gloves are in high demand among CHS custom- ers. Their price is influenced by environmental factors such as raw material cost fluctuations and struggles for control of the processing industry. Glove shortage could mean suspension of operating room and laboratory ac- tivities. In 2002, a supply contract was signed with one of this product’s suppliers based on contemporary de- mand and consumption forecasts. The contract period was five years, without an option for reevaluation based, among other things, on changes in the business environ- ment. The following years saw regulatory changes in the producing countries, such that some of them banned all latex exports to the west. These environmental changes meant lower raw material supply and made continuous production of latex gloves more difficult, leading to sky- rocketing costs. The international market price of 100g of latex was $0.91 in early 2004, rising to $1.4 in early 2007. Following these changes, the glove supplier de- cided to raise the unit price during the contract period, without any negotiation with CHS representatives, taking advantage of the rigid contract. It was such extreme environmental fluctuations, par- ticularly those which lead to the unilateral steps taken by the supplier of this product, which motivated our choice of latex gloves to demonstrate the application of our proposed methodology. When examining the decision making process leading to this supplier’s selection in late Figure 1. Latex gloves. Figure 2. Latex ra w material. 2002, we will also look into the option of changing sup- pliers in the future based on forecasts of predictable en- vironmental changes. 2.2. Supplier Proposals In 2002, the CHS Procurement Administration began a process of selecting latex glove suppliers. The product is particularly in demand in the medical community, with monthly consumption of some 1m units. An RFP was sent to four suppliers (S = 4), designated hereafter as S1, S2, S3 and S4. The price offers were requested per a 100 glove unit. The suppliers were also requested to meet various selection parameters according to CHS require- ments, based on Procurement Administration policy. These commonly used criteria included cost, quality, supply rate and flexibility [22]. In turn, the suppliers’ proposals were translated to selection parameter values. Appendix 1 presents these selection parameters and their values, based on the suppliers’ proposals. The Rep- utation parameter refers to historical supplier perform- ance data. In the absence of such data, the supplier in question will be evaluated without any consideration of this parameter. The Credit Rating parameter refers to the supplier’s economic strength and financial stability, and is measured using a 1-5 Likert scale based on financial data required of the supplier. Geographic Location refers to the distance, in kilometers, between the suppliers’ and the customers’ warehouses. Finally, the Payment Dead- line refers to the latest date following the end of a current work month in which the supplier demands a financial return for the supplies delivered during that month. After specifying the customer’s requirements, the sup- pliers’ proposals were translated into measurable data by composing a supply criteria list, , (Set 1), in which each criterion is made up of several relevant parameter indicators, ,. The supplier criteria list was specified in a similar way , and designated Set 2, with each criterion made up of relevant parameters, , . S2 proposed a discount (for the whole amount), based on the number of units purchased in each order, as illustrated in Table 1 below. 1 1 1, 2,kQ 11 ,kn 1, 2 p 1 1 k q 1 11 k nP 22 ,kn 1 p 2 2 k q 2 2 1, 2,k 2 22 1, 2k nP Q 2 Table 1. S2 Unit cost based on order size. Order Size Cost per 100 Units (NIS) 100,000 -3,000,000 18 3,000,001 -9,000,000 15 9,000,001 -15,000,000 12 Copyright © 2010 SciRes. JSSM  Off-Line and User-Oriented Approach for Supplier Selection in Dynamic Environment: 394 A Case Study in the Healthcare Services 2.3. Supplier Proposals After receiving the supplier proposals and converting them into selection parameter values, CHS procurement executives had to select the supplier. The selection proc- ess included several stages. At first, each set of criteria received a relative weighting based on the decision mak- ers’ subjective preferences and as suggested by several studies [3]. A weight of 0.4 was given to the Supply cri- teria set, and a 0.6 weight was given to the Supplier cri- teria set. Following that, a relative weight was given to each specific criterion based on the decision makers’ perspective and their experience. Next, the decision makers were required to weigh the parameters relevant to supplier selection, based on their criterion weighting. Appendix 3 presents the weights as determined by CHS. The selection parameter weights were determined in several phases. First, three importance levels were speci- fied: high, medium and low. The weights were then de- termined based on the importance levels and the level of score variance in the various proposals per each selection parameter. For example, high importance combined with high variance in the supplier standard scores for the same parameter meant a high weight, while high importance combined with low variance meant a medium weight. Similarly, low importance combined with high variance meant a medium weight, while low importance combined with low variance meant a low weight. Whenever a cer- tain criterion was represented by a single selection pa- rameter, this parameter received the full weight of the criterion it represented. The decision makers were then required to rate the various suppliers on each selection parameter. This rating was based on a specification of score scales for each pa- rameter, , g g kn p ,, defined by a lower and upper boundary for each selection parameter, and ,, respectively. The various scale ratings were determined by using two approaches based on parameter type. One was the 1-5 Likert scale (1 representing the lowest value), and the other was binary. A rating per each parameter, , 1, 2g , gg g kn Lp gg g kn Up g g kn d,, in each of the criteria group was computed using a transformation function substituting the selection parameter raw value 1, 2g , g g kn p g by the rating value , such that , gg gg kn kn dTransp, g ,, gg gg gg kn kn dLp , ,gg g kn Up . Appendix 2 presents the value transformation of all selection parameters , g g kn p into the rating scores , g g kn d. For each supplier pro- posal , the raw score 1, 2,3, 4i, g g kn d was transformed into a standard score , g g xkn using a uniform 0-100 scale for each criteria set g = 1,2, with 100 being the highest value for each parameter. Supplier proposal standard score sums for all selection parameters based on the Likert scaling approach following the transformation are presented in Appendix 1. The binary approach was used to evaluate one re- maining parameter: Quantity Discount. If the supplier offers such discount, he will receive the optimal 100 score. If not, the score will be 0. Table 2 presents sup- plier data for this parameter. Since S2 had no historical data that could be used to specify the Reputation parameter, he received a 59.78 score on this parameter, equal to the proportional weighted average score of all the other selection parameters. After specifying the weights for each parameter and determining the standard scores for supplier proposal, all that remained was to calculate the total weighted score for each supplier proposal. This was done by multiplying the relevant weight by the score, as suggested by the lit- erature surveyed above and as prevalent in practice. The total score ifor each i supplier proposal, X1, 2,3, 4i , was given by the following: 11 22 ii kn kn px 1 1 1 1 1 11 2 2 2 22 22 11 ,, 11 22 ,, 11 , 1,2,3,4 k k P Q kn kn P Q ikn kn Xpxp p i (1) such that , gg g kn p is the weight of each parameter , g g kn p, and , g g kn x is the standard score, 1, 2 g k nP 1, 2g . Using this formula for the various suppliers produced the following final scores: 162,S2 59.78,S 366, 469SS . On the basis of these scores S4 was selected for the 2003-2007 contract. 3. Constructing Dynamic Selection Weights 3.1. Proposed Methodology Principles As already mentioned, one of the key characteristics of modern business environments is their dynamics. Supplier selection must take this factor into account. Below, we propose a retrospective qualitative and quantitative de- scription of environmental influences on supplier se lec- tion considerations. No less important, we propose how to present them visually to the decision makers, so as to en- able them to actually “see” the selected supplier, as well as predictable changes in the business environment. First, the proposed methodology focuses on selecting a supplier under initial environmental conditions, as de- cribed in Part 2, on the basis of characterizing customer s Copyright © 2010 SciRes. JSSM  Off-Line and User-Oriented Approach for Supplier Selection in Dynamic Environment: A Case Study in the Healthcare Services Copyright © 2010 SciRes. JSSM 395 Table 2. Standard scores for the quantity discount parameter 2 3,1 p. Supplier S1 S2 S3 S4 Standard score 0 100 0 0 Selection parameter quantity discount 2 3,1 Supplier proposal None V None None requirements, specifying selection criteria, subjectively weighting them in a way that reflects the decision mak- ers’ preferences and finally, scoring these criteria. We then present a supplier selection process based on selec- tion criteria under dynamic environmental conditions. The selection criteria specified (see Appendix 1) are based on the supplier selection literature, mainly Dickson [11]. Using these selection parameters, we can analyze the supplier selection process in the organization studied, as it is affected by its dynamic business environment. In general, the selection criteria would be quantitative, but they may also be qualitative as long as measurable selec- tion parameters could be tailored for them. 3.2. Dynamic Weight Functions As already described, following environmental changes – specifically, rising raw material prices-CHS’s latex glove supplier raised its price subject to the contract. Following that move, CHS found itself tied to a less-than-optimal supplier, and in retrospect, realized that it should have been able to select a new supplier able to meet such price fluctuations. Following the changes in the business envi- ronment, the original weights and scores given to the four latex glove suppliers were no longer appropriate. The decision assessed in retrospect in this case study refers to the following question: what is the future date in which it would no longer be worthwhile to continue working with the present supplier? In order to specify a dynamic environment that would expand the scope of supplier selection beyond the rise in raw material prices to factor in additional environmental influences, we have identified relevant dynamic environmental parameters p, using research tools [23], as well as an internal questionnaire distributed among CHS’s pro- curement executives. Table 3 presents these parameters and their initial values. 1, 2, 3,4, 5j In order to represent various environmental influences using dynamic environment parameters we suggest con- structing dynamic weight functions. Moreover, in order to enable decision makers to construct relatively simple weight functions, we propose an initial qualitative pres- entation of the directions of environmental parameter influences on each selection parameter. Table 4 presents the direction in which each environmental parameter is expected to influence the selection parameter weight ac- cording to the decision makers’ perspective. For each selection parameter, the table presents changes which would make it more difficult to conduct business in the given environment. These changes could cause certain selection parameters to “gain weight”, and others to “lose weight”. For example, a sharp increase in the Demand parameter, for example, would require suppliers to sup- ply greater quantities, thus casing the selection parameter Max per Shipment to gain weight. Similarly, an in- creased Interest Rate would cause Inventory Mainte- nance cost to gain weight; reduced Supply Time affects the suppliers’ ability to prepare for the next shipment, thus affecting some of the selection parameters, such as Geographic Location; finally, lower Raw Materials Sup- ply would cause the supplier to increase the Cost per Unit, so that this parameter would gain weight. The thin arrows in Table 4 () indicate the desirable direction of response, according the decision makers’ subjective interpretation of changes in the selection pa- rameter weights following the negative environmental changes. Whenever a CHS decision maker can be ex- pected to be indifferent to the parameter weight change, no arrow appears. Therefore empty cells represent indif ference by the decision makers regarding the required response to the change in the environmental parameter in question. The thick arrows in Table 4 indicate worsening in environmental parameter values: higher Demand, higher Interest Rate, lower Supply Time, lower Raw Material Supply and higher Exchange Rate. To illustrate the logic filling out the table shown above, we will refer to the Min per Shipment selection parame- ter. When demand is rising, this parameter would lose weight, since under the new conditions, larger shipments are desirable. This parameter would gain weight as the Table 3. Business environment parameters: Initial 2002. Environmental Parameter Annual Demand (d) Interest Rate (r)Supply Time (DD) Raw Material Supply (nn) Nis-to-Dollar Exchange Rate (cur) Initial Value 10 0.1 5 100 4.8 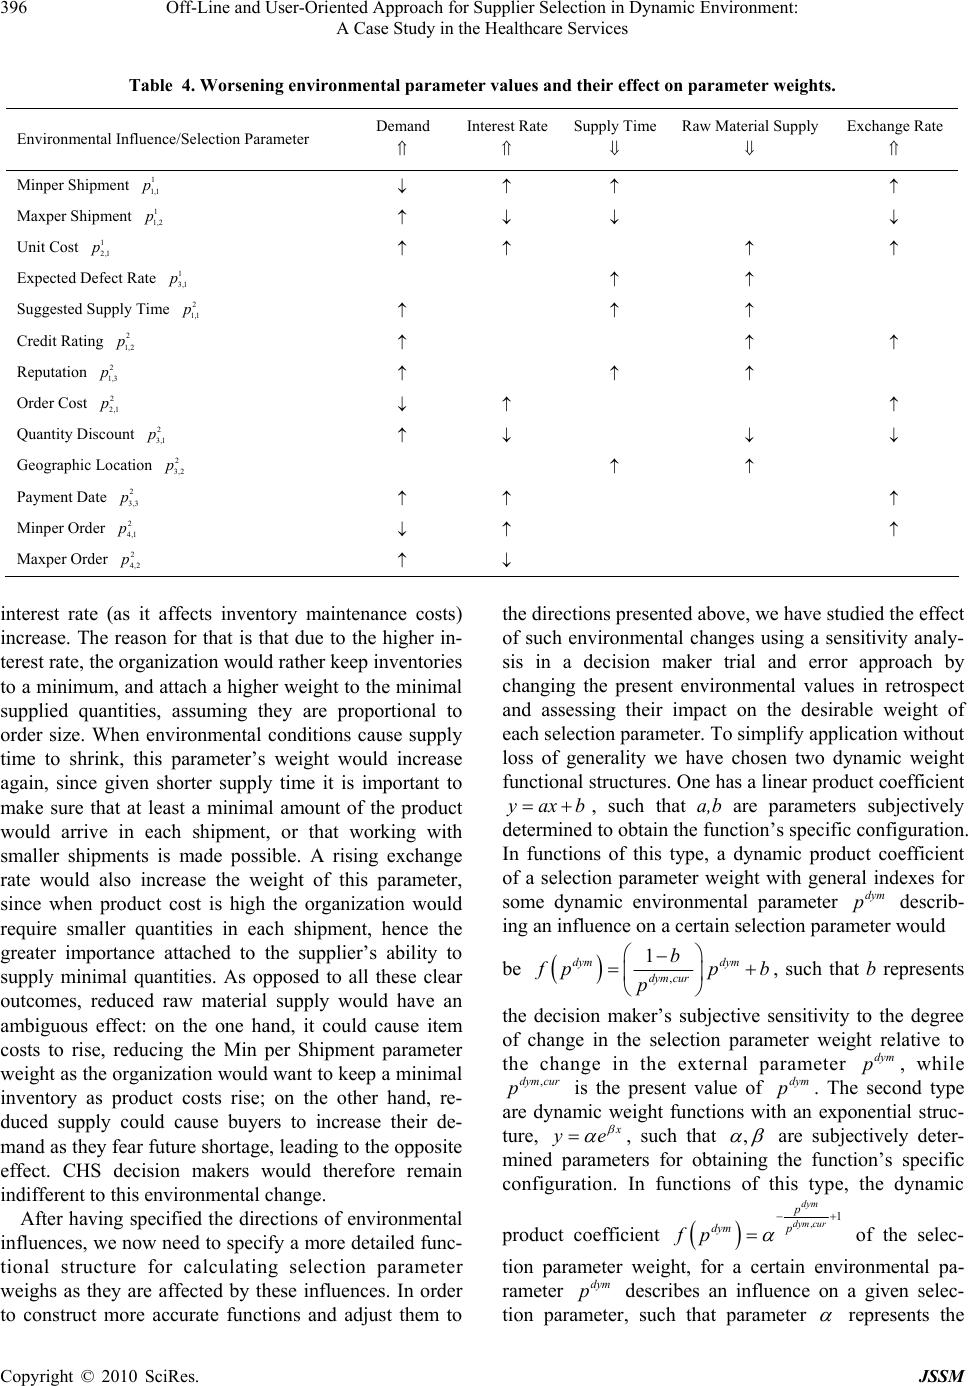 Off-Line and User-Oriented Approach for Supplier Selection in Dynamic Environment: 396 A Case Study in the Healthcare Services Table 4. Worsening environmental parameter values and their effect on parameter weights. Environmental Influence/Selection Parameter Demand Interest Rate Supply Time Raw Material Supply Exchange Rate Minper Shipment 1 1,1 Maxper Shipment 1 1,2 Unit Cost 1 2,1 Expected Defect Rate 1 3,1 Suggested Supply Time 2 1,1 Credit Rating 2 1,2 Reputation 2 1,3 Order Cost 2 2,1 Quantity Discount 2 3,1 Geographic Location 2 3,2 Payment Date 2 3,3 Minper Order 2 4,1 Maxper Order 2 4,2 interest rate (as it affects inventory maintenance costs) increase. The reason for that is that due to the higher in- terest rate, the organization would rather keep inventories to a minimum, and attach a higher weight to the minimal supplied quantities, assuming they are proportional to order size. When environmental conditions cause supply time to shrink, this parameter’s weight would increase again, since given shorter supply time it is important to make sure that at least a minimal amount of the product would arrive in each shipment, or that working with smaller shipments is made possible. A rising exchange rate would also increase the weight of this parameter, since when product cost is high the organization would require smaller quantities in each shipment, hence the greater importance attached to the supplier’s ability to supply minimal quantities. As opposed to all these clear outcomes, reduced raw material supply would have an ambiguous effect: on the one hand, it could cause item costs to rise, reducing the Min per Shipment parameter weight as the organization would want to keep a minimal inventory as product costs rise; on the other hand, re- duced supply could cause buyers to increase their de- mand as they fear future shortage, leading to the opposite effect. CHS decision makers would therefore remain indifferent to this environmental change. After having specified the directions of environmental influences, we now need to specify a more detailed func- tional structure for calculating selection parameter weighs as they are affected by these influences. In order to construct more accurate functions and adjust them to the directions presented above, we have studied the effect of such environmental changes using a sensitivity analy- sis in a decision maker trial and error approach by changing the present environmental values in retrospect and assessing their impact on the desirable weight of each selection parameter. To simplify application without loss of generality we have chosen two dynamic weight functional structures. One has a linear product coefficient yaxb , such that a,b are parameters subjectively determined to obtain the function’s specific configuration. In functions of this type, a dynamic product coefficient of a selection parameter weight with general indexes for some dynamic environmental parameter describ- ing an influence on a certain selection parameter would dym p be , 1 dym dym dym cur b p p pb , such that b represents the decision maker’s subjective sensitivity to the degree of change in the selection parameter weight relative to the change in the external parameter , while is the present value of . The second type are dynamic weight functions with an exponential struc- ture, dym p ,dym cur pdym p e , such that , are subjectively deter- mined parameters for obtaining the function’s specific configuration. In functions of this type, the dynamic product coefficient ,1 dym dym cur p dym p fp of the selec- tion parameter weight, for a certain environmental pa- rameter describes an influence on a given selec- tion parameter, such that parameter dym p represents the Copyright © 2010 SciRes. JSSM 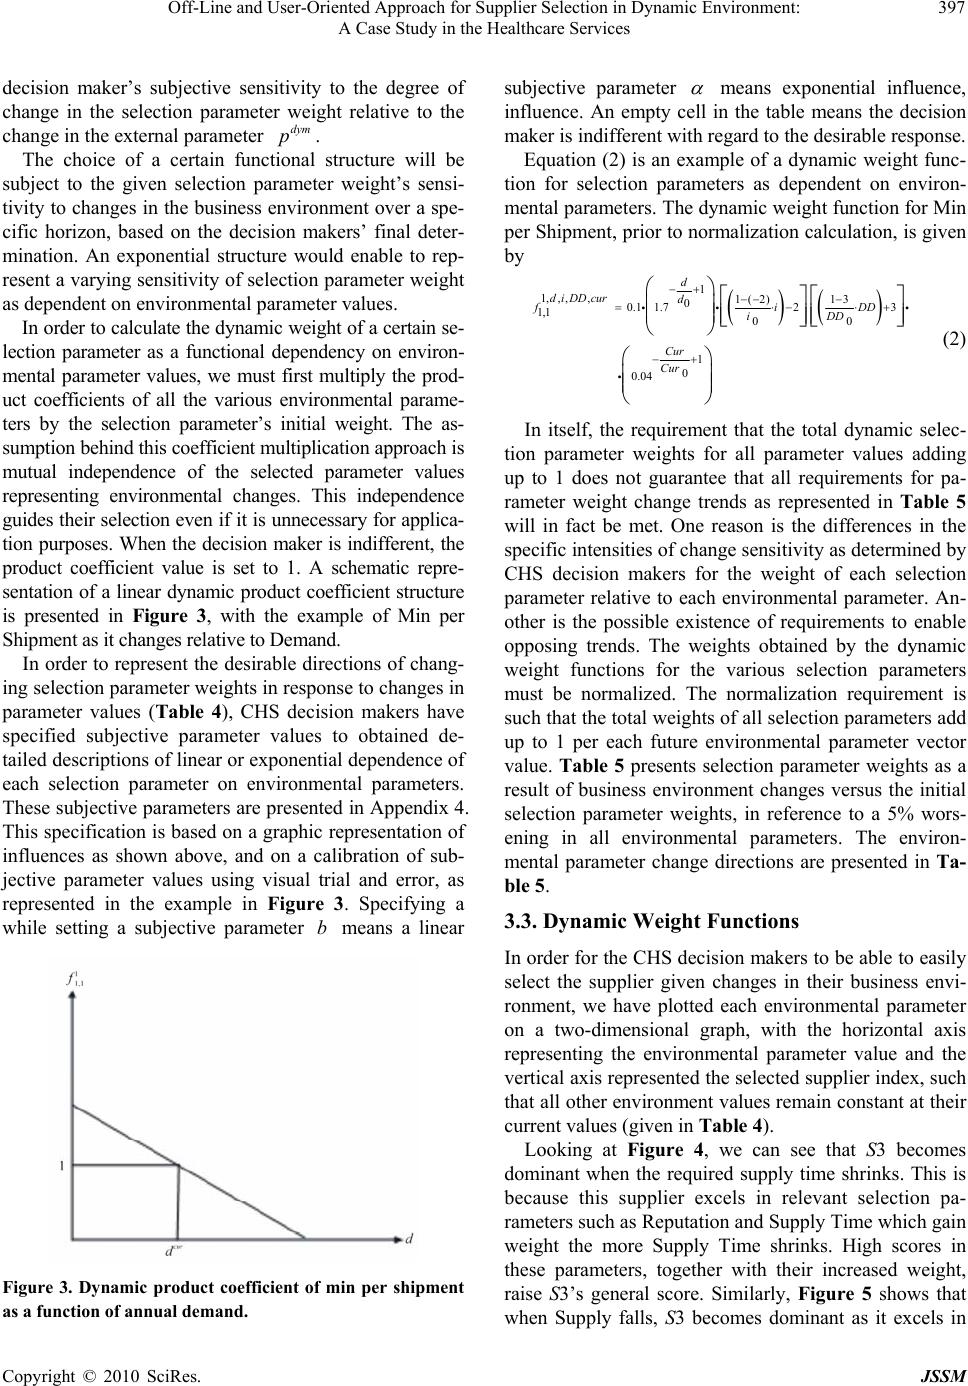 Off-Line and User-Oriented Approach for Supplier Selection in Dynamic Environment: 397 A Case Study in the Healthcare Services decision maker’s subjective sensitivity to the degree of change in the selection parameter weight relative to the change in the external parameter . dym p The choice of a certain functional structure will be subject to the given selection parameter weight’s sensi- tivity to changes in the business environment over a spe- cific horizon, based on the decision makers’ final deter- mination. An exponential structure would enable to rep- resent a varying sensitivity of selection parameter weight as dependent on environmental parameter values. In order to calculate the dynamic weight of a certain se- lection parameter as a functional dependency on environ- mental parameter values, we must first multiply the prod- uct coefficients of all the various environmental parame- ters by the selection parameter’s initial weight. The as- sumption behind this coefficient multiplication approach is mutual independence of the selected parameter values representing environmental changes. This independence guides their selection even if it is unnecessary for applica- tion purposes. When the decision maker is indifferent, the product coefficient value is set to 1. A schematic repre- sentation of a linear dynamic product coefficient structure is presented in Figure 3, with the example of Min per Shipment as it changes relative to Demand. In order to represent the desirable directions of chang- ing selection parameter weights in response to changes in parameter values (Table 4), CHS decision makers have specified subjective parameter values to obtained de- tailed descriptions of linear or exponential dependence of each selection parameter on environmental parameters. These subjective parameters are presented in Appendix 4. This specification is based on a graphic representation of influences as shown above, and on a calibration of sub- jective parameter values using visual trial and error, as represented in the example in Figure 3. Specifying a while setting a subjective parameter means a linear b Figure 3. Dynamic product coefficient of min per shipment as a function of annual demand. subjective parameter means exponential influence, influence. An empty cell in the table means the decision maker is indifferent with regard to the desirable response. Equation (2) is an example of a dynamic weight func- tion for selection parameters as dependent on environ- mental parameters. The dynamic weight function for Min per Shipment, prior to normalization calculation, is given by 1 1,,,,1(2) 13 0 0.1 1.723 1,1 00 1 0 0.04 d diDDcur d fi iDD Cur Cur DD (2) In itself, the requirement that the total dynamic selec- tion parameter weights for all parameter values adding up to 1 does not guarantee that all requirements for pa- rameter weight change trends as represented in Table 5 will in fact be met. One reason is the differences in the specific intensities of change sensitivity as determined by CHS decision makers for the weight of each selection parameter relative to each environmental parameter. An- other is the possible existence of requirements to enable opposing trends. The weights obtained by the dynamic weight functions for the various selection parameters must be normalized. The normalization requirement is such that the total weights of all selection parameters add up to 1 per each future environmental parameter vector value. Table 5 presents selection parameter weights as a result of business environment changes versus the initial selection parameter weights, in reference to a 5% wors- ening in all environmental parameters. The environ- mental parameter change directions are presented in Ta- ble 5. 3.3. Dynamic Weight Functions In order for the CHS decision makers to be able to easily select the supplier given changes in their business envi- ronment, we have plotted each environmental parameter on a two-dimensional graph, with the horizontal axis representing the environmental parameter value and the vertical axis represented the selected supplier index, such that all other environment values remain constant at their current values (given in Table 4). Looking at Figure 4, we can see that S3 becomes dominant when the required supply time shrinks. This is because this supplier excels in relevant selection pa- rameters such as Reputation and Supply Time which gain weight the more Supply Time shrinks. High scores in these parameters, together with their increased weight, raise S3’s general score. Similarly, Figure 5 shows that when Supply falls, S3 becomes dominant as it excels in Copyright © 2010 SciRes. JSSM 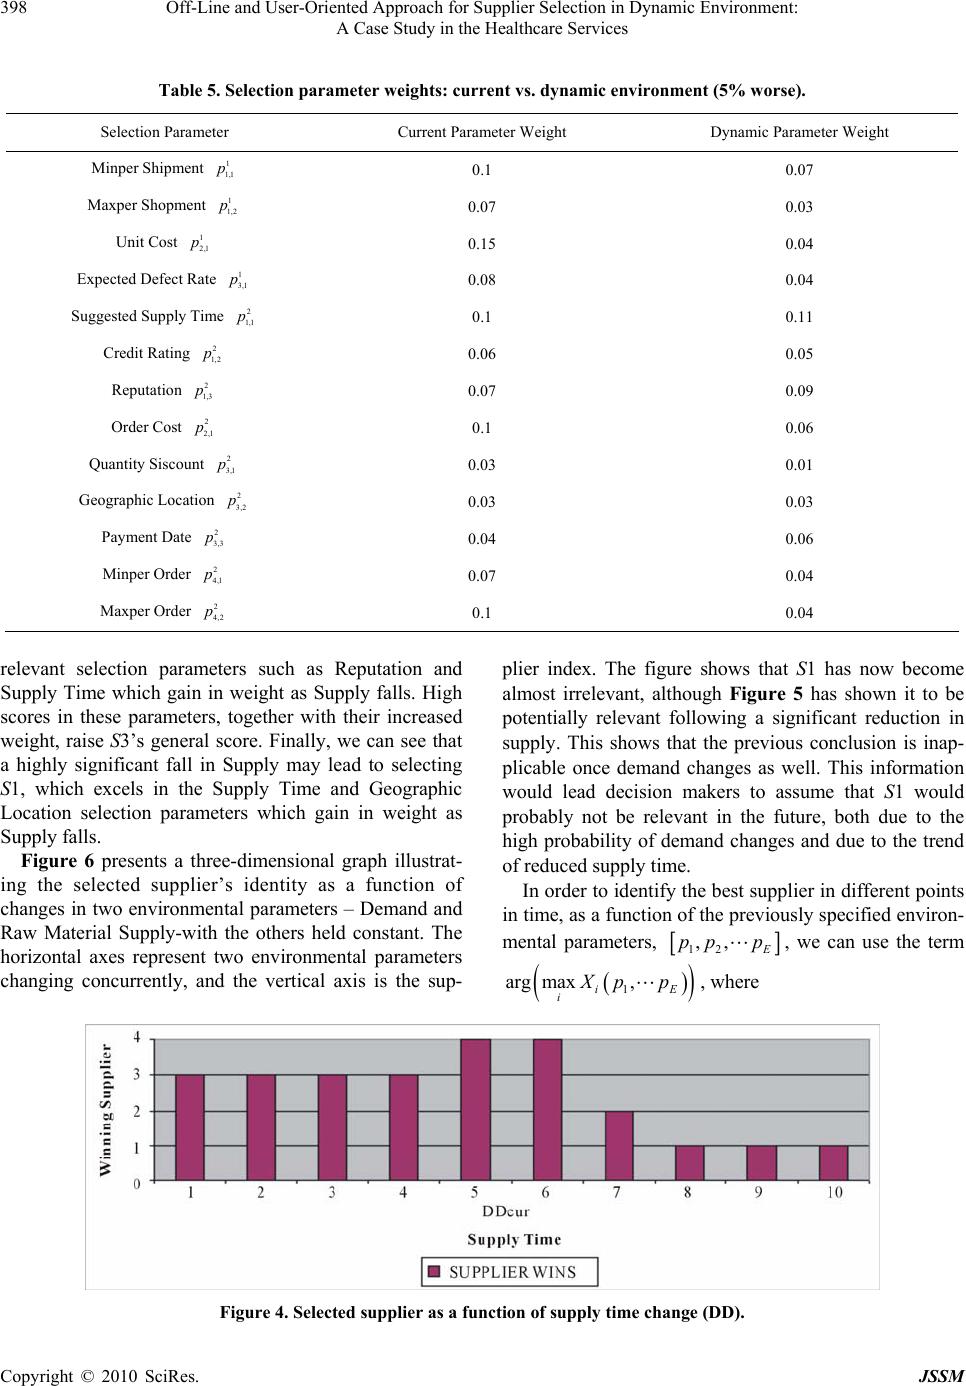 Off-Line and User-Oriented Approach for Supplier Selection in Dynamic Environment: A Case Study in the Healthcare Services Copyright © 2010 SciRes. JSSM 398 Table 5. Selection parameter weights: current vs. dynamic environment (5% worse). Selection Parameter Current Parameter Weight Dynamic Parameter Weight Minper Shipment 1 1,1 0.1 0.07 Maxper Shopment 1 1,2 0.07 0.03 Unit Cost 1 2,1 0.15 0.04 Expected Defect Rate 1 3,1 0.08 0.04 Suggested Supply Time 2 1,1 0.1 0.11 Credit Rating 2 1,2 0.06 0.05 Reputation 2 1,3 0.07 0.09 Order Cost 2 2,1 0.1 0.06 Quantity Siscount 2 3,1 0.03 0.01 Geographic Location 2 3,2 0.03 0.03 Payment Date 2 3,3 0.04 0.06 Minper Order 2 4,1 0.07 0.04 Maxper Order 2 4,2 0.1 0.04 relevant selection parameters such as Reputation and Supply Time which gain in weight as Supply falls. High scores in these parameters, together with their increased weight, raise S3’s general score. Finally, we can see that a highly significant fall in Supply may lead to selecting S1, which excels in the Supply Time and Geographic Location selection parameters which gain in weight as Supply falls. plier index. The figure shows that S1 has now become almost irrelevant, although Figure 5 has shown it to be potentially relevant following a significant reduction in supply. This shows that the previous conclusion is inap- plicable once demand changes as well. This information would lead decision makers to assume that S1 would probably not be relevant in the future, both due to the high probability of demand changes and due to the trend of reduced supply time. Figure 6 presents a three-dimensional graph illustrat- ing the selected supplier’s identity as a function of changes in two environmental parameters – Demand and Raw Material Supply-with the others held constant. The horizontal axes represent two environmental parameters changing concurrently, and the vertical axis is the sup- In order to identify the best supplier in different points in time, as a function of the previously specified environ- mental parameters, 12 ,, pp p , we can use the term E p 1 arg max, i iXp, where Figure 4. Selected supplier as a function of supply time change (DD).  Off-Line and User-Oriented Approach for Supplier Selection in Dynamic Environment: 399 A Case Study in the Healthcare Services Figure 5. Selected supplier as a function of saw material suppl y (r m). 1 1 1 11 2, 1, 111 , , 1,2,3,4 k gg gg P Qgdyn g iE i kn kn gkn Xp ppxp i , E (3) and 1,... i pp 1,... iE is a dynamic score for proposal i. The pp 1 , gg g kn score is composed of the standard scores in proposal i for the selection parameter i xp , g kn g p and dynamic weights , , gg dyn kn p , normalized as dynamically dependent on the environmental parameters, according to the following: 1 1 1 11 , , ,2 , 111 ,,,, ,,, , , 1,2, 1,2,1,2... gg gg k gg g g kn gdyn kn P Qg kn gkn gg gk fdrDDrmcur p g drDDrmcur gkQn P (3) weight coefficient functions and are presented in Appen- dix 4. This formula dictates the supplier scores according to which the most desirable supplier is identified – the one with the highest score at each potential environ- mental point. 4. Strategy for Replacing Suppliers over the Planning Horizon As already described, in 2002 the CHS Procurement Administration began evaluating potential latex glove suppliers. CHS chose one out of four candidates for a long-term contract. Hereafter, this strategy will be called the Basic Strategy. According to the Basic Strategy, the fourth supplier (S4) has been selected on the basis of its scores at the beginning of the planning horizon and is not replaced throughout it. Conversely, in our proposed me- thodology the procurement executives would have relied on CHS’s periodic future planning information system to apply a strategy that takes into account business envi- ronment forecasts over the planning period to predict future points in time in which the most desirable supplier would change. The retrospective forecast presented in Figures 7-11 enables CHS to formulate a strategy for replacing suppliers following environmental changes over the 5-year planning horizon. Regrettably, in reality CHS continued to adopt the Basic Strategy of working with a single supplier throughout the planning period, regardless of environmental changes. Figure 6. Selected supplier as a function of changing de- mand and raw material supply. Copyright © 2010 SciRes. JSSM 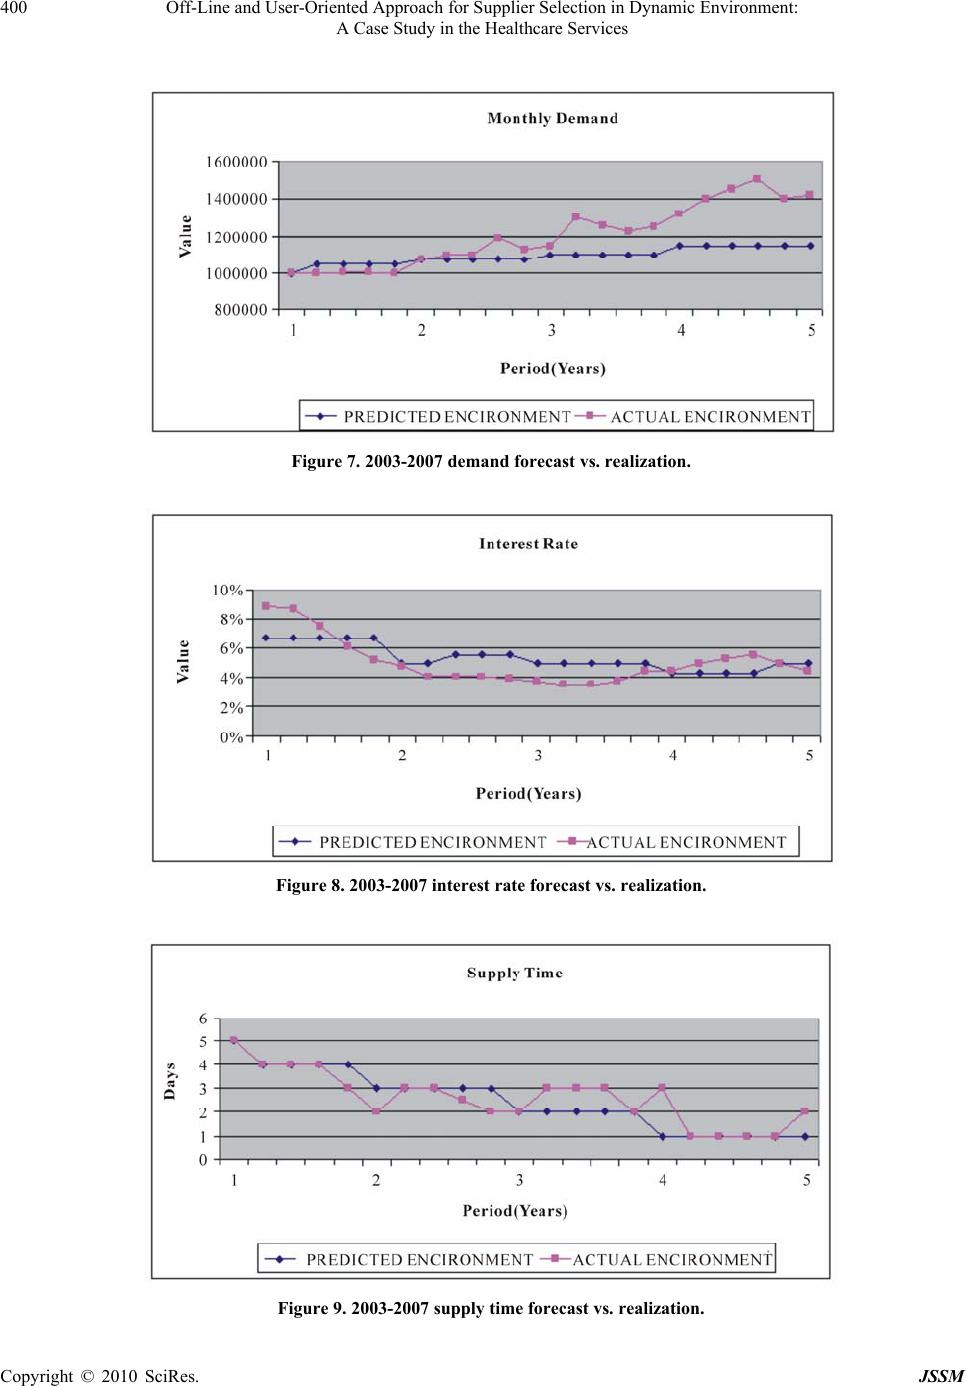 Off-Line and User-Oriented Approach for Supplier Selection in Dynamic Environment: 400 A Case Study in the Healthcare Services Figure 7. 2003-2007 demand forecast vs. realization. Figure 8. 2003-2007 interest rate forecast vs. realization. Figure 9. 2003-2007 supply time forecast vs. realization. Copyright © 2010 SciRes. JSSM 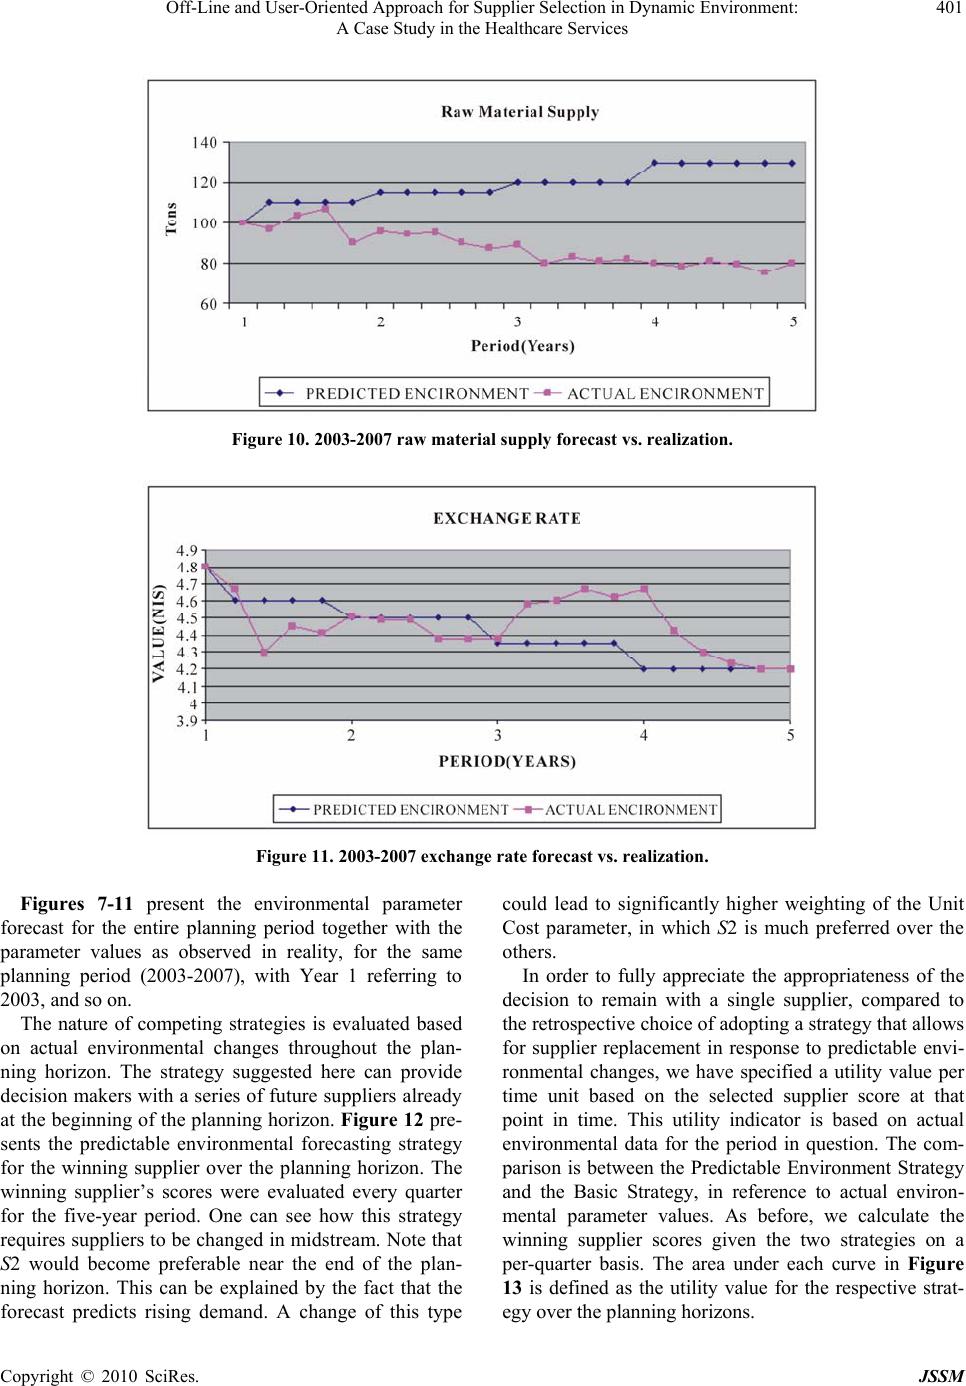 Off-Line and User-Oriented Approach for Supplier Selection in Dynamic Environment: 401 A Case Study in the Healthcare Services Figure 10. 2003-2007 raw material supply forecast vs. realization. Figure 11. 2003-2007 exchange rate forecast vs. realization. Figures 7-11 present the environmental parameter forecast for the entire planning period together with the parameter values as observed in reality, for the same planning period (2003-2007), with Year 1 referring to 2003, and so on. The nature of competing strategies is evaluated based on actual environmental changes throughout the plan- ning horizon. The strategy suggested here can provide decision makers with a series of future suppliers already at the beginning of the planning horizon. Figure 12 pre- sents the predictable environmental forecasting strategy for the winning supplier over the planning horizon. The winning supplier’s scores were evaluated every quarter for the five-year period. One can see how this strategy requires suppliers to be changed in midstream. Note that S2 would become preferable near the end of the plan- ning horizon. This can be explained by the fact that the forecast predicts rising demand. A change of this type could lead to significantly higher weighting of the Unit Cost parameter, in which S2 is much preferred over the others. In order to fully appreciate the appropriateness of the decision to remain with a single supplier, compared to the retrospective choice of adopting a strategy that allows for supplier replacement in response to predictable envi- ronmental changes, we have specified a utility value per time unit based on the selected supplier score at that point in time. This utility indicator is based on actual environmental data for the period in question. The com- parison is between the Predictable Environment Strategy and the Basic Strategy, in reference to actual environ- mental parameter values. As before, we calculate the winning supplier scores given the two strategies on a per-quarter basis. The area under each curve in Figure 13 is defined as the utility value for the respective strat- eg over the planning horizons. y Copyright © 2010 SciRes. JSSM 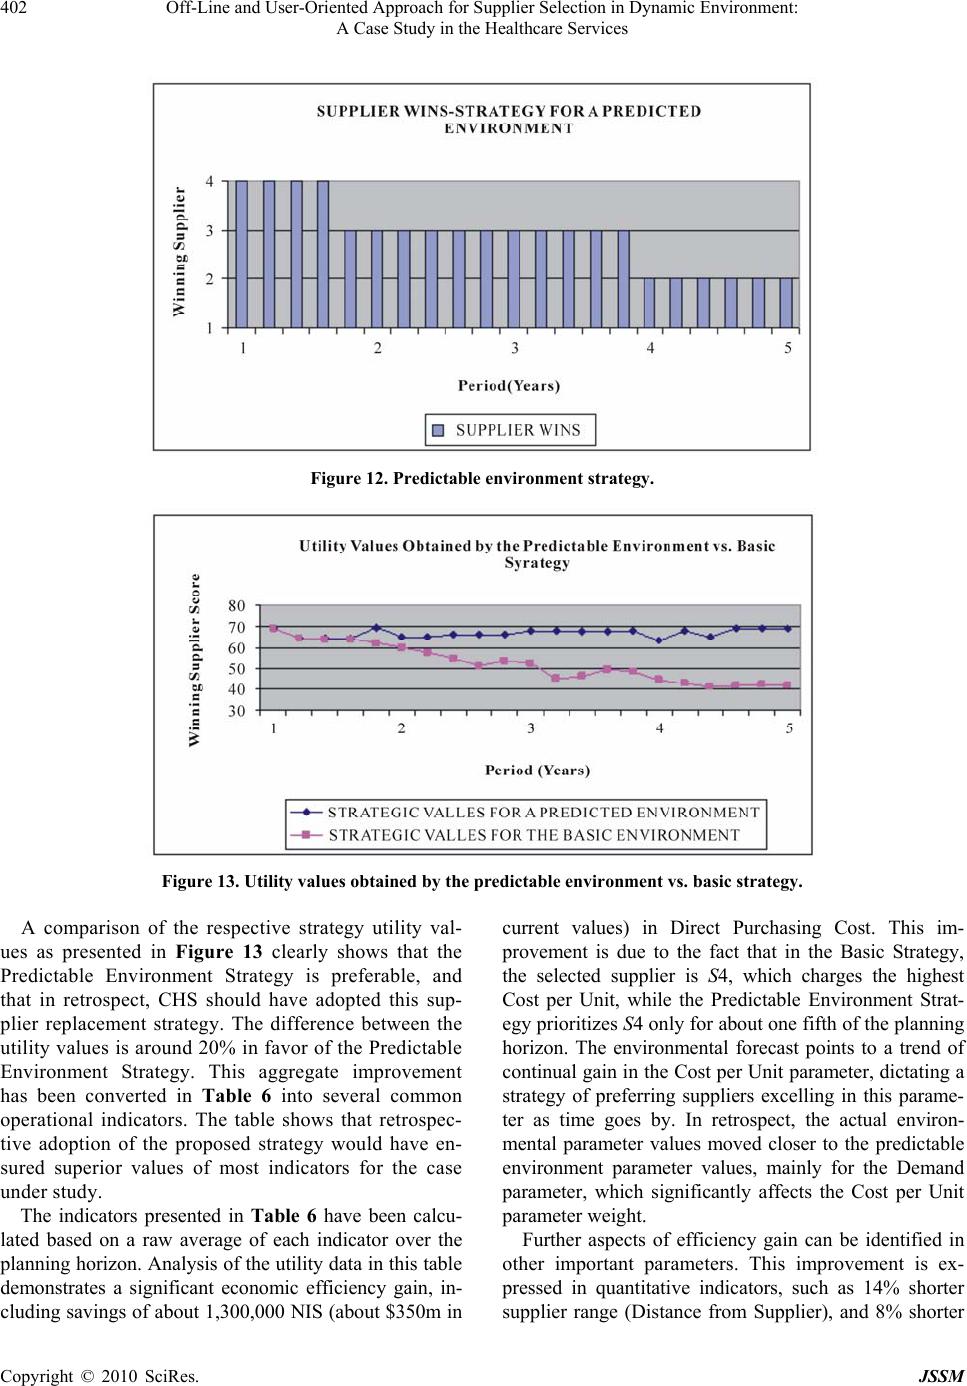 Off-Line and User-Oriented Approach for Supplier Selection in Dynamic Environment: 402 A Case Study in the Healthcare Services Figure 12. Predictable environment strategy. Figure 13. Utility values obtained by the predictable environment vs. basic strategy. A comparison of the respective strategy utility val- ues as presented in Figure 13 clearly shows that the Predictable Environment Strategy is preferable, and that in retrospect, CHS should have adopted this sup- plier replacement strategy. The difference between the utility values is around 20% in favor of the Predictable Environment Strategy. This aggregate improvement has been converted in Table 6 into several common operational indicators. The table shows that retrospec- tive adoption of the proposed strategy would have en- sured superior values of most indicators for the case under study. The indicators presented in Table 6 have been calcu- lated based on a raw average of each indicator over the planning horizon. Analysis of the utility data in this table demonstrates a significant economic efficiency gain, in- cluding savings of about 1,300,000 NIS (about $350m in current values) in Direct Purchasing Cost. This im- provement is due to the fact that in the Basic Strategy, the selected supplier is S4, which charges the highest Cost per Unit, while the Predictable Environment Strat- egy prioritizes S4 only for about one fifth of the planning horizon. The environmental forecast points to a trend of continual gain in the Cost per Unit parameter, dictating a strategy of preferring suppliers excelling in this parame- ter as time goes by. In retrospect, the actual environ- mental parameter values moved closer to the predictable environment parameter values, mainly for the Demand parameter, which significantly affects the Cost per Unit parameter weight. Further aspects of efficiency gain can be identified in other important parameters. This improvement is ex- pressed in quantitative indicators, such as 14% shorter upplier range (Distance from Supplier), and 8% shorter s Copyright © 2010 SciRes. JSSM 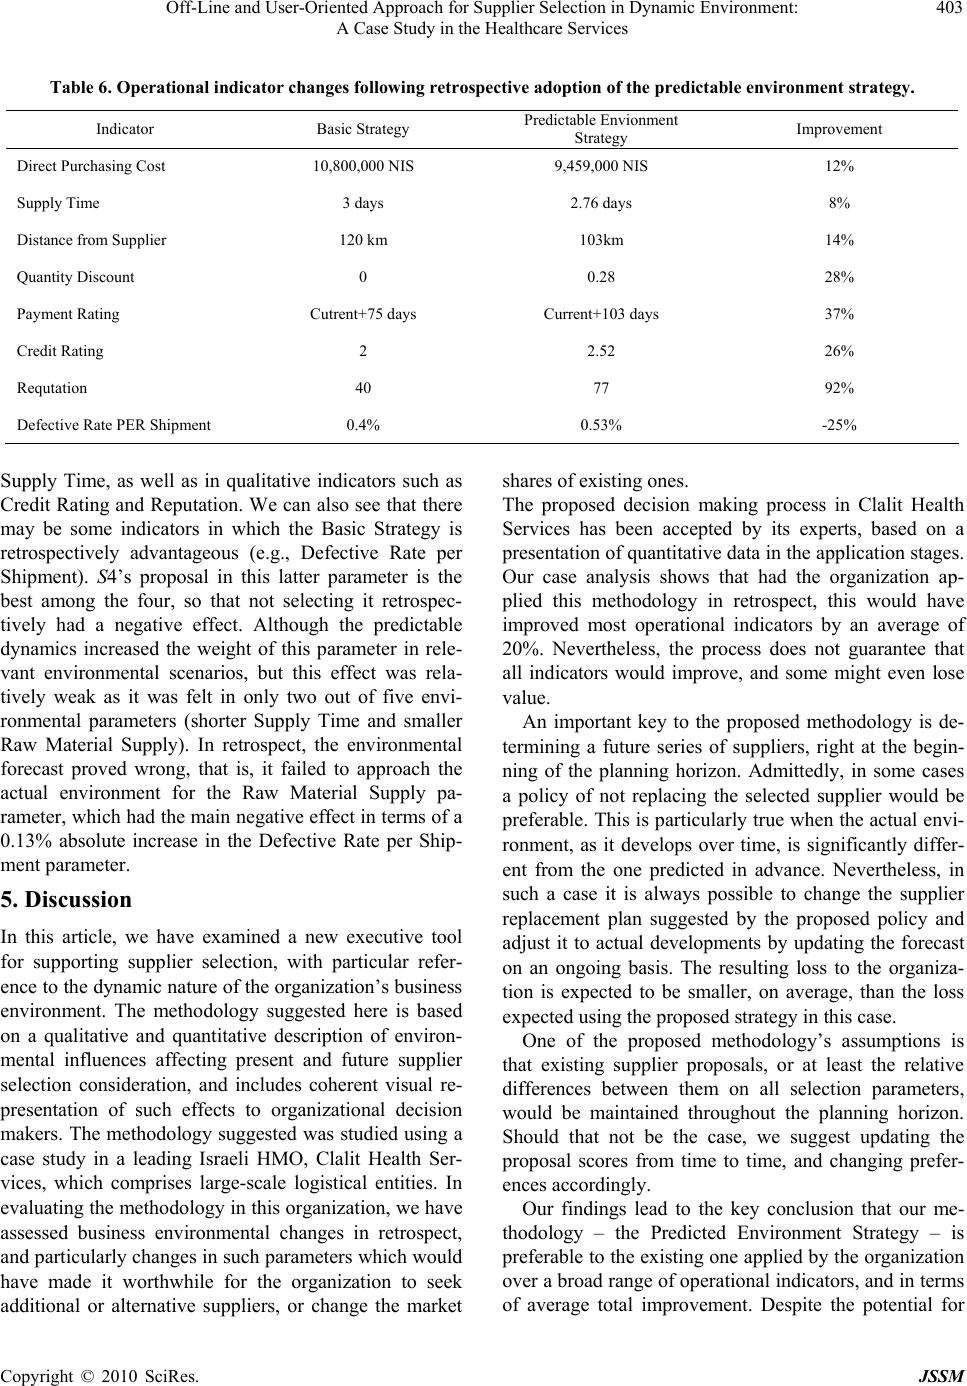 Off-Line and User-Oriented Approach for Supplier Selection in Dynamic Environment: 403 A Case Study in the Healthcare Services Table 6. Operational indicator changes following retrospective adoption of the predictable environment strategy. Indicator Basic Strategy Predictable Envionment Strategy Improvement Direct Purchasing Cost 10,800,000 NIS 9,459,000 NIS 12% Supply Time 3 days 2.76 days 8% Distance from Supplier 120 km 103km 14% Quantity Discount 0 0.28 28% Payment Rating Cutrent+75 days Current+103 days 37% Credit Rating 2 2.52 26% Requtation 40 77 92% Defective Rate PER Shipment 0.4% 0.53% -25% Supply Time, as well as in qualitative indicators such as Credit Rating and Reputation. We can also see that there may be some indicators in which the Basic Strategy is retrospectively advantageous (e.g., Defective Rate per Shipment). S4’s proposal in this latter parameter is the best among the four, so that not selecting it retrospec- tively had a negative effect. Although the predictable dynamics increased the weight of this parameter in rele- vant environmental scenarios, but this effect was rela- tively weak as it was felt in only two out of five envi- ronmental parameters (shorter Supply Time and smaller Raw Material Supply). In retrospect, the environmental forecast proved wrong, that is, it failed to approach the actual environment for the Raw Material Supply pa- rameter, which had the main negative effect in terms of a 0.13% absolute increase in the Defective Rate per Ship- ment parameter. 5. Discussion In this article, we have examined a new executive tool for supporting supplier selection, with particular refer- ence to the dynamic nature of the organization’s business environment. The methodology suggested here is based on a qualitative and quantitative description of environ- mental influences affecting present and future supplier selection consideration, and includes coherent visual re- presentation of such effects to organizational decision makers. The methodology suggested was studied using a case study in a leading Israeli HMO, Clalit Health Ser- vices, which comprises large-scale logistical entities. In evaluating the methodology in this organization, we have assessed business environmental changes in retrospect, and particularly changes in such parameters which would have made it worthwhile for the organization to seek additional or alternative suppliers, or change the market shares of existing ones. The proposed decision making process in Clalit Health Services has been accepted by its experts, based on a presentation of quantitative data in the application stages. Our case analysis shows that had the organization ap- plied this methodology in retrospect, this would have improved most operational indicators by an average of 20%. Nevertheless, the process does not guarantee that all indicators would improve, and some might even lose value. An important key to the proposed methodology is de- termining a future series of suppliers, right at the begin- ning of the planning horizon. Admittedly, in some cases a policy of not replacing the selected supplier would be preferable. This is particularly true when the actual envi- ronment, as it develops over time, is significantly differ- ent from the one predicted in advance. Nevertheless, in such a case it is always possible to change the supplier replacement plan suggested by the proposed policy and adjust it to actual developments by updating the forecast on an ongoing basis. The resulting loss to the organiza- tion is expected to be smaller, on average, than the loss expected using the proposed strategy in this case. One of the proposed methodology’s assumptions is that existing supplier proposals, or at least the relative differences between them on all selection parameters, would be maintained throughout the planning horizon. Should that not be the case, we suggest updating the proposal scores from time to time, and changing prefer- ences accordingly. Our findings lead to the key conclusion that our me- thodology – the Predicted Environment Strategy – is preferable to the existing one applied by the organization over a broad range of operational indicators, and in terms of average total improvement. Despite the potential for Copyright © 2010 SciRes. JSSM 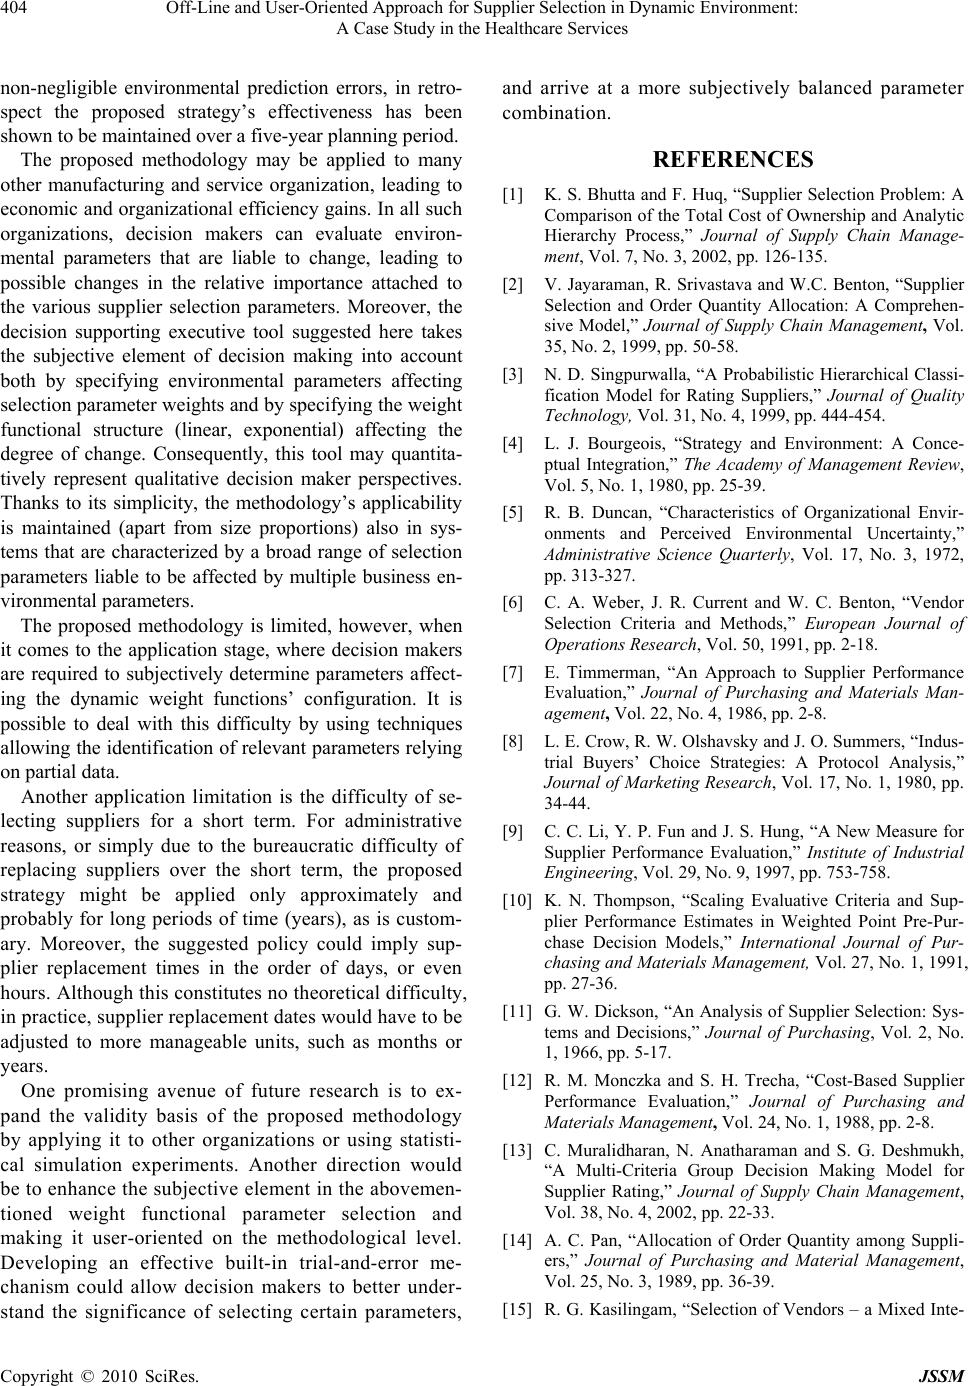 Off-Line and User-Oriented Approach for Supplier Selection in Dynamic Environment: 404 A Case Study in the Healthcare Services non-negligible environmental prediction errors, in retro- spect the proposed strategy’s effectiveness has been shown to be maintained over a five-year planning period. The proposed methodology may be applied to many other manufacturing and service organization, leading to economic and organizational efficiency gains. In all such organizations, decision makers can evaluate environ- mental parameters that are liable to change, leading to possible changes in the relative importance attached to the various supplier selection parameters. Moreover, the decision supporting executive tool suggested here takes the subjective element of decision making into account both by specifying environmental parameters affecting selection parameter weights and by specifying the weight functional structure (linear, exponential) affecting the degree of change. Consequently, this tool may quantita- tively represent qualitative decision maker perspectives. Thanks to its simplicity, the methodology’s applicability is maintained (apart from size proportions) also in sys- tems that are characterized by a broad range of selection parameters liable to be affected by multiple business en- vironmental parameters. The proposed methodology is limited, however, when it comes to the application stage, where decision makers are required to subjectively determine parameters affect- ing the dynamic weight functions’ configuration. It is possible to deal with this difficulty by using techniques allowing the identification of relevant parameters relying on partial data. Another application limitation is the difficulty of se- lecting suppliers for a short term. For administrative reasons, or simply due to the bureaucratic difficulty of replacing suppliers over the short term, the proposed strategy might be applied only approximately and probably for long periods of time (years), as is custom- ary. Moreover, the suggested policy could imply sup- plier replacement times in the order of days, or even hours. Although this constitutes no theoretical difficulty, in practice, supplier replacement dates would have to be adjusted to more manageable units, such as months or years. One promising avenue of future research is to ex- pand the validity basis of the proposed methodology by applying it to other organizations or using statisti- cal simulation experiments. Another direction would be to enhance the subjective element in the abovemen- tioned weight functional parameter selection and making it user-oriented on the methodological level. Developing an effective built-in trial-and-error me- chanism could allow decision makers to better under- stand the significance of selecting certain parameters, and arrive at a more subjectively balanced parameter combination. REFERENCES [1] K. S. Bhutta and F. Huq, “Supplier Selection Problem: A Comparison of the Total Cost of Ownership and Analytic Hierarchy Process,” Journal of Supply Chain Manage- ment, Vol. 7, No. 3, 2002, pp. 126-135. [2] V. Jayaraman, R. Srivastava and W.C. Benton, “Supplier Selection and Order Quantity Allocation: A Comprehen- sive Model,” Journal of Supply Chain Management, Vol. 35, No. 2, 1999, pp. 50-58. [3] N. D. Singpurwalla, “A Probabilistic Hierarchical Classi- fication Model for Rating Suppliers,” Journal of Quality Technology, Vol. 31, No. 4, 1999, pp. 444-454. [4] L. J. Bourgeois, “Strategy and Environment: A Conce- ptual Integration,” The Academy of Management Review, Vol. 5, No. 1, 1980, pp. 25-39. [5] R. B. Duncan, “Characteristics of Organizational Envir- onments and Perceived Environmental Uncertainty,” Administrative Science Quarterly, Vol. 17, No. 3, 1972, pp. 313-327. [6] C. A. Weber, J. R. Current and W. C. Benton, “Vendor Selection Criteria and Methods,” European Journal of Operations Research, Vol. 50, 1991, pp. 2-18. [7] E. Timmerman, “An Approach to Supplier Performance Evaluation,” Journal of Purchasing and Materials Man- agement, Vol. 22, No. 4, 1986, pp. 2-8. [8] L. E. Crow, R. W. Olshavsky and J. O. Summers, “Indus- trial Buyers’ Choice Strategies: A Protocol Analysis,” Journal of Marketing Research, Vol. 17, No. 1, 1980, pp. 34-44. [9] C. C. Li, Y. P. Fun and J. S. Hung, “A New Measure for Supplier Performance Evaluation,” Institute of Industrial Engineering, Vol. 29, No. 9, 1997, pp. 753-758. [10] K. N. Thompson, “Scaling Evaluative Criteria and Sup- plier Performance Estimates in Weighted Point Pre-Pur- chase Decision Models,” International Journal of Pur- chasing and Materials Management, Vol. 27, No. 1, 1991, pp. 27-36. [11] G. W. Dickson, “An Analysis of Supplier Selection: Sys- tems and Decisions,” Journal of Purchasing, Vol. 2, No. 1, 1966, pp. 5-17. [12] R. M. Monczka and S. H. Trecha, “Cost-Based Supplier Performance Evaluation,” Journal of Purchasing and Materials Management, Vol. 24, No. 1, 1988, pp. 2-8. [13] C. Muralidharan, N. Anatharaman and S. G. Deshmukh, “A Multi-Criteria Group Decision Making Model for Supplier Rating,” Journal of Supply Chain Management, Vol. 38, No. 4, 2002, pp. 22-33. [14] A. C. Pan, “Allocation of Order Quantity among Suppli- ers,” Journal of Purchasing and Material Management, Vol. 25, No. 3, 1989, pp. 36-39. [15] R. G. Kasilingam, “Selection of Vendors – a Mixed Inte- Copyright © 2010 SciRes. JSSM  Off-Line and User-Oriented Approach for Supplier Selection in Dynamic Environment: A Case Study in the Healthcare Services Copyright © 2010 SciRes. JSSM 405 ger Programming Approach,” Computers and Industrial Engineering, Vol. 22, No. 1-2, 1996, pp. 347-350. [16] J. D. Hong and C. Hayya, “Just-in-Time Purchasing: Sin- gle or Multiple Sourcing?” International Journal of Pro- duction Economics, Vol. 27, No. 2, 1992, pp. 171-181. [17] C. A. Weber and L. M. Ellarm, “Supplier Selection Using Multi-Objective Programming: A Decision Support Sys- tem Approach,” International Journal of Physical Dis- tribution and Logistics Management, Vol. 23, No. 2, 1993, pp. 3-14. [18] G. Wang, S. H. Huang and J. P. Dismukes, “Product Dri- ven Supply Chain Selection Using Integrated Multi-Cri- teria Decision Making Methodology,” International Jour- nal of Production Economics, Vol. 91, No. 2, 2004, pp. 1-15. [19] W. Soukup, “Supplier Selection Strategies,” Journal of Purchasing and Materials Management, Vol. 23, No. 2, 1987, pp. 7-12. [20] Z. Liao and J. Rittscher, “A Multi-Objective Supplier Selection Model under Stochastic Demand Conditions,” International Journal of Production Economics, Vol. 105, No. 1, 2008, pp. 150-159. [21] P. Keles and J. C. Hartman, “Case Study: Bus Fleet Re- placement,” The Engineering Economist, Vol. 49, No. 3, 2004, pp. 253-278. [22] R. Verma and M. Pullman, “An Analysis of the Supplier Selection Process,” International Journal of Management Science, Vol. 26, No. 6, 1998, pp. 739-750. [23] R. A. D’Aveni and D. J. Ravenscraft, “Economies of Integration versus Bureaucracy Costs: Does Vertical In- tegration Improve Performance?” The Academy of Man- agement Journal, Vol. 37, No. 5, 1994, pp. 1167-1206. Appendix 1. Supplier proposal and their total standard scores. Supplier 1S 2S 3S 4S Selection Parameter Proposal 10,000 10,000 5,000 1,500 Min per Shipment 1 1,1 St. Score 40 40 80 100 500,000 1,000,0001,500,000 2, 000, 000 Proposal 1 1,2 St. Score 20 40 60 80 Max per Shipment 0.17 0.18 0.15 0.12 Proposal Unit Cost (NIS) 1 2,1 St. Score 80 100 60 40 Defective Rate per Shipment 0.8 0.7 0.5 0.4 Proposal 1 3,1 St. Score 40 60 80 80 Supply Time (days) Proposal 1 4 2 3 2 1,1 St. Score 100 40 80 60 Proposal 3 2 3 2 2 1,2 Credit Rating St. Score 60 40 60 40 Very high perform- ance Low performance Proposal High performance N/A 2 1,3 Reputation St. Score 80 59.78 100 40 Cost per Order (NIS) Proposal 700 780 850 615 2 2,1 St. Score 80 60 40 80 Distance from Sup- plier Proposal 20 60 120 120 2 3,2 St. Score 100 80 60 60 Payment Date (Cur- rent+) 75 120 60 90 Proposal 2 3,3 St. Score 40 60 60 80 50,000 100,000 30,000 80,000 Proposal 2 4,1 Min per Order St. Score 80 40 80 60 10,000,000 5,000,000 25,000,000 Proposal 15,000,000 2 4,2 Max per Order St. Score 40 60 60 100  Off-Line and User-Oriented Approach for Supplier Selection in Dynamic Environment: 406 A Case Study in the Healthcare Services Appendix 2. Suggested likert-sca le rank score transformation. Rating/Parameter 1 2 3 4 5 33 10 107.5 10m 1 1,1 Min per Shipment 3 10 10m 44 0.75 100.510m33 510 2.510m 3 2.5 10m Max per Shipment 1 1,2 5 510 65 105 10 66 1.5 1010 66 210 1.510 6 210 Unit Cost 1 2,1 0.2c 0.180.2c 0.160.18c 0.140.16c 0.14c Expected Defect Rate 1 3,1 1P 0.8 1P 0.60.8P 0.40.6P 0.4P Suggested Supply Time 2 1,1 5LT 45LT 34LT 23LT 2LT Credit Rating 2 1,2 1Cre 2Cre 3Cre 45Cre Cre Reputation 2 1,3 Very low performance Low performance Medium performance High performance Very high performance Order Cost 2 2,1 900oc 900800oc 800700oc 700600oc 600oc Quantity Discount2 3,1 200D 150200D 100150D 50100D 50D Geographic Location 2 3,2 30CR 3060CR 6090CR 90120CR 120CR Payment Date 2 3,3 5 10o 55 100.75 10o 55 0.75 100.5 10o 55 0.510 0.2510o 5 0.25 10o Min per Order 2 4,1 6 510O 77 0.5 1010O 77 101.5 10O 77 10210O 7 210O The parameter – Quantity Discount – has been specified with a transformation which expresses a binary rating, as shown in the table below. 2 3,1 p Selection Parameter/ Rating 0 1 2 3,1 Quantity Discount None √ Appendix 3. Selection parameter weights. Selection Parameter Weight Min per Shipment1 1,1 0.1 Max per Shipment1 1,2 0.07 1 2,1 Unit Cost 0.15 1 3,1 Expected Defect Rate0.08 2 1,1 Suggested Supply Time0.1 2 1,2 Credit Rating0.06 2 1,3 Reputation 0.07 2 2,1 Order Cost0.1 2 3,1 Quantity Discount0.03 2 3,2 Geographic Location0.03 2 3,3 Payment Date0.03 2 4,1 Min per Order 0.04 2 4,2 Max per Order0.07 Copyright © 2010 SciRes. JSSM  Off-Line and User-Oriented Approach for Supplier Selection in Dynamic Environment: A Case Study in the Healthcare Services Copyright © 2010 SciRes. JSSM 407 Appendix 4. Subjective parameters in dynamic selection weights. As a function of annual demand Selection Parameter As a function of interest rate As a function of supply time As a function of raw material cost As a function of exchange rate Min per Shipment1 1,1 1.7 2b 3b 0.04 Max per Shipment1 1,2 0.08 3b 1b 2b Unit Cost1 2,1 0.0001 0.0001 8b 0.0001 Expected Defect Rate1 3,1 6b 0.05 Suggested Supply Time2 1,1 0.0001 10b 4 Credit Rating2 1,2 0.0001 2b 0.05 Reputation 2 1,3 0.0001 10b 5b Order Cost2 2,1 2b 0.001 3b Quantity Discount2 3,1 1.5b 4b 1.5b 4b Geographic Location2 3,2 10b 10b Payment Date2 3,3 0.0001 0.0003 0.0003 Min per Order2 4,1 2 2b 0.002 Max per Order2 4,2 0.05 2b 5.1 b
|