Paper Menu >>
Journal Menu >>
 Journal of Environmental Protection, 2010, 1, 389-400 doi:10.4236/jep.2010.14045 Published Online December 2010 (http://www.SciRP.org/journal/jep) Copyright © 2010 SciRes. JEP 389 Water Quality and Heavy Metal Monitoring in Water, Sediments, and Tissues of the African Catfish Clarias gariepinus (Burchell, 1822) from the River Nile, Egypt Alaa G. M. Osman1,2*, Werner Kloas2 1Department of Zoology, Faculty of Science, Al-Azhar University (Assiut Branch), Assiut, Egypt; 2Leibniz-Institute of Freshwater Ecology and Inland Fisheries, Berlin, Germany. Email: osman@igb-berlin.de Received June 24th, 2010; revised July 19th, 2010; accepted July 30th, 2010. ABSTRACT Water quality of the river Nile and trace elements of the water, sediments and fish tissues were investigated in the cur- rent work. Eighteen different sampling points were selected along the whole course of the River Nile from its spring at Aswan to its estuaries at Rosetta and Damietta. Higher mean value of conductivity, alkalinity, chemical oxygen demand (COD), total organic carbon (TOC), ammonia (NH3), nitrate (NO3), total solid (TS), sulphate (SO4), chloride (Cl), or- thophosphate were recorded in the water of Damietta and Rosetta branches comparing to other sites. Also trace metals in the water, sediments and tissues of Clarias gariepinus increased significantly (P < 0.05) from Aswan toward Dami- etta and Rosetta branch. Such increase proves the presence of large quantities of organic and inorganic pollutants in Rosetta and Damietta water. This was expected due to the fact that the water of such branches receives high concentra- tions of organic and inorganic pollutants from industrial, domestic as well as diffuse agricultural wastewater. The heavy metal residues in the tissues of Clarias gariepinus exhibited different patterns of accumulation and distribution among the selected tissues and localities. It was evident from our study that, liver was the site of maximum accumula- tion for the elements followed by gills while muscle was the over all site of least metal accumulation. Trace metals ac- cumulations in fish liver at sites under investigation were detected in the following descending order: Zn > Fe > Cu > Pb > Mn > Cr> Cd > Hg. In the gill tissues theses metals were accumulated in the following order Fe > Zn > Mn > Pb > Cr > Cu > Cd> Hg. The low accumulation of metals in muscle may be due to lack of binding affinity of these metals with the proteins of muscle. This is particularly important because muscles contribute the greatest mass of the flesh that is consumed as food. Keywords: Water Quality, Sediment, River Nile, Clarias gariepinus, Heavy Metals, Aquatic Pollution 1. Introduction Water pollution is thus a cosmopolitan problem that needs urgent attention and prevention [1-3]. It resulted from many sources, e.g. accidental spillage of chemical wastes, discharge of industrial or sewerage effluents, agricultural drainage, domestic wastewater and gasoline from fishery boots [2,4]. Water pollution is one of the principal environmental and public health problems Egyptian River Nile are facing [5]. The Nile is the donor of life to Egypt and represents the principal freshwater resource for the country, meeting nearly all demands for drinking water, irrigation, and industry [6]. During its transit through Egypt, the river Nile receives numerous non-point and point source discharges [6]. Now, the changes in Nile water quality are primarily due to a com- bination of theses contaminants. Water quality is a term used to express the suitability of water to sustain various uses or processes [7]. The quality of water may be described in terms of the con- centration and state the organic and inorganic material present in the water, together with certain physical char- acteristics of the water [8]. The composition of surface waters is dependent on natural factors in the drainage basin and varies with seasonal differences in runoff volumes, weather conditions and water levels. Human  Water Quality and Heavy Metal Monitoring in Water, Sediments, and Tissues of the African Catfish Clarias gariepinus (Burchell, 1822) from the River Nile, Egypt Copyright © 2010 SciRes. JEP 390 intervention also has significant effects on water quality [8]. Some of these effects are the polluting activities, such as the discharge of domestic, industrial, urban and other wastewaters into the watercourse (whether inten- tional or accidental) [9]. The principal reason for moni- toring water quality has been the need to verify whether the observed water quality is suitable for intended uses [7]. However, monitoring has also evolved to determine trends in the quality of the aquatic environment and how the environment is affected by the release of contami- nants, by other human activities, and/or by waste treat- ment operations. Sediments are one of the possible media in aquatic monitoring. Apart from water, sediments are also respon- sible of nutrients and pollutant transportation in aquatic environment. Sediments are known to capture hydropho- bic chemicals pollutants entering water bodies [10] and slowly releasing the contaminant back into the water column [7,10]. Therefore, ensuring a good sediment qual- ity is crucial to maintain a healthy aquatic ecosystem, which ensuring good protection of human health and aquatic life. In addition to the physical and chemical rela- tionships between sediments and contaminants, sediments are of fundamental importance to benthic communities in terms of providing suitable habitats for essential biologi- cal processes. Therefore, sediments provide an essential link between chemical and biological processes. Fish accumulate toxic chemicals directly from the wa- ter and through their diet, and contaminant residues may ultimately reach concentrations hundreds or thousands of times above those measured in the water, sediment and food [11-13]. For this reason, monitoring fish tissue con- tamination serves an important function as an early warn- ing indicator of sediment contamination or related water quality problems [14,15]. Monitoring fish tissue contami- nation also enables us to detect concentrations of toxic chemicals in fish that may be harmful to consumers, and take appropriate action to protect public health and the environment. Multiple factors including season, physical and chemical properties of water can play a significant role in metal accumulation in different fish tissues [16,17]. It is therefore of great significance to evaluate pollution effects on fish for both environmental protec- tion and socio-economic reasons [18]. A combination of biological monitoring (Bioaccumu- lation) and measurements of water and sediment quality can provide a good indication of conditions and potential risks to the water body. The present paper is a part of a detailed investigation entitled (Biomonitoring of the river Nile pollution using biomarker responses in fishes). The present part was aimed to study the heavy metal moni- toring in water, sediments, and tissues of the African catfish (Clarias gariepinus) as biomarkers in combina- tion with quality of water collected from six different sites along the whole course of the river Nile from its spring at Aswan to its estuaries at Rosetta and Damietta. 2. Materials and Methods 2.1. Study Area The program of monitoring had been planned and im- plemented to know the quality of water and the influence of the drained water on its aquatic life. Eighteen different sampling points from six sites (three points for each sit) were selected along the whole course of the river Nile from its spring at Aswan to its estuaries at Rosetta and Damietta (Figure 1). Sites Corresponding points Aswan Aswan city, Aswan dam, and Kom-Umbo. Kena Armant, Qena, and Naj-Hamadi. Assiut Sedfa, Assiut, and Qusia. Beni-SuefAl-Fashen, Beni-Suef, and Al-Wasta. Damietta Zefta, Mansoura, and Damitta. Rosetta Cairo, Kafr-Elzeyat, and Rasheed. 2.2. Water Analysis Water sample were collected bimonthly by polyvinyl chloride Van Dorn bottle (5 L capacity) two meter depths at the selected eighteen points along the whole course of the river Nile during the period from July 2009 to Jun 2010. Water samples were kept into a one-litre polyeth- ylene bottle in ice box and analyzed in the laboratory. Some of the physicochemical parameters including the electrical conductivity of the water samples (mS·cm-1), pH, and water temperature (℃) were measured by using water checker U-10 Horiba Ltd. The other water criteria [Chemical oxygen demand (COD), Total Organic Com- pound (TOC), Total solids (TS), Hardness (Hard), Major cations (Ca, Mg), Ammonia (NH3) Nitrate (NO3) Ortho- phosphate (O-PO4) Chloride (CL) Florid (F) Sulphate (SO4), Alkalinity (Alkal) Phenolics (Phenol)] were mea- sured according to the traditional manual methods [19]. Total Pb, Cu, Cr, Mn, Zn, Hg, Fe, Cd were measured after digestion using Graphite Furnace AA (GFAA) spectroscopy. A mixture of nitric acid and the material to be analysed was refluxed in a covered Griffin beaker. After the digestate has been brought to a low volume, it was cooled and brought up in dilute nitric acid (3% v/v). The sample was filtered, allowed settling and preparing it for analysis. It is to be noted that, the results obtained for most parameters in the river Nile water were relatively closed to each other; therefore the averages were calcu- lated by the end of the measurement period. 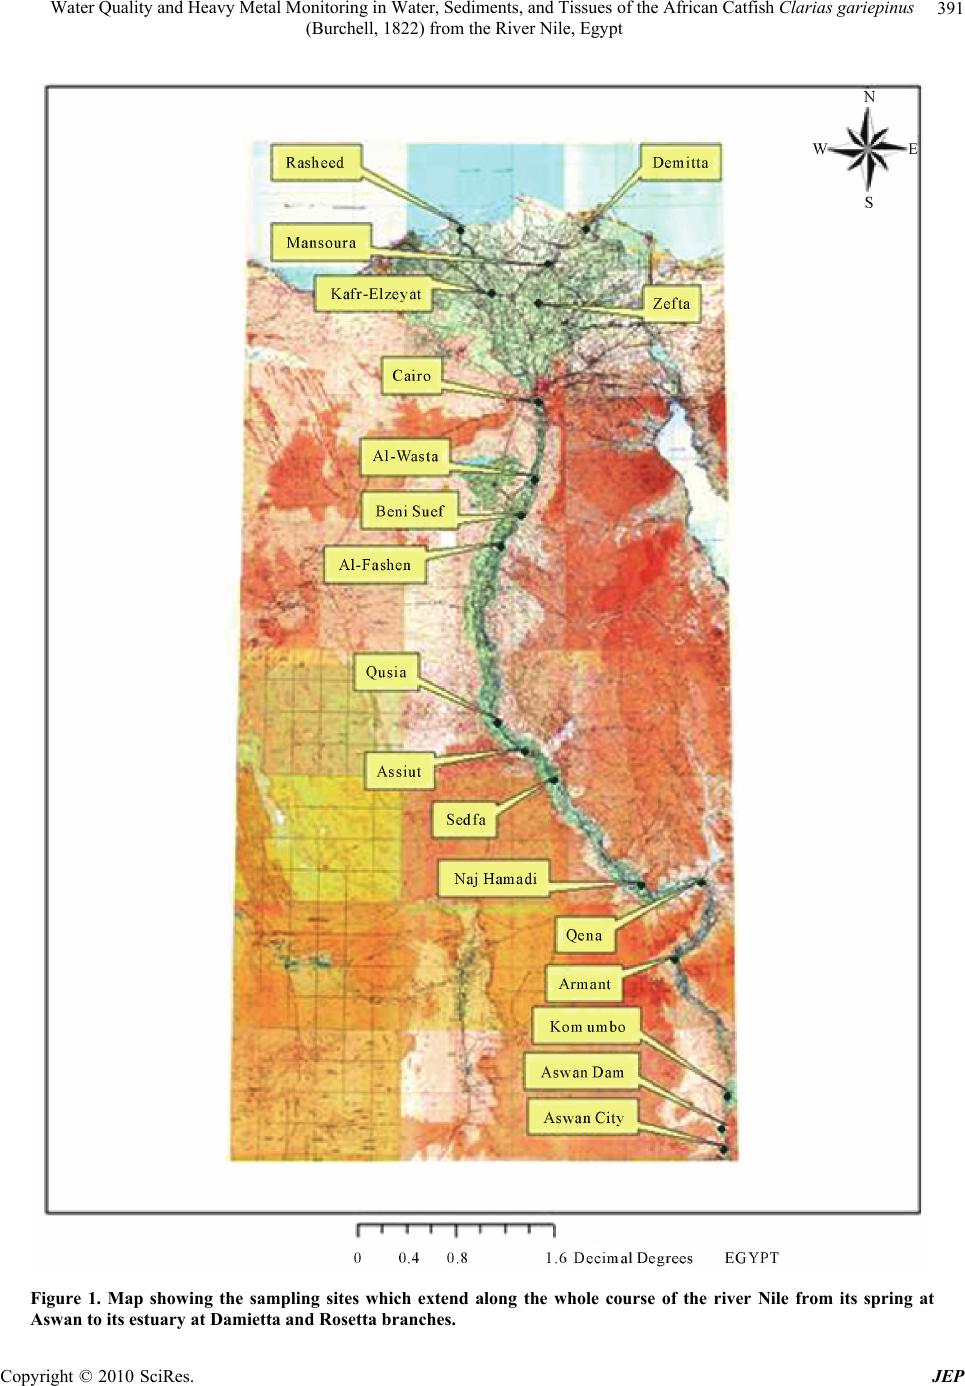 Water Quality and Heavy Metal Monitoring in Water, Sediments, and Tissues of the African Catfish Clarias gariepinus (Burchell, 1822) from the River Nile, Egypt Copyright © 2010 SciRes. JEP 391 Figure 1. Map showing the sampling sites which extend along the whole course of the river Nile from its spring at Aswan to its estuary at Damietta and Rosetta branches.  Water Quality and Heavy Metal Monitoring in Water, Sediments, and Tissues of the African Catfish Clarias gariepinus (Burchell, 1822) from the River Nile, Egypt Copyright © 2010 SciRes. JEP 392 2.3. Sediment Analysis Sediment samples from the selected sites were collected bimonthly from the main course of the river Nile during the period from July 2009 to June 2010. These were col- lected by using Ekman dredge and kept frozen until ana- lyzed. For total heavy metals, sediment samples were allowed to defrost, then air-dried in a circulating oven at 30°C and sieved mechanically using a 2 mm sieve. For the digestion of samples, 1 gram-sieved sediment was digested with repeated addition of nitric acid and hydro- gen peroxide. For Graphite Furnace AA (GFAA) analy- sis, the resultant digestate was reduced in volume and then diluted to a final volume of 100 mL. The elements of concern (Fe, Mn, Zn, Cu, Pb, Cr and Cd) in the sam- ples were determined by Atomic absorption spectropho- tometer (AAS). 2.4. Tissues Analysis Fresh fish samples (Clarias gariepinus) were collected by using long line or nets from the selected sites during the period from July 2009 to Jun 2010. Muscles, Gills, gonads and Liver were transported in liquid nitrogen container to the laboratory for chemical analysis. These organs were washed with tap water (previously analyzed for Pb and Cd) followed by bi-distilled water, then oven- dried to constant weight at 105℃. The dried fish was crushed and powdered in an agate mortar, then, they were kept in polyethylene bottles for analysis. One gram portions of fish tissues were digested by means of a mi- crowave after addition of nitric acid and hydrogen per- oxide. The results were calculated in milligram per kilo- gram wet weight (mg/kg wet wt). Chemicals concentra- tion were analysed according to German industrial stan- dard, DIN 38406-6, (DEV, E6) with an Atomic Absorp- tion Spectrometer using flame and graphite furnace tech- nique. 2.5. Statistical Analysis All values from chemical analyses were presented as mean ± SD. Data obtained from the experiment were subjected to one way analysis of variance (ANOVA) test using the Statistical Package for the Social Sciences [20]. The correlation coefficients between the quality parame- ter pairs of the water samples were calculated by the ap- plication of Pearson correlation analysis [20] in order to indicate the nature and the sources of the polluting sub- stances. 3. Results and Discussion 3.1. Water Analysis The results of means and SD of the studied physical and chemical parameters for water samples in the selected sex sites are given in Table 1. Because of its great impact on aquatic life, water tem- perature is an important component of a water quality assessment [7]. Temperature is a critical water quality parameter, since it directly influences the amount of dis- solved oxygen that is available to aquatic organisms [19]. Temperature affects the distribution, health, and survival of aquatic organisms. While temperature changes can cause mortality, it can also cause sub-lethal effects by altering the physiology of aquatic organisms [7]. Tem- peratures outside of an acceptable window affect the ability of aquatic organisms to grow, reproduce, escape predators, and compete for habitat. Water temperature showed a noticeable variation between different sites with a lowest value (22.7℃) recorded at Aswan and a highest one (25.3℃) at Damietta. Such variations be- tween different sites were mainly due to different sam- pling times. Conductivity is the ability of the water to conduct an electrical current, and is an indirect measure of the ion concentration [19]. The more ions present, the more electricity can be conducted by the water. The major salts that contribute to the measurement of conductivity are the positively charged ions calcium and magnesium. Other ions that contribute to conductivity to a smaller degree are sulfate, chloride, carbonate, bicarbonate, ni- trate, and phosphate [7]. Electrical conductivity showed lowest values at Aswan (0.24 mS·cm-1) and the highest value were recorded at Rosetta (0,63 mS·cm-1) followed by Damietta (0.53 mS·cm-1) with a remarkable increase from Aswan to Damietta and then Rosetta branch. Such increase may be due to the disposal of domestic and in- dustrial effluent in the water of Damietta and Rosetta branches. The pH measurement is one of the most important and frequently used tests in water chemistry (APHA, 1995). PH is a measure of the concentration of hydrogen ions in the water. This measurement indicates the acidity or al- kalinity of the water. Naturally occurring fresh waters have a pH range between 6 and 8. The pH of the water is important because it affects the solubility and availability of nutrients, and how they can be utilized by aquatic or- ganisms. According to the present results PH seems to be constant all over the river Nile. All the PH values were in alkaline side (7.8 to 8.4). The relatively lowest pH of some sites can be attributed to the discharge of effluents which loaded with a large amount of organic acids. Total solids (TS) are a measure of the amount of par- ticulate solids that are in solution. This is an indicator of nonpoint source pollution problems associated with various land use practices. They are the direct measure- 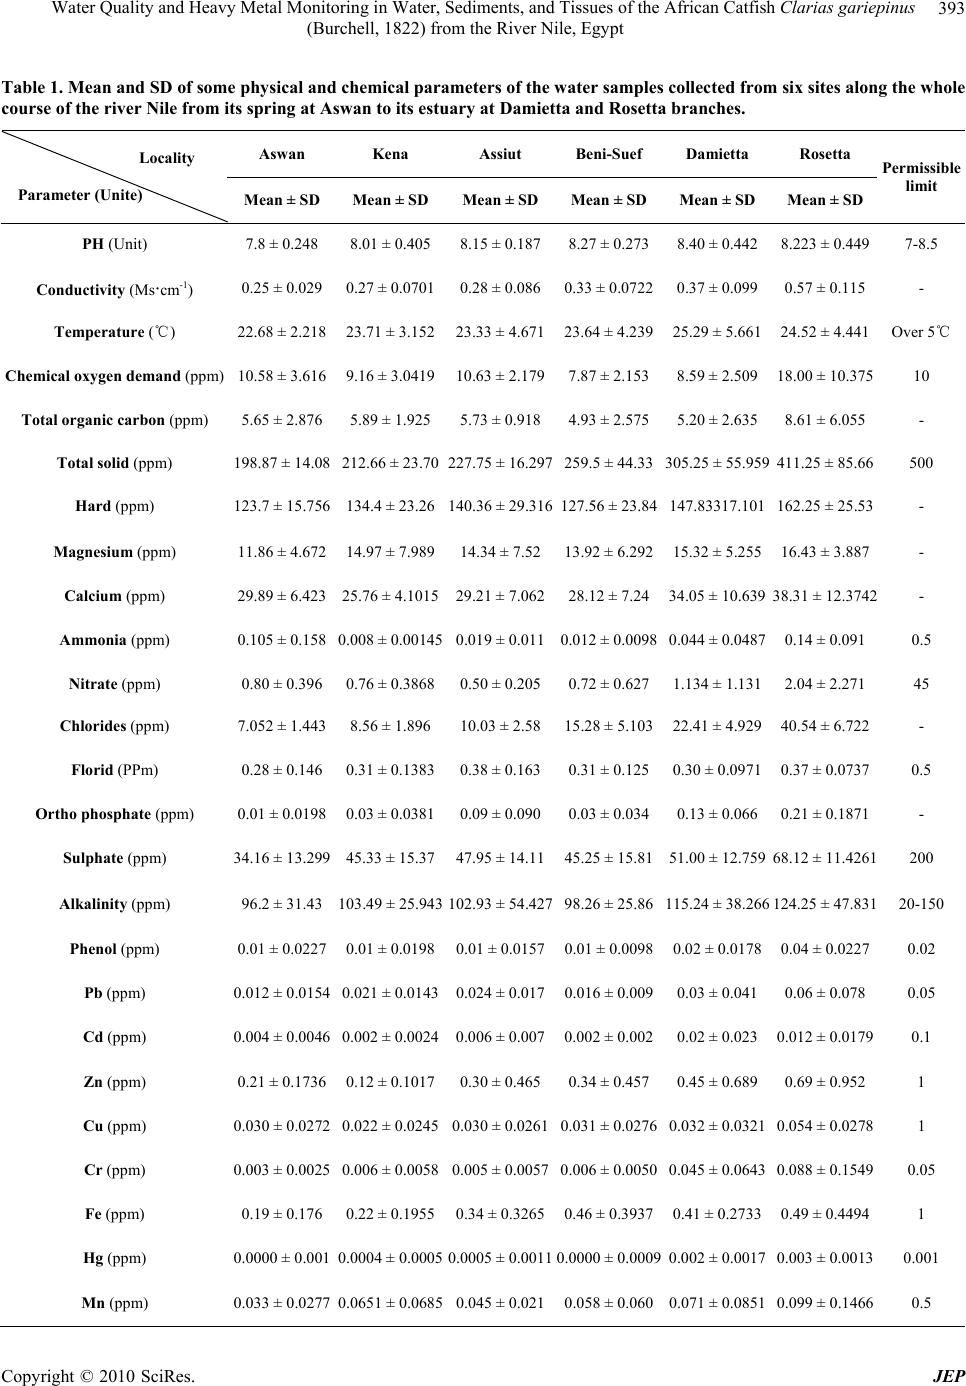 Water Quality and Heavy Metal Monitoring in Water, Sediments, and Tissues of the African Catfish Clarias gariepinus (Burchell, 1822) from the River Nile, Egypt Copyright © 2010 SciRes. JEP 393 Table 1. Mean and SD of some physical and chemical parameters of the water samples collected from six sites along the whole course of the river Nile from its spring at Aswan to its estuary at Damietta and Rosetta branches. Aswan Kena Assiut Beni-Suef Damietta Rosetta Locality Parameter (Unite) Mean ± SD Mean ± SDMean ± SD Mean ± SDMean ± SD Mean ± SD Permissible limit PH (Unit) 7.8 ± 0.248 8.01 ± 0.4058.15 ± 0.1878.27 ± 0.2738.40 ± 0.442 8.223 ± 0.449 7-8.5 Conductivity (Ms·cm-1) 0.25 ± 0.029 0.27 ± 0.07010.28 ± 0.0860.33 ± 0.07220.37 ± 0.099 0.57 ± 0.115 - Temperature (℃) 22.68 ± 2.218 23.71 ± 3.15223.33 ± 4.67123.64 ± 4.23925.29 ± 5.661 24.52 ± 4.441 Over 5℃ Chemical oxygen demand (ppm) 10.58 ± 3.616 9.16 ± 3.041910.63 ± 2.1797.87 ± 2.1538.59 ± 2.509 18.00 ± 10.37510 Total organic carbon (ppm) 5.65 ± 2.876 5.89 ± 1.9255.73 ± 0.9184.93 ± 2.5755.20 ± 2.635 8.61 ± 6.055 - Total solid (ppm) 198.87 ± 14.08 212.66 ± 23.70227.75 ± 16.297259.5 ± 44.33305.25 ± 55.959 411.25 ± 85.66500 Hard (ppm) 123.7 ± 15.756 134.4 ± 23.26140.36 ± 29.316127.56 ± 23.84147.83317.101 162.25 ± 25.53- Magnesium (ppm) 11.86 ± 4.672 14.97 ± 7.98914.34 ± 7.5213.92 ± 6.29215.32 ± 5.255 16.43 ± 3.887 - Calcium (ppm) 29.89 ± 6.423 25.76 ± 4.101529.21 ± 7.06228.12 ± 7.2434.05 ± 10.639 38.31 ± 12.3742- Ammonia (pp m) 0.105 ± 0.158 0.008 ± 0.001450.019 ± 0.0110.012 ± 0.00980.044 ± 0.0487 0.14 ± 0.091 0.5 Nitrate (ppm) 0.80 ± 0.396 0.76 ± 0.38680.50 ± 0.2050.72 ± 0.6271.134 ± 1.131 2.04 ± 2.271 45 Chlorides (ppm) 7.052 ± 1.443 8.56 ± 1.89610.03 ± 2.5815.28 ± 5.10322.41 ± 4.929 40.54 ± 6.722 - Florid (PPm) 0.28 ± 0.146 0.31 ± 0.13830.38 ± 0.1630.31 ± 0.1250.30 ± 0.0971 0.37 ± 0.0737 0.5 Ortho phosphate (ppm) 0.01 ± 0.0198 0.03 ± 0.03810.09 ± 0.0900.03 ± 0.0340.13 ± 0.066 0.21 ± 0.1871 - Sulphate (ppm) 34.16 ± 13.299 45.33 ± 15.3747.95 ± 14.1145.25 ± 15.8151.00 ± 12.759 68.12 ± 11.4261200 Alkalinity (ppm) 96.2 ± 31.43 103.49 ± 25.943102.93 ± 54.42798.26 ± 25.86115.24 ± 38.266 124.25 ± 47.83120-150 Phenol (ppm) 0.01 ± 0.0227 0.01 ± 0.01980.01 ± 0.01570.01 ± 0.00980.02 ± 0.0178 0.04 ± 0.0227 0.02 Pb (ppm) 0.012 ± 0.0154 0.021 ± 0.01430.024 ± 0.0170.016 ± 0.0090.03 ± 0.041 0.06 ± 0.078 0.05 Cd (ppm) 0.004 ± 0.0046 0.002 ± 0.00240.006 ± 0.0070.002 ± 0.0020.02 ± 0.023 0.012 ± 0.01790.1 Zn (pp m) 0.21 ± 0.1736 0.12 ± 0.10170.30 ± 0.4650.34 ± 0.4570.45 ± 0.689 0.69 ± 0.952 1 Cu (ppm) 0.030 ± 0.0272 0.022 ± 0.02450.030 ± 0.02610.031 ± 0.02760.032 ± 0.0321 0.054 ± 0.02781 Cr (ppm) 0.003 ± 0.0025 0.006 ± 0.00580.005 ± 0.00570.006 ± 0.00500.045 ± 0.0643 0.088 ± 0.15490.05 Fe (ppm) 0.19 ± 0.176 0.22 ± 0.19550.34 ± 0.32650.46 ± 0.39370.41 ± 0.2733 0.49 ± 0.4494 1 Hg (ppm) 0.0000 ± 0.001 0.0004 ± 0.00050.0005 ± 0.00110.0000 ± 0.00090.002 ± 0.0017 0.003 ± 0.00130.001 Mn (ppm) 0.033 ± 0.0277 0.0651 ± 0.06850.045 ± 0.0210.058 ± 0.0600.071 ± 0.0851 0.099 ± 0.14660.5  Water Quality and Heavy Metal Monitoring in Water, Sediments, and Tissues of the African Catfish Clarias gariepinus (Burchell, 1822) from the River Nile, Egypt Copyright © 2010 SciRes. JEP 394 ment of particle concentration that quantifies the diffrac- tion of light caused by particles in the water [7]. TS con- centrations have been recommended by the US EPA as useful indicators of water quality and are important measurements for a number of reasons. Increased TS are frequently indicators of erosion. This fine material can clog the gills of fish and serve as a carrier of pollutants and pathogens. Total solid showed a significant (P < 0.05) increase from Aswan to Damietta and Rosetta. The low- est value of TS was recorded at Aswan (198.8 ppm). The highest values were recorded at Rosetta (411.25 ppm) (Table 1). The increase in TS values in the water of Da- mietta and Rosetta branches are probably due to the phytoplankton blooming which always associated with lower level of dissolved oxygen. The chemical oxygen demand (COD) is used as a measure of oxygen equivalent of the organic matter con- tent of a sample that is susceptible to oxidation by strong chemical oxidants. The chemical oxygen demand (COD) and total organic compounds (TOC) showed a remark- able fluctuation with a slight increase from Aswan to Rosetta (Table 1). The lowest value of COD and TOC were recorded at Beni-Suef (7.87 and 4.9 ppm respec- tively). The highest values of both parameters were de- tected at Rosetta (Table 1). The value of COD in Rosetta branch, Assiut and Aswan was higher than the permissi- ble limits. This increase was due to the presence of higher organic matter concentration in theses areas. This may be due to the discharge of industrial effluents into the Nile by some non-compliant factories in these areas, in addition to the discharge of municipal wastewater (un- treated and detergent-carrying wastewater) and other wastes into the river. Water hardness was understood to be a measure of the capacity of water to precipitate soap. Soap is predicated chiefly by the calcium and magnesium ions present [7]. Water hardness was slightly increased from Aswan to Rosetta and Damietta recording the highest value at Rosetta (162.3 ppm) (Table 1). Table 1 shows that Ca and Mg nearly have the same distribution as water hard- ness. The concentrations of magnesium showed low val- ues (11.8-16.4 ppm) comparing to calcium concentra- tions (2.7-38.3 ppm) (Table 1). The fluoride ion is necessary for teeth health. So it is very important to keep its concentration in drinking wa- ter between 0,8 and 1,00 ppm. The detected concentra- tions of fluoride are still lower than the required limits in all sites ranging from 0.28 to 0.37 ppm. So it is not rec- ommended to use this water directly as a drinking water. We have to add the fluoride to the optimum levels (0,8-1.00 ppm) for dental health. According to the pre- sent results fluoride did not have a specific trend of in- crease or decrease. It fluctuated from Aswan to Damietta recorded the lowest value at Aswan and the highest one at Assiut (Table 1). This increase was due to the pres- ence of phosphate fertilizer factories in this site. Chloride is the most common inorganic anion found in water and wastewater. High chloride content may indicate pollution by sewage or industrial wastes. The distribution of (Cl) was similar to those of the cations (Ca and Mg) showing a minor increase from Aswan to Damietta and Rosetta (Table 1). Nitrate and ammonia are the most common forms of nitrogen in aquatic systems [19]. Ammonia is excreted by animals and produced during decomposition of plants and animals, thus returning nitrogen to the aquatic sys- tem. It is also one of the most important pollutants caus- ing lower reproduction and growth. Ammonia can easily pass through the membranes of the gills, causing nervous system toxicity and even death. Ammonia was recorded in a very low concentration in all sites (Table 1) re- cording the highest value at Rosetta (0.14 ppm). Nitrate is often the limiting element restricting biological pro- ductivity of Nile water [7]. The values of nitrate fluctu- ated within a wide range and showed low levels during the whole period of investigation (Table 1). The highest value of Nitrate was recorded at Rosetta. Higher concen- tration of nitrate in water of Rosetta branch can create a large oxygen demand and cause algae to grow in large quantity. Dead algae can cause oxygen depletion prob- lems which in turn can kill fishes and other aquatic or- ganisms. This result also can explain the detection of the higher concentration of orthophosphate in the water of Rosetta and Damietta branches. Orthophosphate is gen- erally considered to be the primary nutrient limiting algal and plant growth in fresh waters. Orthophosphate (O-PO4) was detected in low values especially in the upper Egyptian sites (Aswan and Kena). The highest concentrations were detected at Rosetta (0.21 ppm) fol- lowed by Damietta (0.13 ppm) (Table 1). Alkalinity of water is its acid-neutralizing capacity. It is the sum of all titratable bases [19]. It is taken as an indication of the concentration of carbonate, bicarbonate and hydroxide content in water. Alkalinity was fluctuated within a very narrow ranges recording highest values at Rosetta (124.3 ppm) followed by Damietta (115.2 ppm). The concentrations of phenolics were recoded in very low values in all sites recording the lowest value at As- siut and Beni-Suef (0.01 ppm). The highest concentration of phenolics was recorded at Rosetta (0.04 ppm) (Table 1). The concentration of phenolics was higher than the permissible limits in Rosetta and Damietta branches. Heavy metals enter rivers and lakes from a variety of sources. The rocks and soils directly exposed to surface  Water Quality and Heavy Metal Monitoring in Water, Sediments, and Tissues of the African Catfish Clarias gariepinus (Burchell, 1822) from the River Nile, Egypt Copyright © 2010 SciRes. JEP 395 water are the largest natural sources [19]. In addition to, the discharge of various treated and untreated liquid wastes to the water body can introduce large amounts of trace metals for rivers. Total trace metals exhibited dif- ferent behavior, with constant or increasing concentra- tions up river. Pb values were fluctuated within a narrow range (0.01 to 0.06 ppm) and it was very low in all Upper Egyptian sites ranging from 0.01 to 0.02 (Table 1). The highest values were recorded in the water of Rosetta (0.06 ppm). The lead concentration was higher than the permissible limit in the water of Rosetta Branch. Cd ex- hibited a wide range of variation between 0.002 and 0.02 ppm (Table 1). The highest value was recorded at Dami- etta (0.02 ppm). Down stream sites recording a very high Cd concentration comparing to the up stream sites (Ta- ble 1). The cadmium level was higher than the permissi- ble limits in Rosetta and Damietta branches. Zinc con- centrations fluctuated between 0.12 and 0.69 ppm. The maximum values were recorded at Rosetta (Table 1). Copper concentration ranged from 0.02 to 0,05 ppm (Table 1). The lowest concentration of Cr was recorded at Aswan (0.003 ppm) and the highest one was recorded at Rosetta (0.088 ppm). The chromium in the Rosetta branch was higher than the permissible limit. Fe recorded the highest values at Rosetta (0.46 ppm) and the lowest value at Aswan (0.19 ppm) (Table 1). Hg seems to be very rare in the Egyptian river Nile water and it was re- corded only in some sites along the river Nile (Table 1). The concentration of Mercury was higher the permissible limits in the Rosetta and Damietta branches. Mn concen- trations ranged from 0.033 ppm to 0.099 ppm. It showed a slight increase from upto downstream sites. The maxi- mum value was recorded at Rosetta (0.14 ppm) (Table 1). Generally, the increase in heavy metals concentrations in the Nile water might be attributed to the direct inputs from different sources (industrial wastes and atmospheric inflow of dust containing car exhaust). In addition, the increase in density of boats and ship, which discharge its effluent directly to the Nile containing high amount of Pb in both the dissolved and particular phases [21,22]. 3.2. Sediments Analysis Results of heavy metal analysis of sediments from the selected sites are presented in Table 2. The sediment existing at the bottom of the water column plays a major role in the pollution scheme of the river system by heavy metals [23]. They reflect the current quality of the water system and can be used to detect the presence of con- taminant that does not remain soluble after discharge into water. The concentrations of the selected heavy metals in sediments samples were very high in all sites comparing to the concentration of the same heavy metals in water samples from same sites. Low-level discharges of a con- taminant may meet the water quality criteria, but long- term partitioning to the sediments could result in the ac- cumulation of high loads of pollutants [24]. Therefore, the determination of heavy metals in the sediments is fundamental to realize the toxic pollutants in the river sediment [25]. The concentrations of lead (Pb) exhibited a wide range of variation ranging from 3.1 to 76.9 mg/kg. Pb was very low in the sediment of Aswan and Kena comparing to its concentration in the sediment of Dami- etta and Rosetta (Table 2). The concentration of lead was higher than the permissible limit in Rosetta Branch. Cadmium (Cd) exhibited narrow range of variation ranging from 0.4 to 0.7 mg/kg. The lowest concentration was recorded at Aswan and the highest one was recorded at Damietta and Rosetta. In general the concentrations of Cd were fluctuated between sites but they still showed slightly increased from Aswan toward Damietta and Rosetta (Table 2). The level of Cadmium was higher than the permissible limit in all sites except in the sedi- ment of Aswan and Kena. Copper (Cu) and Chromium (Cr) exhibited a wide range of variation ranging from 0.03 to 0.05 mg/kg for Cu and from 8.8 to 17.6 mg/kg for Cr. The highest con- centration for Cu was recorded in the sediment of Rosetta and the lowest one was recorded in the sediment of Kena. For Cr the highest concentration was recorded at Assiut and lowest one was recorded at Rosetta (Table 2). Man- ganese (Mn) and Zinc (Zn) concentrations represented the second highest metals in the sediment after iron. They nearly had the same concentration and the same distribution (Table 2). Such concentrations were ranged from 139.8 to 351.8 mg/kg for Mn and from 91.5 to 307 mg/kg for Zn. The concentration of the Zinc was higher than the permissible limits in Rosetta and Damietta branch and also in Beni-Suef. Fe showed higher values at all sites comparing to other heavy metals ranging from 379.4 to 698.7 mg/kg, indicating that this metal is natu- rally high in the sediments. Hg was recorded in very low concentrations through the whole course of the river Nile and it was completely not detected in the sediment at Aswan (Table 2). Such concentrations seem to be con- stant in all sites. The wide ranges of metal concentrations which recorded for some heavy metals may be attributed to variations in mud percent and increase in heavy metals rich urban effluents draining into river. 3.3. Tissues Analysis Table 3 shows the mean and SD values of the tested heavy metals in African catfish organs. Knowledge of 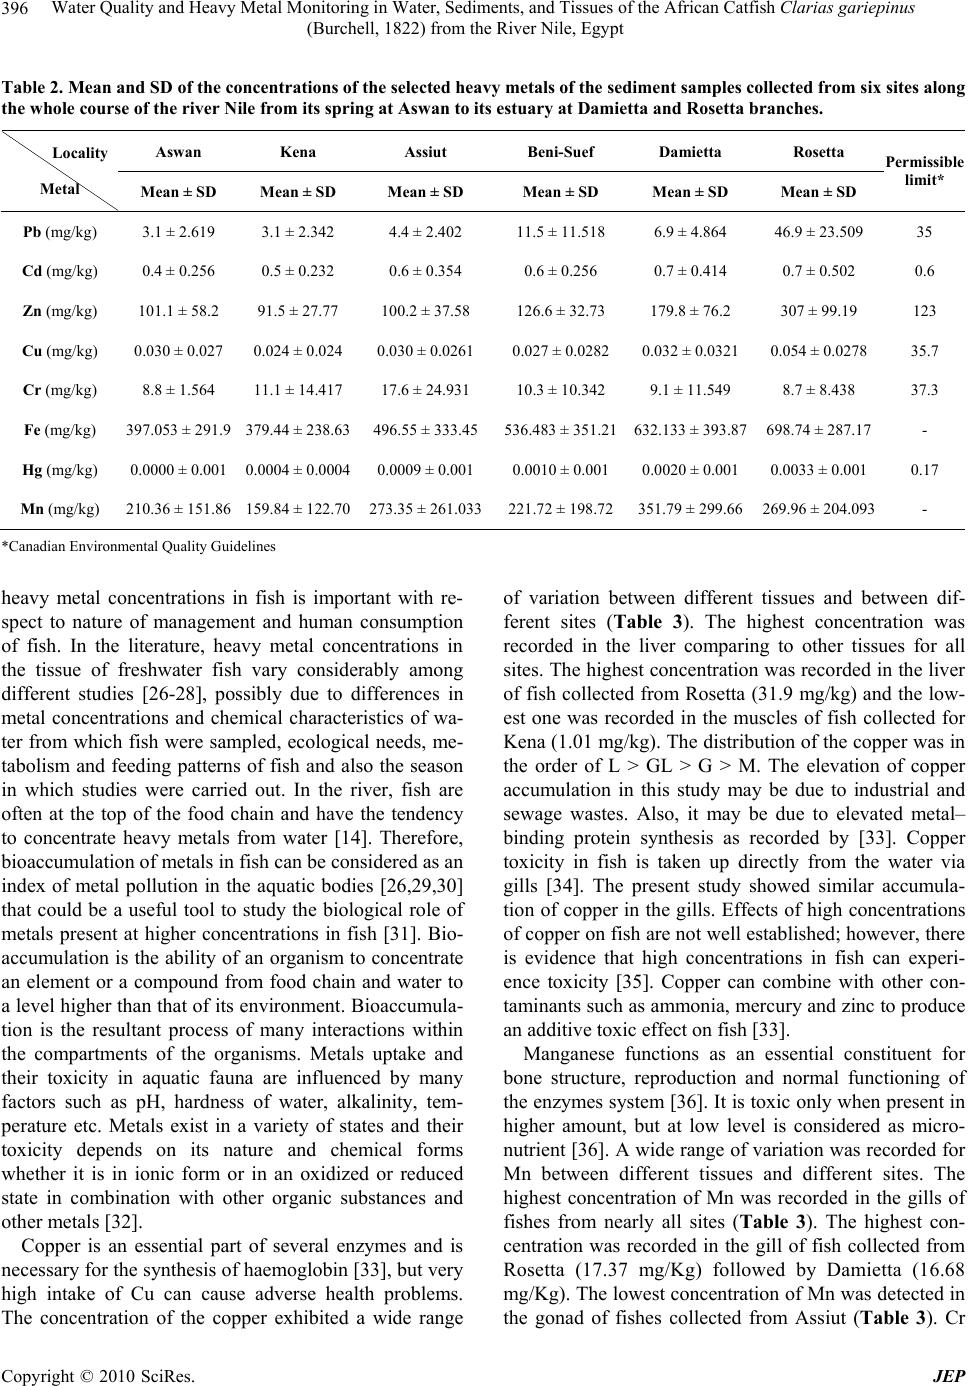 Water Quality and Heavy Metal Monitoring in Water, Sediments, and Tissues of the African Catfish Clarias gariepinus (Burchell, 1822) from the River Nile, Egypt Copyright © 2010 SciRes. JEP 396 Table 2. Mean and SD of the concentrations of the selected heavy metals of the sediment samples collected from six sites along the whole course of the river Nile from its spring at Aswan to its estuary at Damietta and Rosetta branches. Aswan Kena Assiut Beni-Suef Damietta Rosetta Locality Metal Mean ± SD Mean ± SD Mean ± SD Mean ± SD Mean ± SD Mean ± SD Permissible limit* Pb (mg/kg) 3.1 ± 2.619 3.1 ± 2.342 4.4 ± 2.402 11.5 ± 11.518 6.9 ± 4.864 46.9 ± 23.509 35 Cd (mg/kg) 0.4 ± 0.256 0.5 ± 0.232 0.6 ± 0.354 0.6 ± 0.256 0.7 ± 0.414 0.7 ± 0.502 0.6 Zn (mg/kg) 101.1 ± 58.2 91.5 ± 27.77 100.2 ± 37.58 126.6 ± 32.73 179.8 ± 76.2 307 ± 99.19 123 Cu (mg/kg) 0.030 ± 0.027 0.024 ± 0.024 0.030 ± 0.0261 0.027 ± 0.0282 0.032 ± 0.0321 0.054 ± 0.0278 35.7 Cr (mg/kg) 8.8 ± 1.564 11.1 ± 14.417 17.6 ± 24.931 10.3 ± 10.342 9.1 ± 11.549 8.7 ± 8.438 37.3 Fe (mg/kg) 397.053 ± 291.9 379.44 ± 238.63 496.55 ± 333.45 536.483 ± 351.21632.133 ± 393.87 698.74 ± 287.17- Hg (mg/kg) 0.0000 ± 0.001 0.0004 ± 0.0004 0.0009 ± 0.001 0.0010 ± 0.001 0.0020 ± 0.001 0.0033 ± 0.001 0.17 Mn (mg/kg) 210.36 ± 151.86 159.84 ± 122.70 273.35 ± 261.033221.72 ± 198.72351.79 ± 299.66 269.96 ± 204.093- *Canadian Environmental Quality Guidelines heavy metal concentrations in fish is important with re- spect to nature of management and human consumption of fish. In the literature, heavy metal concentrations in the tissue of freshwater fish vary considerably among different studies [26-28], possibly due to differences in metal concentrations and chemical characteristics of wa- ter from which fish were sampled, ecological needs, me- tabolism and feeding patterns of fish and also the season in which studies were carried out. In the river, fish are often at the top of the food chain and have the tendency to concentrate heavy metals from water [14]. Therefore, bioaccumulation of metals in fish can be considered as an index of metal pollution in the aquatic bodies [26,29,30] that could be a useful tool to study the biological role of metals present at higher concentrations in fish [31]. Bio- accumulation is the ability of an organism to concentrate an element or a compound from food chain and water to a level higher than that of its environment. Bioaccumula- tion is the resultant process of many interactions within the compartments of the organisms. Metals uptake and their toxicity in aquatic fauna are influenced by many factors such as pH, hardness of water, alkalinity, tem- perature etc. Metals exist in a variety of states and their toxicity depends on its nature and chemical forms whether it is in ionic form or in an oxidized or reduced state in combination with other organic substances and other metals [32]. Copper is an essential part of several enzymes and is necessary for the synthesis of haemoglobin [33], but very high intake of Cu can cause adverse health problems. The concentration of the copper exhibited a wide range of variation between different tissues and between dif- ferent sites (Table 3). The highest concentration was recorded in the liver comparing to other tissues for all sites. The highest concentration was recorded in the liver of fish collected from Rosetta (31.9 mg/kg) and the low- est one was recorded in the muscles of fish collected for Kena (1.01 mg/kg). The distribution of the copper was in the order of L > GL > G > M. The elevation of copper accumulation in this study may be due to industrial and sewage wastes. Also, it may be due to elevated metal– binding protein synthesis as recorded by [33]. Copper toxicity in fish is taken up directly from the water via gills [34]. The present study showed similar accumula- tion of copper in the gills. Effects of high concentrations of copper on fish are not well established; however, there is evidence that high concentrations in fish can experi- ence toxicity [35]. Copper can combine with other con- taminants such as ammonia, mercury and zinc to produce an additive toxic effect on fish [33]. Manganese functions as an essential constituent for bone structure, reproduction and normal functioning of the enzymes system [36]. It is toxic only when present in higher amount, but at low level is considered as micro- nutrient [36]. A wide range of variation was recorded for Mn between different tissues and different sites. The highest concentration of Mn was recorded in the gills of fishes from nearly all sites (Table 3). The highest con- centration was recorded in the gill of fish collected from Rosetta (17.37 mg/Kg) followed by Damietta (16.68 mg/Kg). The lowest concentration of Mn was detected in the gonad of fishes collected from Assiut (Table 3). Cr  Water Quality and Heavy Metal Monitoring in Water, Sediments, and Tissues of the African Catfish Clarias gariepinus (Burchell, 1822) from the River Nile, Egypt Copyright © 2010 SciRes. JEP 397 Table 3. Mean and SD of the concentration of the selected heavy metals in different tissues of the African catfish Clarias gariepinus collected from six sites along the whole course of the river Nile from its spring at Aswan to its estuary at Damitta and Rosetta branches. Aswan Kena Assiut Beni-Suef Damietta Rosetta Parameters Localities Organs Mean ± SD Mean ± SD Mean ± SD Mean ± SD Mean ± SD Mean ± SD Liver 10.64 ± 2.49 5.50 ± 4.34 6.51 ± 2.35 11.25 ± 0.68 5.08 ± 2.05 31.92 ± 11.19 Gills 4.14 ± 2.81 3.22 ± 3.04 5.08 ± 4.02 4.19 ± 4.15 3.65 ± 4.31 9.631 ± 2.91 Gonads 2.85 ± 1.93 2.79 ± 0.35 4.49 ± 1.87 8.15 ± 1.62 1.81 ± 1.34 6.02 ± 1.45 Cu (mg/kg) Muscles 3.75 ± 2.98 1.01 ± 0.42 3.70 ± 2.51 3.90 ± 2.68 4.19 ± 4.06 5.48 ± 0.71 Pattern L > GL > M > G L > GL > G > ML > GL > G > ML > G > GL > ML > M > GL > G L > GL > G > M Liver 5.45 ± 3.05 7.71 ± 2.21 12.94 ± 8.37 3.84 ± 3.077 15.98 ± 6.67 15.43 ± 5.89 Gills 7.59 ± 1.93 10.15 ± 3.493 12.67 ± 8.26 7.42 ± 5.03 16.68 ± 2.517 17.37 ± 4.91 Gonads 8.18 ± 2.25 5.51 ± 1.49 3.38 ± 1.83 5.96 ± 3.34 5.406 ± 1.68 13.857 ± 3.089 Mn (mg/kg) Muscles 4.79 ± 2.96 7.57 ± 4.85 5.223 ± 3.612 4.27 ± 4.09 14.14 ± 1.85 14.796 ± 4.12 Pattern G > GL > L > M GL > L > M > GL > GL > M > GGL > G > M > LGL > L > M > G GL > L > M > G Liver 6.59 ± 1.357 8.51 ± 1.866 5.32 ± 3.75 3.74 ± 4.29 5.37 ± 0.963 6.99 ± 1.74 Gills 6.51 ± 1.34 6.72 ± 1.17 4.37 ± 3.579 4.29 ± 3.7 4.22 ± 1.77 8.46 ± 3.33 Gonads 5.63 ± 2.38 6.11 ± 2.89 5.24 ± 3.32 6.28 ± 8.35 2.38 ± 1.1 6.32 ± 1.59 Cr (mg/kg) Muscles 2.37 ± 0.823 4.97 ± 2.71 4.50 ± 3.8 4.83 ± 3.477 3.84 ± 1.75 5.47 ± 1.79 Pattern L > GL > G > M L > GL > G > ML > G > M > GLG > M > GL > LL > GL > M > G GL > L > G > M Liver 42.48 ± 14.74 65.09 ± 3.88 58.59 ± 15.24 55.29 ± 27.06138.98 ± 23.44 178.84 ± 20.94 Gills 35.38 ± 7.59 20.65 ± 1.62 56.39 ± 12.51 30.36 ± 17.46109.8 ± 83.69 112.13 ± 58.89 Gonads 30.69 ± 12.7 19.43 ± 22.48 44.27 ± 8.52 28.39 ± 4.45 83.28 ± 28.35 78.59 ± 13.97 Zn (mg/kg) Muscles 32.57 ± 10.79 11.62 ± 6.917 51.224 ± 12.1547.32 ± 7.54 71.85 ± 25.89 62.49 ± 36.3 Pattern L > GL > M > G L > GL > G > ML > GL > M > GL > M > GL > GL > GL > G > M L > GL > G > M Liver 13.8 ± 3.50 9.45 ± 4.92 6.1 ± 2.78 5.51 ± 2.52 15.32 ± 2.01 20.73 ± 8.48 Gills 7.31 ± 2.04 7.59 ± 2.74 5.60 ± 4.54 7.286 ± 9.84 14.61 ± 4.49 22.57 ± 8.13 Gonads 8.06 ± 3.17 9.29 ± 5.79 5.84 ± 3.2 1.89 ± 1.77 13.96 ± .72 12.17 ± 6.75 Pb (mg/kg) Muscles 7.11 ± 4.71 7.48 ± 1.97 5.895 ± 3.96 6.72 ± 4.42 14.51 ± 2.00 14.10 ± 4.93 Pattern L > G > GL > M L > G > GL > ML > M > G > GLGL > M > L > GL > GL > M > G L > GL > M > G Liver 4.92 ± 0.36 0.89 ± 0.06 0.57 ± 0.28 0.79 ± 0.23 1.09 ± 0.47 1.10 ± 0.54 Gills 0.62 ± 0.19 0.77 ± 0.1 0.71 ± 0.24 0.43 ± 0.17 0.90 ± 0.60 0.60 ± 0.13 Gonads 0.28 ± 0.16 0.62 ± 0.14 0.53 ± 0.34 0.52 ± 0.27 0.88 ± 0.15 0.76 ± 0.33 Cd (mg/kg) Muscles 0.66 ± 0.06 0.49 ± 0.108 0.20 ± 0.058 0.354 ± 0.28 0.78 ± 0.32 0.55 ± 0.19 Pattern L > M > GL > G L > GL > G > MGL > L > G > ML > G > GL > ML > GL > G > M L > G > GL > M Liver 51.72 ± 12.11 62.42 ± 8.51 52.54 ± 4.82 109.82 ± 11.197110.85 ± 13.99 115.08 ± 17.77 Gills 49.55 ± 6.13 44.04 ± 9.62 40.19 ± 7.02 91.43 ± 17.4478.71 ± 25.24 83.39 ± 39.21 Gonads 38.66 ± 6.44 47.24 ± 10.76 44.12 ± 7.17 83.99 ± 23.7655.13 ± 30.94 76.26 ± 21.92 Fe (mg/kg) Muscles 26.49 ± 2.45 38.09 ± 6.75 27.67 ± 6.52 85.29 ± 11.7766.84 ± 22.51 80.59 ± 20.31 Pattern L > GL > G > M L > G > GL > ML > G > GL > ML > GL > G > ML > GL > M > G L > GL > M > G Liver 0.0012 ± 0.0011 0.0016 ± 0.000840.008 ± 0.014 0.0099 ± 0.00830.019 ± 0.023 0.069 ± 0.11 Gills 0.00042 ± 0.00057 0.00088 ± 0.0010.004 ± 0.006 0.0051 ± 0.00440.015 ± 0.019 0.029 ± 0.015 Gonads 0.00017 ± 0.00018 0.00021 ± 0.000290.0011 ± 0.00060.0046 ± 0.00450.013 ± 0.022 0.008 ± 0.0049 Hg (mg/kg) Muscles 0.00087 ± 0.00087 0.00017 ± 0.000110.00067 ± 0.000690.0012 ± 0.00150.0046 ± 0.0065 0.015 ± 0.0054 Pattern L > M > GL > M L > GL > G > ML > GL > M > GL > GL > G > ML > GL > G > M L > GL > M > G  Water Quality and Heavy Metal Monitoring in Water, Sediments, and Tissues of the African Catfish Clarias gariepinus (Burchell, 1822) from the River Nile, Egypt Copyright © 2010 SciRes. JEP 398 has a special pattern of distribution among tissues and sites. The highest level of Cr was detected in the liver of fish collected from Kena and the lowest concentration was recorded in the muscles of fishes collected from Aswan (Table 3). Zinc is an essential element and is a common pollutant as well. Mining smelting and sewage disposal are major source of zinc pollution. Fish take it up directly from water, especially by mucous and gills [36]. The relatively higher zinc concentration in the liver of the different fish species may be due to the role of zinc as an activator of numerous enzymes present in the liver [33]. Zn was ac- cumulated mainly in the liver of fishes collected from all sites. Such results were previously reported by [37]. The highest level was recorded in the liver of fishes collected from Rosetta followed by Damietta (Table 3). Lead is non-essential element and higher concentra- tions can occur in aquatic organisms close to anthropo- genic sources. It is toxic even at low concentrations and has no known function in biochemical processes [36]. In all sites except Beni-Suef the highest lead level was de- tected in the liver of C. gariepinus followed by gills. The highest concentration was recorded in the tissues of fishes collected from Rosetta followed by Damietta. In contrast to the present results, [37] reported the gill as highly Pb-accomulated organ in C. gariepinus. Lead was found to inhibit the impulse conductivity by inhibiting the activities of monoamine oxidase and acetylcholine esterase to cause pathological changes in tissue and or- gans. The increase of lead level is due to the discharge of industrial, sewage and agricultural wastes in the investi- gated area. The high level of lead may be attributed to high lead concentration in water [38]. According to the present result the Cd accumulated mainly in the liver followed by gills of fishes collected from the selected sites. The highest concentration was detected in liver of fish collected from Aswan. Cd is highly toxic non-essential heavy metal and it dose not have a role in biological processes in living organisms. Thus even in low concentration, Cd could be harmful to fishes. High accumulation of cadmium in liver may be due to its strong binding with cystine residues of metal- lothionein [38]. With different magnitude the Fe and Hg accumulated mainly in the liver of fishes collected from all sites. The highest concentrations of both metals were recorded in the tissues of fishes collected from Rosetta followed by Damietta. Iron is an abundant and important element, unsurpassed by any other heavy metals in the earth’s crust [36]. The increase of iron accumulation in fish liver in this study may be related to the increase of total dis- solved iron in Nile water and consequently increase the free metal iron concentration and thereby lead to an in- crease in metal uptake by different organs [38]. [33] ob- served accumulation of iron ligand protein (Hemosidrin) scattered in liver section of fish exposed to high iron concentration. Trace metals accumulations in fish liver at sites under investigation were detected in following de- scending order: Zn > Fe > Cu > Pb > Mn > Cr> Cd > Hg. In the gill tissues these metals were accumulated in the following order Fe > Zn > Mn > Pb > Cr > Cu > Cd> Hg. The lower concentration of Cu in the gill than that of livers was possibly due to lower binding affinity of Cu on the gill surface. Gills which are in direct contact with water accumulated some amount of heavy metals. The accumulation of such metals in the gills may be due to adsorption to the gill surfaces and dependent on the availability of proteins to which these metals may bind. The low accumulation may be due to development of some defensive mechanism such as excessive mucous secretion and clogging of gills. Gonad and muscle were found to accumulate small amounts of most heavy metals and might have received it through circulation. It is sug- gested that the low accumulation of metals in gonad and muscle may be due to lack of binding affinity of these metals with the proteins of gonad and muscle. This is particularly important because muscles contribute the greatest mass of the flesh that is consumed as food. 4. Conclusions Higher mean value of conductivity, alkalinity, COD, NH3, NO3, TS, SO4, Cl, orthophosphate and trace metals in the water, sediments and fish tissues collected from Damietta and Rosetta sites comparing to the other sites prove the presence of large quantities of organic and in- organic pollutants in Rosetta and Damietta water. This was expected due to the fact that the water of such branches receives high concentrations of organic and inorganic pollutants from industrial, domestic as well as diffuse agricultural wastewater [38]. The heavy metal residues in the tissues of Clarias gariepinus exhibited dif- ferent patterns of accumulation and distribution among the selected tissues and localities. In fish, gills are considered to be the dominant site for contaminant uptake because of their anatomical and/or physiological properties that maximize absorption efficiency from water [39]. How- ever, it was evident from our study that, liver was the site of maximum accumulation for the elements while muscle was the over all site of least metal accumulation. The higher levels of trace elements in liver relative to other tissues may be attributed to the affinity or strong coordi- nation of metallothionein protein with these elements [40].  Water Quality and Heavy Metal Monitoring in Water, Sediments, and Tissues of the African Catfish Clarias gariepinus (Burchell, 1822) from the River Nile, Egypt Copyright © 2010 SciRes. JEP 399 5. Acknowledgements This work was supported by Science and Technology development fund (Project ID 448). I would like to thank Mr. K. AbEl-Fadel, A. Gad El-Rab, M. Nassar, and A. Moustafa for their support during sampling and analysis processes. REFERENCES [1] M. Ali and M. Soltan, “The Impact of Three Industrial Effluents on Submerged Aquatic Plants in the River Nile, Egypt,” Hydrobiologia, Vol. 340, No. 1-3, 1996, pp. 77- 83. [2] R. Handy, “Intermittent Exposure to Aquatic Pollutants Assessment, Toxicity and Sublethal Responses in Fish and Invertebrates,” Comparative Biochemistry and Physi- ology C-Pharmacology Toxicology & Endocrinology, Vol. 107, No. 2, 1994, pp. 171-184. [3] A. Osman, “Embryo-Toxic Effects of Lead Nitrate of the African Catfish Clarias Gariepinus (Burchell, 1822),” PhD Thesis, Humboldt-University, Berlin, 2007. [4] M. Ali and M. Soltan, “The Impact of Three Industrial Effluents on Submerged Aquatic Plants in the River Nile, Egypt,” Hydrobiologia, Vol. 340, No. 1-3, 1996, pp. 77-83. [5] W. A. Anwar, “Environmental Health in Egypt,” Interna- tional Journal of Hygiene and Environmental Health, Vol. 206, No. 4-5, 2003, pp. 339-350. [6] M. Mohamed, M. Osman, T. Potter and R. Levin, “Lead and Cadmium in Nile River Water and Finished Drinking Water in Greater Cairo, Egypt,” Environment Interna- tional, Vol. 24, No. 7, 1998, pp. 767-772. [7] D. Chapman, D. E. Chapman, Ed., “Water Quality As- sessments. A Guide to the Use of Biota, Sediments and Water in Environmental Monitoring,” 2nd Edition, Chap- man & Hall, London, 1996. [8] E. Mapfumo, W. Willms and D. Chanasyk, “Water Qual- ity of Surface Runoff from Grazed Fescue Grassland Watershed in Alberta,” Water Quality Research Journal of Canada, Vol. 37, No. 3, 2002, pp. 543-562. [9] G. Fernandez, G. M. Chescheir, R. W. Skaggs and D. M. Amatya, “WATGIS: A GIS-Based Lumped Parameter Water Quality Model,” Transactions of the ASAE, Vol. 45, No. 3, 2002, pp. 593-600. [10] S. McCready, G. F. Birch and E. R. Long, “Metallic and Organic Contaminants in Sediments of Sydney Harbour, Australia and Vicinity - A Chemical Dataset for Evaluat- ing Sediment Quality Guidelines,” Environment Interna- tional, Vol. 32, No. 4, 2006, pp. 455-465. [11] T. H. Goodwin, A. Young, M. Holmes, G. Old, N. Hewitt, G. Leeks, J. Packman and B. Smith, “The Temporal and Spatial Variability of Sediment Transport and Yields within the Bradford Beck Catchment, West Yorkshire,” Science of the Total Environment, Vol. 314, 2003, pp. 475-494. [12] M. Labonne, S. Basin, D. Othman and J. Luck, “Lead Isotopes in Muscels as Tracers of Metal Sources and Wa- ter Movements in a Lagoon (Thau Basin, S. France),” Chemical Geology, Vol. 181, No. 1-4, 2001, pp. 181-191. [13] A. Osman, S. Wuertz, I. Mekkawy, H. Exner and F. Kir- schbaum, “Lead Induced Malformations in Embryos of the African Catfish Clarias Gariepinus (Burchell, 1822),” Environmental Toxicology, Vol. 22, No. 4, 2007, pp. 375- 389. [14] S. Mansour and M. Sidky, “Ecotoxicological Studies. 3. Heavy Metals Contaminating Water and Fish from Fay- oum Governorate, Egypt,” Food Chemistry, Vol. 78, No. 1, 2002, pp. 15-22. [15] N. Barak and C. Mason, “A Survey of Heavy Metal Lev- els in Eels (Anguilla anguilla) from Some Rivers in East Anglia, England - The Use of Eels as Pollution Indica- tors,” Internationale Revue Der Gesamten Hydrobiologie, Vol. 75, No. 6, 1990, pp. 827-833. [16] S. Hayat, M. Javed and S. Razzaq, “Growth Performance of Metal Stressed Major Carps viz. Catla Catla, Labeo Rohita and Cirrhina Mrigala Reared under Semi-Intensive Culture System,” Pakistan Veterinary Journal, Vol. 27, No. 1, 2007, pp. 8-12. [17] M. Romeo and Z. Siau, Y. Sidoumou and M. Gnassia Barelli, “Heavy Metal Distribution in Different Fish Spe- cies from the Mauritania Coast,” Science of the Total En- vironment, Vol. 232, No. 3, 1999, pp. 169-175. [18] H. Lin and P. Hwang, “Acute and Chronic Effects of Indium Chloride (InCl3) on Tilapia (Oreochromis Mos- sambicus) Larvae,” Bulletin of Environmental Contami- nation and Toxicology, Vol. 61, No. 1, 1998, pp. 123-128. [19] APHA, A. D. Eaton, American Public Health Association, Mary Ann H. Franson, American Water Works Associa- tion (Ed.), “Standard Methods for the Examination of Water & Wastewater,” 2005. [20] SPSS, “SPSS-Inc for Windows Release, Chicago,” Vol. 10, 1998, [21] C. Moon, Y. Lee and T. Yoon, “Variation of Trace Cu, Pb and Zn in Sediment and Water of an Urban Stream Resulting from Domestic Effluents,” Water Research, Vol. 28, No. 4, 1994, pp. 985-991. [22] S. Ibrahim and I. Tayel, “Effect of Heavy Metals on Gills of Tilapia Ziilli Inhabiting the River Nile Water (Dami- etta Branch and El-Rahawey Drain),” Egypt Journal of Aquatic Biology & Fish., Vol. 9, No. 2, 2005, pp. 111- 128. [23] U. Forstner and G. T. W. Wittmann, “Metal Pollution in Aquatic Environment,” Springer-Verlag, New York, 1983. [24] K. Binning and D. Baird, “Survey of Heavy Metals in the Sediments of the Swarkop River, Estuary, Port: Elizabeth South Africa,” Water SA, Vol. 27, 2001, pp. 451-466. [25] A. Abdel-Satar, “Quality of River Nile Sediments from Idfo to Cairo,” Egyptian Journal of Aquatic Research, Vol. 31, No. 2, 2005, pp. 182-199. [26] M. Javed, “Heavy Metal Contamination of Freshwater Fish and Bed Sediments in the River Ravi Stretch and  Water Quality and Heavy Metal Monitoring in Water, Sediments, and Tissues of the African Catfish Clarias gariepinus (Burchell, 1822) from the River Nile, Egypt Copyright © 2010 SciRes. JEP 400 Related Tributaries,” Pakistan Journal of Biology Science, Vol. 8, No. 10, 2005, pp. 1337-1341. [27] B. Chattopadhyay, A. Chatterjee and S. Mukhopadhyay, “Bioaccumulation of Metals in the East Calcutta Wetland Ecosystem,” Aquatic Ecosystem Health and Management, Vol. 5, No. 2, 2002, pp. 191-202. [28] I. Papagiannis, I. Kagalou, J. Leonardos, D. Petridis and V. Kalfakakou, “Copper and Zinc in Four Freshwater Fish Species from Lake Pamvotis (Greece),” Environment International, Vol. 30, No. 3, 2004, pp. 357-362. [29] P. Tawari-Fufeyin and S. Ekaye, “Fish Species Diversity as Indicator of Pollution in Ikpoba River, Benin City, Ni- geria,” Reviews in Fish Biology and Fisheries, Vol. 17, 2007, pp. 21-30. [30] H. Karadede-Akin and E. Unlü, “Heavy Metal Concen- trations in Water, Sediment, Fish and Some Benthic Or- ganisms from Tigris River, Turkey,” Environmental Monitoring Assessment, Vol. 131, No. 1-3, 2007, pp. 323- 337. [31] M. Dural, M. Z. Goksu and A. Ozak, “Investigation of Heavy Metal Levels in Economically Important Fish Species Captured from the Tuzla Lagoon,” Food Chemis- try, Vol. 102, 2007, pp. 415-421. [32] M. Bryan, G. Atchison and M. Sandheinrich, “Effects of Cadmium on the Foraging Behavior and Growth of Juve- nile Bluegill, Lepomis Macrochirus,” Canadian Journal of Fisheries and Aquatic Science, Vol. 52, 1995, pp. 1630-1638. [33] A. Yacoub, “Study on Some Heavy Metals Accumulated in Some Organs of Three River Nile Fishes from Cairo and Kalubia Governorates,” African Journal of Biology Science, Vol. 3, 2007, pp. 9-21. [34] WHO, “Environmental Health Criteria 160-Ultraviolet radiation, Published under the Joint Sponsorship of the United Nations Environment Programme, the Interna- tional Labour Organisation, and the World Health Or- ganization,” 1994. [35] L. Woodward, M. Mulvey and M. Newman, “Mercury Contamination and Population-Level Responses in Chi- ronomids: Can Allozyme Polymorphism Indicate Expo- sure?” Environmental Toxicology and Chemistry, Vol. 15, No. 8, 1996, pp. 1309-1316. [36] A. El-Naggar, S. Mahmoud and S. Tayel, “Bioaccumula- tion of Some Heavy Metals and Histopathological Altera- tions in Liver of Oreochromis Niloticus in Relation to Water Quality at Different Localities along the River Nile, Egypt,” World Journal of Fish and Marine Sciences, Vol. 1, No. 2, 2009, pp. 105-114. [37] L. Coetzee, H. du Preez and J. van Vuren, “Metal Con- centrations in Clarias Gariepinus and Labeo Umbratus from the Olifants and Klein Olifants River, Mpumalanga, South Africa: Zinc, Copper, Manganese, Lead, Chromium, Nickel, Aluminium and Iron,” Water SA, Vol. 28, No. 4, 2002, pp. 433-448. [38] S. Tayel, A. M. Yacoub and S. Mahmoud, “Histopa- thological and Haematological Responses to Freshwater Pollution in the Nile Catfish Clarias Gariepinus,” Journal of Egyptian Academic Society for Environmental Devel- opment, Vol. 9, 2008, pp. 43-60. [39] B. M. Hayton, “Rate-Limiting Barriers to Xenobiotic Uptake by the Gill,” Environmental Toxicology and Chemistry, Vol. 9, 1990, pp. 151-157. [40] A. Ikem, N. Egiebor and K. Nyavor, “Trace Elements in Water, Fish and Sediments from Tuskegee Lake, South- eastern USA,” Water, Air, & Soil Pollution, Vol. 149, No. 1-4, 2003, pp. 51-75. |