Paper Menu >>
Journal Menu >>
 Journal of Environmental Protection, 2010, 1, 384-388 doi:10.4236/jep.2010.14044 Published Online December 2010 (http://www.SciRP.org/journal/jep) Copyright © 2010 SciRes. JEP The Practice and Challenges of Solid Waste Management in Damaturu, Yobe State, Nigeria Ayo Babalola1, Hassan Tsenbeya Ishaku2, Ibrahim Busu1, Mohammad Rafee Majid2 1Department of Remote Sensing, Faculty of Geo-Information Science and Engineering, Universiti Teknologi, Johor, Malaysia; 2Department of Urban and Regional Planning, Faculty of Built Environment, Universiti Teknologi, Johor, Malaysia. Email: babaayo547@gmail.com, htishaku123@gmail.com Received August 4th, 2010; revised September 6th, 2010; accepted September 10th, 2010. ABSTRACT This paper presents an overview of the current solid waste management practices in Damaturu town and provides a brief discussion on the future challenges. Damaturu town became a state capital in August 1991. Since then the popula- tion has been on a steady increase mainly due to influx of people and its strategic location along axial route to major cities in the northeast region. Wastes are being generated mainly from residential, commercial and institutional land uses. Waste collection bins are placed at strategic locations identified by the agency and termed as high waste generating points with wheeled plastic waste bins, metal waste bins and constructed waste bunkers. The contents of these bins are finally disposed of at a location 6 kilometers away from the generating points. Spatial data on waste distribution was collected using a global positioning system (GPS). The data was manipulated and processed using Geographic infor- mation system (GIS) to produce the waste distribution map. Findings revealed that the existing solid waste management system is inefficient as the present practice rely on monthly collection and disposal of waste using an open dump site. Keywords: Practice and Challenges, Solid Waste Management, Damaturu, GIS, GPS 1. Introduction Solid waste management has become a global problem especially in the developing countries of the world. In Nigeria, for instance it is not unusual to see heaps of garbage in the major cities littering the streets, dumped in drains, vacant plots, and water bodies, and this has in many cases resulted in spread of communicable diseases. The situation appears to continue unabated due largely to the factors of urbanization, population growth, improved life style and insufficient funds to properly manage solid waste [1]. Statistics show that the population growth rate of Ni- geria as at 1991 was 3.0% and an urban growth rate of about 5.5% per annum, while the average waste genera- tion rate is put at 0.49 kg per day [2]. Urban centers in Nigeria has also witnessed a steady rise in waste genera- tion due to urbanization and increase in population, for instance Abuja the nation’s capital generates between 0.55-0.58 kg of waste per person per day, and Lagos state one of the most populous cities in the world generated 4 million tons of waste in 1995 [3], and by year 2000, the quantity of municipal solid waste generated in Lagos metropolis alone was estimated to have increased to 998, 081 tons [4] while Minna the Niger state capital gener- ates about 90 tons of solid waste per day [5] among oth- ers. The “Waste Management Hierarchy” (minimization, recovery and transformation, and disposal) has been adopted by most industrialized nations as the menu for developing solid waste management strategies. The ex- tent to which any one option is used within a given coun- try however varies, depending on a number of factors, such as topography, population density, and transporta- tion infrastructure, socioeconomic and environmental regulations [6]. Monitoring and managing waste is a vital tool for proper land use planning. Sustainable planning in growing urban agglomeration encompasses the active development of urban open spaces. The loss of urban green and other vacant plots does not only threaten the urban climate and ecosystems, but it may also affect a city’s image and the residential satisfaction in general. Quantifiable information about waste generation and the amount of waste distribution are essential for sustainable planning. Therefore, monitoring and managing waste in urban open space are required to outline the differences of urban waste and distribution, this should encompass  The Practice and Challenges of Solid Waste Management in Damaturu, Yobe State, Nigeria Copyright © 2010 SciRes. JEP 385 more than merely measuring the overall percentage of waste that may reflect the importance of different open spaces in specific environment. Open spaces usually function as corridors for fresh air supply and facilitate good air circulation in general. It also enhances the rec- reational quality for the public and the overall image of a place. The amount of provision, distribution, and the ease of access to open spaces are key contributors to social and ecological function in urban environments [7]. The con- dition of open spaces underpins the functions of urban ecosystem. Public parks and private gardens play critical roles in supporting biodiversity and providing important ecosystem services in urban areas [8-11]. Such spaces also provide primary contact with biodiversity and offer ‘natural’ environment for many people [12]. It may in- fluence the physical and mental well-being of those peo- ple, and in the case of public open spaces, it presents broader social benefits as the meeting places that give a shared focus to diverse communities and neighborhoods. Ironically, these open spaces have been taken over by indiscriminate dumping of waste by residents thereby changing the urban morphology. This poor management practices have further compounded the existing situation in the study area. Damaturu town, the Yobe state capital is located at longitude 11°44´40" and latitude 11°57'40" [13] and having a total area of about 400 km2, situated in the northeastern part of Nigeria. The main urban area con- stituting the town occupies an area of about 20 km2. It is bounded to the north by Niger Republic and to the east by Borno state, to the south Gombe while to the west it bounded with Jigawa and Bauchi states. The topography is fairly flat with local relief usually less than 120 meters, and wind direction from north to north-east at an average speed of 4.89 m/s. The state lies mainly in the dry sa- vannah belt as a result it is dry and hot for most part of the year except in the southern part of the state which has a mild climate. Yobe state is agriculturally productive as it produces Groundnuts, Beans, Cotton, and Gum Arabic whose waste adds to the already existing garbage in the town. Damaturu town rose from an obscure local govern- ment area to the status of a state capital in 1991. The sudden change in status brought about the increase in population from less than Ten thousand (10,000) persons before 1991 to a Population of about 88,000 in 2006 and now 95,000 persons [14]. The rise in the population lev- els also brought about with it rapid economic growth and consequently the rise in the living standards of the people. Wastes and other contaminants from residential and other land use land uses in Damaturu town are highly visible. Currently, domestic solid waste management in Dama- turu has severe problems, involving low collection rate, unscientific disposal method (open dumping), lack of separation and treatment mechanism in place, and burn- ing of waste dumps without air pollution control meas- ures in place. For better understanding of the present solid waste management scenario in the study area, the paper is structured as follows: Waste collection bins are placed at strategic locations identified by the agency and termed as high waste gener- ating points with wheeled plastic waste bins, metal waste bins and constructed waste bunkers. The contents of these bins are finally disposed at a location 6 kilometers away from the generating points [15]. This method adopted shows that the waste collections are source- specified approach in which the individual components of the waste stream are sampled, sorted and weighed. This method is useful for defining a local waste stream. The system adopted by the agency is the public bin col- lection system. This comprises of the collection from different sources like residential and commercial areas and deposited in the public bins located strategically along street corners of the town. Wastes are not treated before disposal at the final dumping sites. Waste mini- mization and recycling has not gone beyond the practice of picking and sorting through heaps of refuse or garbage. Essentially, solid waste management in Nigeria is under the responsibility of the Local Environmental Protection Agency as stipulated by the [16] 1988 decree which es- tablished the Federal Environmental Protection Agency (FEPA). The collection of waste in Damaturu is carried out by the Yobe State Environmental Protection Agency, (YOSEPA) Sanitary Board and Metropolitan Council. However; these local authorities have been overwhelmed by the increasing rate of waste generation, collection and transportation problems due largely to over stretched facilities, shortages of manpower and lean budget. 2. Method of Data Collection A retrospective study involves the collection of informa- tion from (YOSEPA), the agency responsible for the management of solid waste in the town. Other sources of information include personal observations, interviews with staff of the agency. Relevant information was also sourced from reports, books and journals. Field surveys were carried out in some areas and the existing official dumpsite on the various samples of waste generated. The field survey involved the use of global positioning equipment to determine the position of dumpsters in the town. Thereafter, the spatial positions of the waste col- lection points were produced from the integration of Geographic information system (GIS) and global posi- tioning system (GPS) data. The names and locations 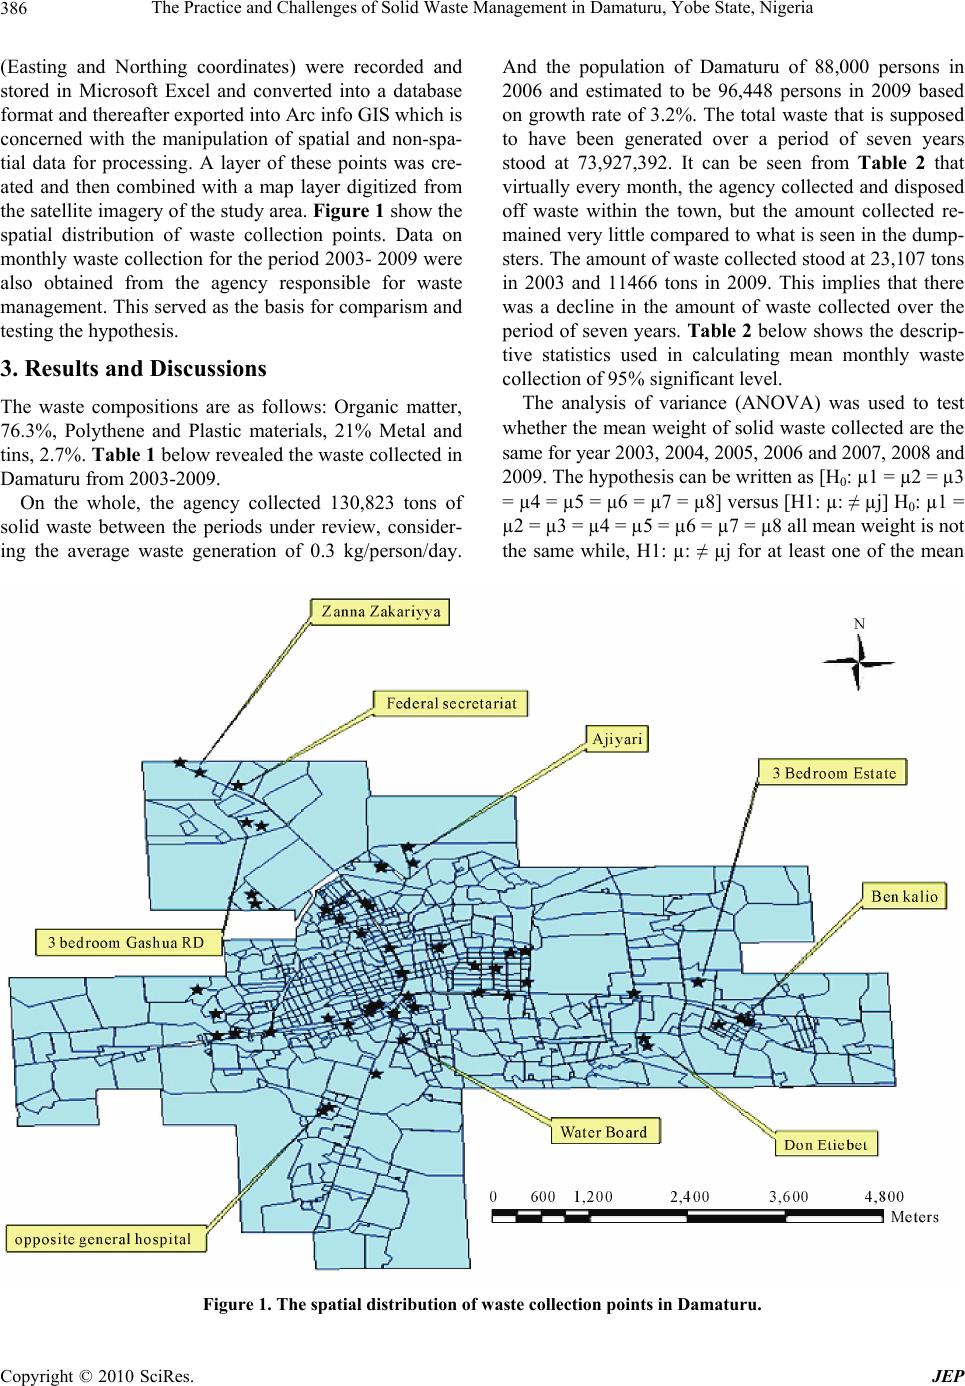 The Practice and Challenges of Solid Waste Management in Damaturu, Yobe State, Nigeria Copyright © 2010 SciRes. JEP 386 (Easting and Northing coordinates) were recorded and stored in Microsoft Excel and converted into a database format and thereafter exported into Arc info GIS which is concerned with the manipulation of spatial and non-spa- tial data for processing. A layer of these points was cre- ated and then combined with a map layer digitized from the satellite imagery of the study area. Figure 1 show the spatial distribution of waste collection points. Data on monthly waste collection for the period 2003- 2009 were also obtained from the agency responsible for waste management. This served as the basis for comparism and testing the hypothesis. 3. Results and Discussions The waste compositions are as follows: Organic matter, 76.3%, Polythene and Plastic materials, 21% Metal and tins, 2.7%. Table 1 below revealed the waste collected in Damaturu from 2003-2009. On the whole, the agency collected 130,823 tons of solid waste between the periods under review, consider- ing the average waste generation of 0.3 kg/person/day. And the population of Damaturu of 88,000 persons in 2006 and estimated to be 96,448 persons in 2009 based on growth rate of 3.2%. The total waste that is supposed to have been generated over a period of seven years stood at 73,927,392. It can be seen from Table 2 that virtually every month, the agency collected and disposed off waste within the town, but the amount collected re- mained very little compared to what is seen in the dump- sters. The amount of waste collected stood at 23,107 tons in 2003 and 11466 tons in 2009. This implies that there was a decline in the amount of waste collected over the period of seven years. Table 2 below shows the descrip- tive statistics used in calculating mean monthly waste collection of 95% significant level. The analysis of variance (ANOVA) was used to test whether the mean weight of solid waste collected are the same for year 2003, 2004, 2005, 2006 and 2007, 2008 and 2009. The hypothesis can be written as [H0: µ1 = µ2 = µ3 = µ4 = µ5 = µ6 = µ7 = µ8] versus [H1: µ: ≠ µj] H0: µ1 = µ2 = µ3 = µ4 = µ5 = µ6 = µ7 = µ8 all mean weight is not the same while, H1: µ: ≠ µj for at least one of the mean Figure 1. The spatial distribution of waste collection points in Damaturu. 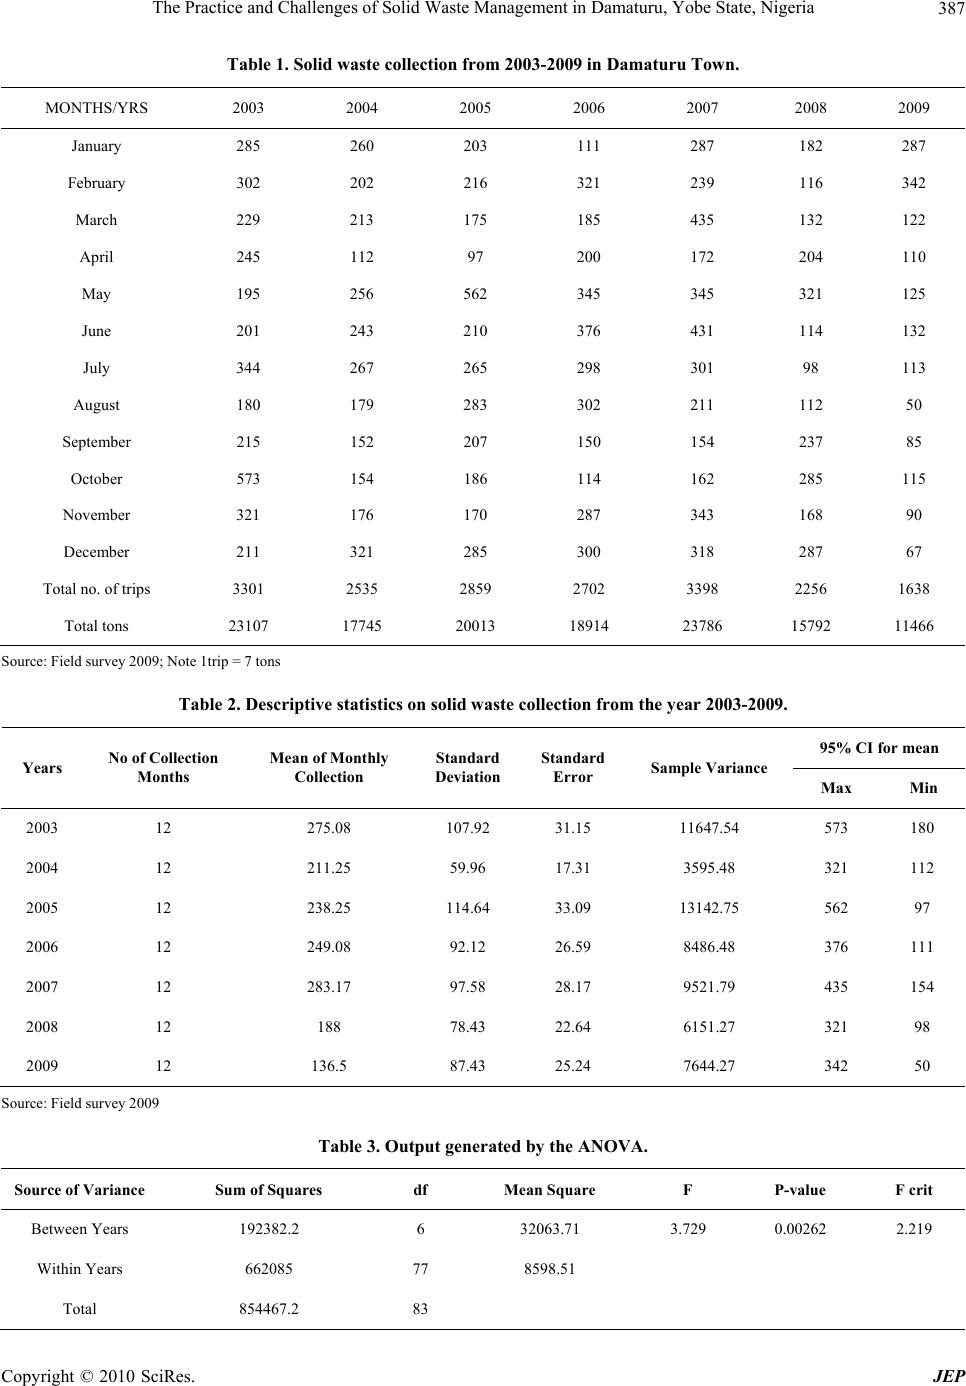 The Practice and Challenges of Solid Waste Management in Damaturu, Yobe State, Nigeria Copyright © 2010 SciRes. JEP 387 Table 1. Solid waste collection from 2003-2009 in Damaturu Town. MONTHS/YRS 2003 2004 2005 2006 2007 2008 2009 January 285 260 203 111 287 182 287 February 302 202 216 321 239 116 342 March 229 213 175 185 435 132 122 April 245 112 97 200 172 204 110 May 195 256 562 345 345 321 125 June 201 243 210 376 431 114 132 July 344 267 265 298 301 98 113 August 180 179 283 302 211 112 50 September 215 152 207 150 154 237 85 October 573 154 186 114 162 285 115 November 321 176 170 287 343 168 90 December 211 321 285 300 318 287 67 Total no. of trips 3301 2535 2859 2702 3398 2256 1638 Total tons 23107 17745 20013 18914 23786 15792 11466 Source: Field survey 2009; Note 1trip = 7 tons Table 2. Descriptive statistics on solid waste collection from the year 2003-2009. 95% CI for mean Years No of Collection Months Mean of Monthly Collection Standard Deviation Standard Error Sample Variance Max Min 2003 12 275.08 107.92 31.15 11647.54 573 180 2004 12 211.25 59.96 17.31 3595.48 321 112 2005 12 238.25 114.64 33.09 13142.75 562 97 2006 12 249.08 92.12 26.59 8486.48 376 111 2007 12 283.17 97.58 28.17 9521.79 435 154 2008 12 188 78.43 22.64 6151.27 321 98 2009 12 136.5 87.43 25.24 7644.27 342 50 Source: Field survey 2009 Table 3. Output generated by the ANOVA. Source of Variance Sum of Squares df Mean Square F P-value F crit Between Years 192382.2 6 32063.71 3.729 0.00262 2.219 Within Years 662085 77 8598.51 Total 854467.2 83  The Practice and Challenges of Solid Waste Management in Damaturu, Yobe State, Nigeria Copyright © 2010 SciRes. JEP 388 weight is the same. H0 is rejected at the level significance of 0.05 since the value of the F statistic (3.729) is greater than the critical value of the F statistic, F crit (2.219). This indicates that there is a significant difference in the amount of waste collected from 2003-2009 at the 0.05 level of significance. From the foregoing, it becomes clear that the agency performed below average as heaps of garbage have taken over access road and thereby causing traffic problems in some parts of the town while the drainage system have been blocked as a result of poor management practices. 4. Conclusions The analysis of waste collected shows that there was a decrease in the amount of waste collected from 23107 tons in 2003 to 11466 tons in 2009 during the period un- der review. This has led to loss of aesthetic nature of the urban landscape. Damaturu town faces the same chal- lenges as many other urban centers in Nigeria in terms of infrastructure deficiency, population growth and lack of public awareness on the issue of waste management. This study revealed that inadequate infrastructure and funding are some of the greatest obstacles to successful waste management practices. Despite the fact that waste can be recycled to produce new products these wastes are cur- rently littering every available open space. The biode- gradable waste could be composted to organic manure and could be used on the farms as manures. The agency is grossly understaffed as the so called laborers are been hired on temporary basis. Finally, public attitude towards waste disposal is not helping matters. Despite the presence of waste collection bins, children especially dump their waste outside these bins. Enlightenment campaigns should be carried to educate the public. REFERENCES [1] United Nations Environmental Protection UNEP, 2002. http://www.unep.or.jp/letc/publication/spc/state_of_Wast eManagement/index.asp [2] T. A. Adewole, “Waste Management towards Sustainable Development in Nigeria: A Case Study of Lagos State,” International Non Governmental Organization (NGO) Journal, Vol. 4, No. 4, 2009. pp. 173-179. [3] U. U. Solomon, “The State of Solid Waste Management in Nigeria,” Waste Management, Vol. 29, No. 10, 2009, pp. 2787-2788. [4] NEST. “Nigeria’s Threatened Environment: A National Profile,” Environmental Study/Action Team (NEST), Ibadan, 1991. [5] UNDP/NISEPA. “Niger State Framework for Integrated Sustainable Waste Management,” Niger State Strategic Waste Management Framework, 2009. [6] S. Sakai, S. E. Sawell, A. J. Chandler, et al., “World trends in Municipal Solid Waste Management,” Waste Management, Vol. 16, No. 5-6, 1996, pp. 341-350. [7] O. Barbosa, J. A. Tratalos, P. R. Armsworth, R. G. Da- vies, R. A. Fuller, P. Johnson, et al., “Who Benefits from Access to Green Space? A Case Study from Sheffield, UK,” Landscape and Urban Planning, Vol. 83, No. 40239, 2007, pp. 187-195. [8] P. Bolund and S. Hunhammar, “Ecosystem Services in Urban Areas,” Ecology Econometrics, Vol. 29, No. 2, 1999, pp. 293-301. [9] P. Crane and A. Kinzig, “Nature in the Metropolis,” Sci- ence, Vol. 308, No. 5726, 2005, pp. 1225-11225. [10] K. Gaston, P. Warren, K. Thompson and R. Smith, “Ur- ban Domestic Gardens (IV): The Extent of the Resource and It’s Associated Feature,” Biodiversity Conservation, Vol. 14, No. 14, 2005, pp. 3327-3349. [11] R. Smith, K. Gaston, P. Warren and K. Thompson, “Ur- ban Domestic Gardens (V): Relationship between Land cover Composition, Housing and Landscape,” Landscape Ecology, Vol. 20, No. 2, 2005, pp. 235-253. [12] A. Jorgensen, J. Hitchmough and T. Calvert, “Woodland Spaces and Edges: Their Impact on Perception of Safety and Preference,” Landscape Urban Planning, Vol. 60, No. 3, 2002, pp. 135-150. [13] Federal Republic of Nigeria Gateway to Land and Water Information: Nigerian National Information Service, 2009. [14] National Population Commission of Nigerian, NPC Bu- reau for Statistics Population Figures, 2006. http://www. population.gov.ng.Accessed [15] Yobe State Environmental Protection Agency YOSEPA, “Liquid and Solid Waste Management in Damaturu Me- tropolis in the Capital of Yobe State,” Yobe Printing, Damaturu, Vol. 6, 2009, pp. 1-14. [16] The Nigerian Urban Regional Planning Law Decree 88, Nigerian Institute of Town Planners. Ministry of Informa- tion and Culture Printing Department, Lagos Nigeria, 1992. |

