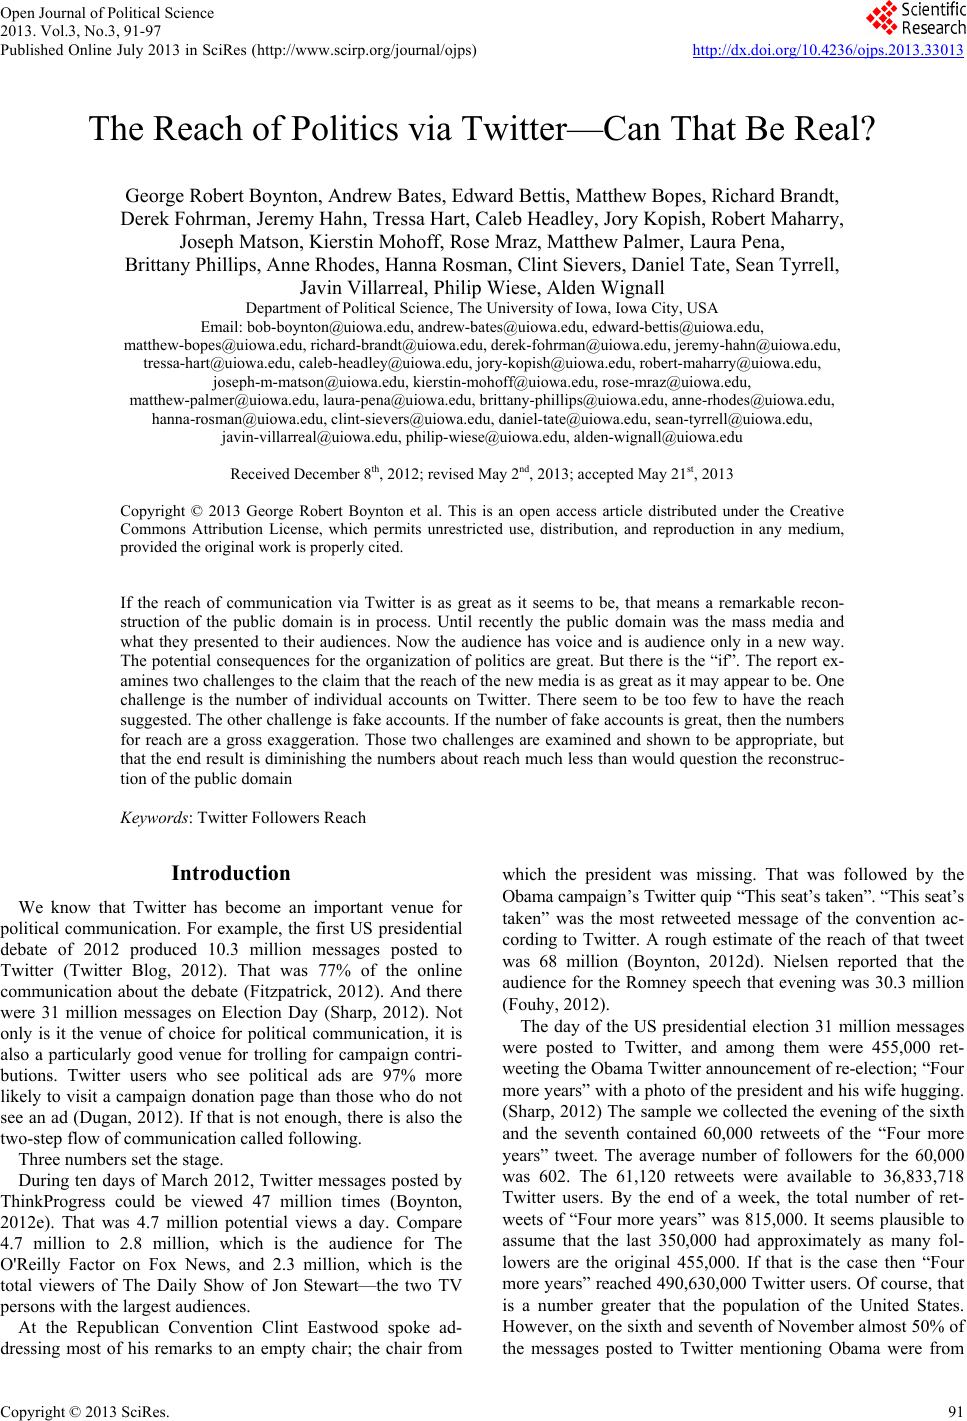
Paper Menu >>
Journal Menu >>
 Open Journal of Political Science 2013. Vol.3, No.3, 91-97 Published Online July 2013 in SciRes (http://www.scirp.org/journal/ojps) http://dx.doi.org/10.4236/ojps.2013.33013 Copyright © 2013 SciRes. 91 The Reach of Politics via Twitter—Can That Be Real? George Robert Boynton, Andrew Bates, Edward Bettis, Matthew Bopes, Richard Brandt, Derek Fohrman, Jeremy Hahn, Tressa Hart, Caleb Headley, Jory Kopish, Robert Maharry, Joseph Matson, Kierstin Mohoff, Rose Mraz, Matthew Palmer, Laura Pena, Brittany Phillips, Anne Rhodes, Hanna Rosman, Clint Sievers, Daniel Tate, Sean Tyrrell, Javin Villarreal, Philip Wiese, Alden Wignall Department of Political Science, The University of Iowa, Iowa City, USA Email: bob-boynton@uiowa.edu, andrew-bates@uiowa.edu, edward-bettis@uiowa.edu, matthew-bopes@uiowa.edu, richard-brandt@uiowa.edu, derek-fohrman@uiowa.edu, jeremy-hahn@uiowa.edu, tressa-hart@uiow a .edu, caleb-headley@uiowa.edu, jory-k opish @uiowa.edu, robert -maharry@uiowa.edu, joseph-m-matson@uiowa.edu, kierstin-m oh off@uiowa.edu, rose-mraz@uiowa.edu, matthew-palmer@uiowa.edu, laura-pena@uiowa.edu, brittany-phillips@uiowa.edu, anne-rhodes@uiowa.edu, hanna-rosman@uiowa.edu, clint-si evers@uiowa.edu, daniel-tate@uiowa.edu, sean-tyrrell@uiowa.edu, javin-villarreal@uiowa.edu, philip-wiese@uiowa.edu, alden-wignall@uiowa.edu Received December 8th, 2012; revised May 2nd, 2013; accepted May 21st, 2013 Copyright © 2013 George Robert Boynton et al. This is an open access article distributed under the Creative Commons Attribution License, which permits unrestricted use, distribution, and reproduction in any medium, provided the origina l w o rk is properly cited. If the reach of communication via Twitter is as great as it seems to be, that means a remarkable recon- struction of the public domain is in process. Until recently the public domain was the mass media and what they presented to their audiences. Now the audience has voice and is audience only in a new way. The potential consequences for the organization of politics are great. But there is the “if”. The report ex- amines two challenges to the claim that the reach of the new media is as great as it may appear to be. One challenge is the number of individual accounts on Twitter. There seem to be too few to have the reach suggested. The other challenge is fake accounts. If the number of fake accounts is great, then the numbers for reach are a gross exaggeration. Those two challenges are examined and shown to be appropriate, but that the end result is diminishing the numbers about reach much less than would question the reconstruc- tion of the public domain Keywords: Twitter Followers Reach Introduction We know that Twitter has become an important venue for political communication. For example, the first US presidential debate of 2012 produced 10.3 million messages posted to Twitter (Twitter Blog, 2012). That was 77% of the online communication about the debate (Fitzpatrick, 2012). And there were 31 million messages on Election Day (Sharp, 2012). Not only is it the venue of choice for political communication, it is also a particularly good venue for trolling for campaign contri- butions. Twitter users who see political ads are 97% more likely to visit a campaign donation page than those who do not see an ad (Dugan, 2012). If that is not enough, there is also the two-step flow of communication called following. Three numbers set the st a g e. During ten days of March 2012, Twitter messages posted by ThinkProgress could be viewed 47 million times (Boynton, 2012e). That was 4.7 million potential views a day. Compare 4.7 million to 2.8 million, which is the audience for The O'Reilly Factor on Fox News, and 2.3 million, which is the total viewers of The Daily Show of Jon Stewart—the two TV persons with the largest audiences. At the Republican Convention Clint Eastwood spoke ad- dressing most of his remarks to an empty chair; the chair from which the president was missing. That was followed by the Obama campaign’s Twitter quip “This seat’s take n”. “This seat’s taken” was the most retweeted message of the convention ac- cording to Twitter. A rough estimate of the reach of that tweet was 68 million (Boynton, 2012d). Nielsen reported that the audience for the Romney speech that evening was 30.3 million (Fouhy, 2012). The day of the US presidential election 31 million messages were posted to Twitter, and among them were 455,000 ret- weeting the Obama Twitter announcement of re-election; “Four more years” with a photo of the president and his wife hugging. (Sharp, 2012) The sample we collected the evening of the sixth and the seventh contained 60,000 retweets of the “Four more years” tweet. The average number of followers for the 60,000 was 602. The 61,120 retweets were available to 36,833,718 Twitter users. By the end of a week, the total number of ret- weets of “Four more years” was 815,000. It seems plausible to assume that the last 350,000 had approximately as many fol- lowers are the original 455,000. If that is the case then “Four more years” reached 490,630,000 Twitter users. Of course, that is a number greater that the population of the United States. However, on the sixth and seventh of November almost 50% of the messages posted to Twitter mentioning Obama were from  G. R. BOYNTON ET AL. outside the US (Boynton, 2012a). This message was being ret- weeted around the world. The viewership of tweets by ThinkProgress was twice that of O'Reilly and Jon Stewart. “This seat’s taken” was seen by twice the number of people who watched the Romney speech. And “Four more years” reaches half a billion. These numbers chal- lenge our tacit assumptions about mass media and Twitter. Yes, Twitter is 400 million messages a day, we say, but it must still take a “back seat” to the mass medium known as television. That is the general assumption. I could pile up more very big numbers, but in this report we will look at two challenges to the big numbers. Challenges claim that there is something badly misleading about the big numbers. Estimates of Twitter Use Pew provides an estimate of Twitter use in the US based on their surveys. The most recent report was for users as of Febru- ary of 2012 (Smith & Brenner, 2012). They estimate that 15% of online adults use Twitter, and that 80% of adults are internet users. To compare this with the numbers above the percentages have to be converted into numbers. US population 18 and older = 308,155,000 80% on line = 246,524,000 15% of online use Twitter = 36,978,600 37 million is fewer than 47 million, and considerably fewer than 68 million or half a billion, which raises the question about the counts of Twitter reach. However, there is another way to estimate Twitter use in the US Semiocast, a French social media analysis company, esti- mates that as of July 1, 2012 there were more than 140 million Twitter accounts in the US and it had grown from 108 million at the beginning of the year to 142 million by the end of June (Semiocast, 2012). They used a combination of checking pro- files and a sample of 1 billion tweets in June to make their es- timate. The estimates are wildly different. There are three things to say about the difference. First, they are counting different users. Pew estimates number of persons with a Twitter account. Sem- iocast estimates number of accounts. There are many accounts that are institutional in addition to accounts of individuals. And institutional accounts are important in political communication via Twitter. The New York Times has 6.1 million followers and 90,046 tweets as of September 18, 2012, for example. Their tweets are not all about politics, but many are. And The New York Times is only one. There are an uncounted number of institutional accounts that are doing political communication via Twitter. Second, they are also wildly different in their estimates of growth of Twitter use. Pew estimates that the percentage of online users with Twitter accounts grew from 13% in 2011 to 15% in 2012. That seems very short of the explosive growth found by almost all other counts. Semiocast, for example, finds a much greater growth in the first half of 2012—142 million is 1.32 times 108 million. The Pew growth rate seems well below what others have found. Third, both methods used for making estimates have flaws. Semiocast based their estimate on examining 500 million pro- files on Twitter. But most profiles do not include location. With the 1 billion samples of Twitter messages they can get time zones. They can check on language. But they are constructing an estimate from shards of evidence. It is not a count. Pew sur- veys have something of the same problem. Pew has now an- nounced that the response rate for their surveys is 9% (Pew Research Center, 2012). That does not mean we should ignore their results. It does mean that, just as with the Semiocast esti- mates, one would also want other evidence to supplement the Pew survey results. The assumption made above is that all of the communication is from within US boundaries. But that flies in the face of what we know about Twitter as a technology for global communica- tion. To show the impact of communication from beyond US borders these are numbers for the first ten days in November as we in the US and people around the world reacted to the presi- dential election. Table 1 lists the number of users posting one or more mes- sages mentioning President Obama between November 1 and November 10. The total sample includes both users from US time zones and users from not US time zones. The procedure for collecting and the use of the time zones is found in “It’s a global shoutout Mr. President” (Boynton, 2012a). While there is variation in the percentage of users posting from not US time zone locations the average for the ten days was 42%. This table is more relevant to the numbers retweeting “Four more years” than the other two. But it would be a mistake to think that none of the communication retweeting ThinkProgress or mentioning “This seat’s taken” were exclusively from the US. We need to rethink, and re-count, Twitter communication about politics. It is global beyond our normal expectations. Where does that leave us? I suggest a safe position is to as- sume that the number of Twitter accounts being used for politi- cal communication is somewhere between the Pew estimate and the Semiocast estimate. That leaves room for some very big numbers; including a need to recognize how global the com- munication may have become. Fake Accounts We all know there are many fake accounts on Twitter. We do know that. We just do not know how many nor how many shown up in communication about politics. So, the existence of an unknown number of fake accounts is a challenge to any count of Twitter messages about politics. How many are fake? How many are not? In July, 2012 Status People, a small British firm, made avail- able a tool that estimates the number of fake accounts on the basis of the activity associated with the account (Status People, Table 1. Percent of Twitter messages posted from t ime zones outside the United States. Nov. 1 Nov. 2 Nov. 3 Nov. 4 Nov. 5 Nov. 6 Nov. 7 Nov. 8 Nov. 9 Nov. 10 Total Sample 216,247 230,888 194,856 270,815 376,799 673,865 659,178 361,486 269,651 294,453 Percent no t US 41.7 35 39.7 39.6 28.1 45.4 53.5 58 46.3 37.7 Copyright © 2013 SciRes. 92 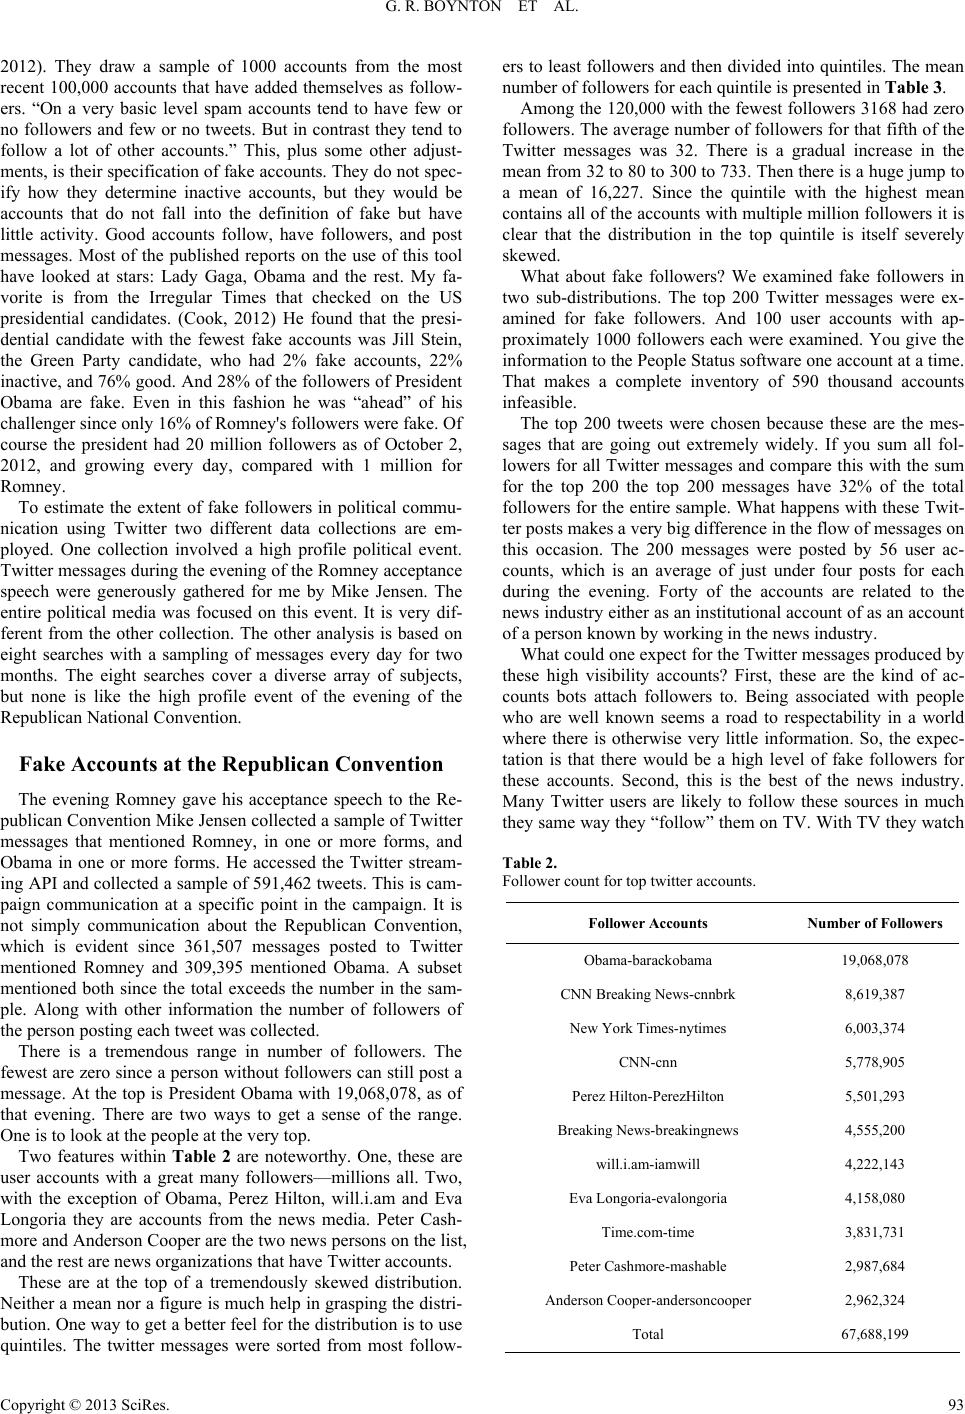 G. R. BOYNTON ET AL. 2012). They draw a sample of 1000 accounts from the most recent 100,000 accounts that have added themselves as follow- ers. “On a very basic level spam accounts tend to have few or no followers and few or no tweets. But in contrast they tend to follow a lot of other accounts.” This, plus some other adjust- ments, is their specification of fake accounts. They do not spec- ify how they determine inactive accounts, but they would be accounts that do not fall into the definition of fake but have little activity. Good accounts follow, have followers, and post messages. Most of the published reports on the use of this tool have looked at stars: Lady Gaga, Obama and the rest. My fa- vorite is from the Irregular Times that checked on the US presidential candidates. (Cook, 2012) He found that the presi- dential candidate with the fewest fake accounts was Jill Stein, the Green Party candidate, who had 2% fake accounts, 22% inactive, and 76% good. And 28% of the followers of President Obama are fake. Even in this fashion he was “ahead” of his challenger since only 16% of Romney's followers were fake. Of course the president had 20 million followers as of October 2, 2012, and growing every day, compared with 1 million for Romney. To estimate the extent of fake followers in political commu- nication using Twitter two different data collections are em- ployed. One collection involved a high profile political event. Twitter messages during the evening of the Romney acceptance speech were generously gathered for me by Mike Jensen. The entire political media was focused on this event. It is very dif- ferent from the other collection. The other analysis is based on eight searches with a sampling of messages every day for two months. The eight searches cover a diverse array of subjects, but none is like the high profile event of the evening of the Republican National Convention. Fake Accounts at the Republican Convention The evening Romney gave his acceptance speech to the Re- publican Convention Mike Jensen collected a sample of Twitter messages that mentioned Romney, in one or more forms, and Obama in one or more forms. He accessed the Twitter stream- ing API and collected a sample of 591,462 tweets. This is cam- paign communication at a specific point in the campaign. It is not simply communication about the Republican Convention, which is evident since 361,507 messages posted to Twitter mentioned Romney and 309,395 mentioned Obama. A subset mentioned both since the total exceeds the number in the sam- ple. Along with other information the number of followers of the person posting each tweet was collected. There is a tremendous range in number of followers. The fewest are zero since a person without followers can still post a message. At the top is President Obama with 19,068,078, as of that evening. There are two ways to get a sense of the range. One is to look at the people at the very top. Two features within Table 2 are noteworthy. One, these are user accounts with a great many followers—millions all. Two, with the exception of Obama, Perez Hilton, will.i.am and Eva Longoria they are accounts from the news media. Peter Cash- more and Anderson Cooper are the two news persons on the list, and the rest are news organizations that have Twitter accounts. These are at the top of a tremendously skewed distribution. Neither a mean nor a figure is much help in grasping the distri- bution. One way to get a better feel for the distribution is to use quintiles. The twitter messages were sorted from most follow- ers to least followers and then divided into quintiles. The mean number of followers for each quintile is presented in Table 3. Among the 120,000 with the fewest followers 3168 had zero followers. The average number of followers for that fifth of the Twitter messages was 32. There is a gradual increase in the mean from 32 to 80 to 300 to 733. Then there is a huge jump to a mean of 16,227. Since the quintile with the highest mean contains all of the accounts with multiple million followers it is clear that the distribution in the top quintile is itself severely skewed. What about fake followers? We examined fake followers in two sub-distributions. The top 200 Twitter messages were ex- amined for fake followers. And 100 user accounts with ap- proximately 1000 followers each were examined. You give the information to the People Status software one account at a time. That makes a complete inventory of 590 thousand accounts infeasible. The top 200 tweets were chosen because these are the mes- sages that are going out extremely widely. If you sum all fol- lowers for all Twitter messages and compare this with the sum for the top 200 the top 200 messages have 32% of the total followers for the entire sample. What happens with these Twit- ter posts makes a very big difference in the flow of messages on this occasion. The 200 messages were posted by 56 user ac- counts, which is an average of just under four posts for each during the evening. Forty of the accounts are related to the news industry either as an institutional account of as an account of a person known by working in the news industry. What could one expect for the Twitter messages produced by these high visibility accounts? First, these are the kind of ac- counts bots attach followers to. Being associated with people who are well known seems a road to respectability in a world where there is otherwise very little information. So, the expec- tation is that there would be a high level of fake followers for these accounts. Second, this is the best of the news industry. Many Twitter users are likely to follow these sources in much they same way they “follow” them on TV. With TV they watch Table 2. Follower count for top twitter accounts. Follower Accounts Number of Followers Obama-barackobama 19,068,078 CNN Breaking News-cnnbrk 8,619,387 New York Times-nytimes 6,003,374 CNN-cnn 5,778,905 Perez Hilton- PerezHilto n 5,501,293 Breaking News-breakingnews 4,555,200 will.i.am-iamwill 4,222,143 Eva Longor ia-evalongoria 4,158,080 Time.com-time 3,831,731 Peter Cash more-mashable 2,987,684 Anderson Cooper-andersoncooper 2,962,324 Total 67,688,199 Copyright © 2013 SciRes. 93 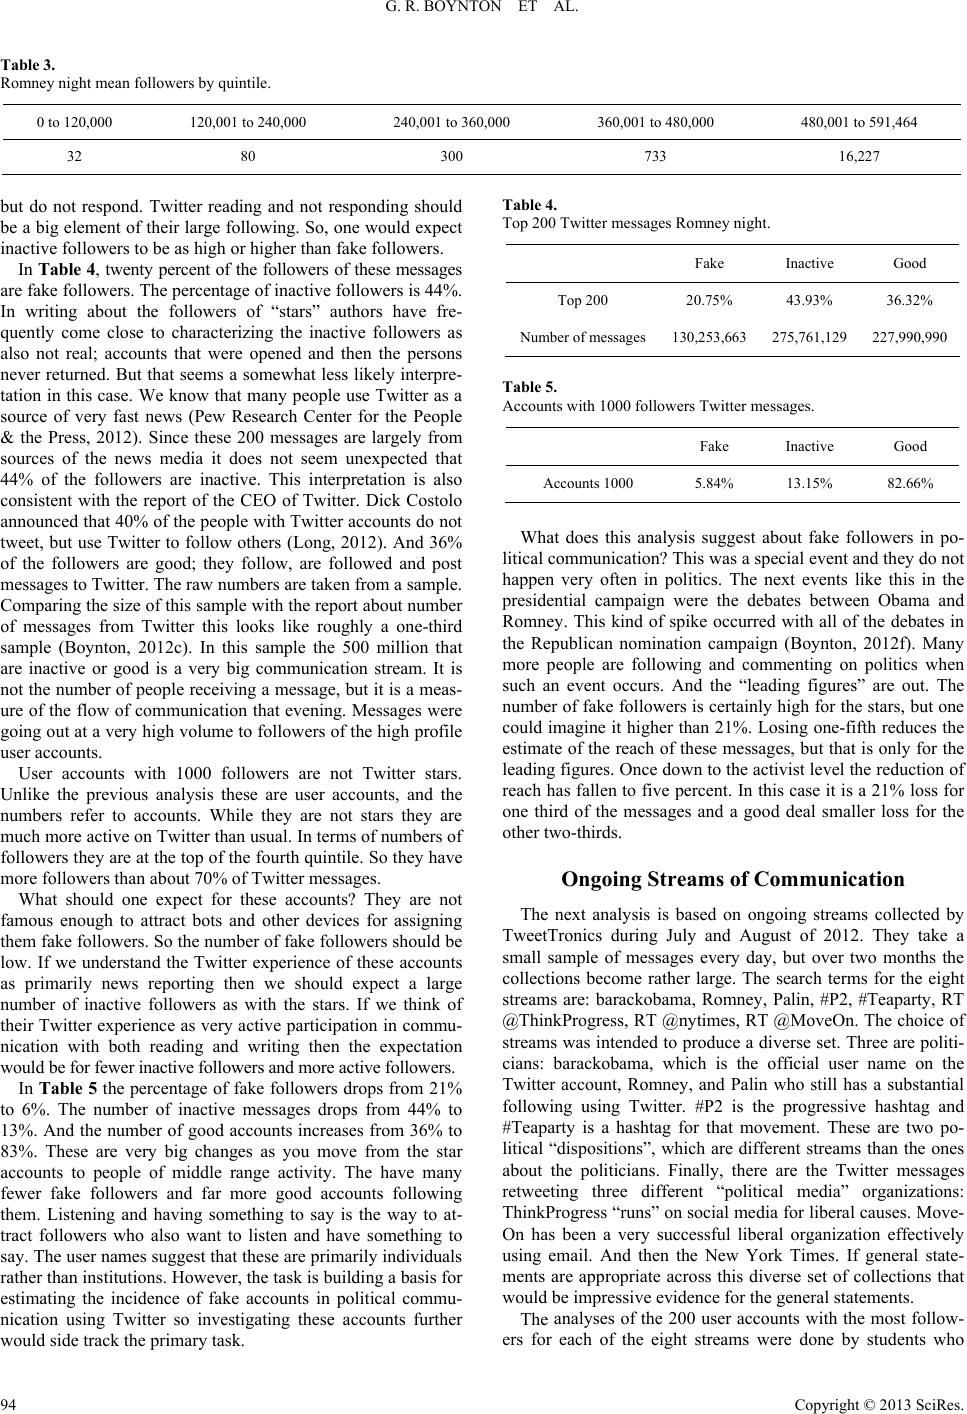 G. R. BOYNTON ET AL. Table 3. Romney night mean followers by quintile. 0 to 120,000 120,001 to 240,000 240,001 to 360,000 360,001 to 480,000 480,001 to 591,464 32 80 300 733 16,227 Table 4. Top 200 Twitter messages Romney night. but do not respond. Twitter reading and not responding should be a big element of their large following. So, one would expect inactive followers to be as high or higher than fake followers. In Table 4, twenty percent of the followers of the se messages are fake followers. The percentage of inactive followers is 44%. In writing about the followers of “stars” authors have fre- quently come close to characterizing the inactive followers as also not real; accounts that were opened and then the persons never returned. But that seems a somewhat less likely interpre- tation in this case. We know that many people use Twitter as a source of very fast news (Pew Research Center for the People & the Press, 2012). Since these 200 messages are largely from sources of the news media it does not seem unexpected that 44% of the followers are inactive. This interpretation is also consistent with the report of the CEO of Twitter. Dick Costolo announced that 40% of the people with Twitter accounts do not tweet, but use Twitter to follow others (Long, 2012). And 36% of the followers are good; they follow, are followed and post messages to Twitter. The raw numbers a re take n from a sample. Comparing the size of this sample with the report about number of messages from Twitter this looks like roughly a one-third sample (Boynton, 2012c). In this sample the 500 million that are inactive or good is a very big communication stream. It is not the number of people receiving a message, but it is a meas- ure of the flow of communication that evening. Messages were going out at a very high volume to followers of the high profile user accounts. User accounts with 1000 followers are not Twitter stars. Unlike the previous analysis these are user accounts, and the numbers refer to accounts. While they are not stars they are much more active on Twit te r than usual. In terms of numbe rs of followers they are at the top of the fourth quintile. So they have more followers than about 70% of Twitter messages. What should one expect for these accounts? They are not famous enough to attract bots and other devices for assigning them fake followers. So the number of fake followers should be low. If we understand the Twitter experience of these accounts as primarily news reporting then we should expect a large number of inactive followers as with the stars. If we think of their Twitter experience as very active participation in commu- nication with both reading and writing then the expectation would be for fewer inactive followers and more active followers. Fake Inactive Good Top 200 20.75% 43.93% 36.32% Number of messages 130,253,663 275,761,129 227,990,990 Table 5. Accounts with 1000 followers Twitter messages. Fake Inactive Good Accounts 1000 5.84% 13.15% 82.66% What does this analysis suggest about fake followers in po- litical communication? This was a special event and they do not happen very often in politics. The next events like this in the presidential campaign were the debates between Obama and Romney. This kind of spike occurred with all of the debates in the Republican nomination campaign (Boynton, 2012f). Many more people are following and commenting on politics when such an event occurs. And the “leading figures” are out. The number of fake followers is certainly high for the stars, but one could imagine it higher than 21%. Losing one-fifth reduces the estimate of the reach of these messages, but that is only for the leading figures. Once down to the activist level the reduction of reach has fallen to five percent. In this case it is a 21% loss for one third of the messages and a good deal smaller loss for the other two-thirds. Ongoing Streams of Communication The next analysis is based on ongoing streams collected by TweetTronics during July and August of 2012. They take a small sample of messages every day, but over two months the collections become rather large. The search terms for the eight streams are: barackobama, Romney, Palin, #P2, #Teaparty, RT @ThinkProgress, RT @nytimes, RT @MoveOn. The choice of streams was intended to produce a diverse set. Three are politi- cians: barackobama, which is the official user name on the Twitter account, Romney, and Palin who still has a substantial following using Twitter. #P2 is the progressive hashtag and #Teaparty is a hashtag for that movement. These are two po- litical “dispositions”, which are different streams than the ones about the politicians. Finally, there are the Twitter messages retweeting three different “political media” organizations: ThinkProgress “runs” on social media for liberal causes. Move- On has been a very successful liberal organization effectively using email. And then the New York Times. If general state- ments are appropriate across this diverse set of collections that would be impressive evidence for the general statements. In Table 5 the percentage of fake followers drops from 21% to 6%. The number of inactive messages drops from 44% to 13%. And the number of good accounts increases from 36% to 83%. These are very big changes as you move from the star accounts to people of middle range activity. The have many fewer fake followers and far more good accounts following them. Listening and having something to say is the way to at- tract followers who also want to listen and have something to say. The user names suggest that these are primarily individuals rather than institutions. However, the task is building a basis for estimating the incidence of fake accounts in political commu- nication using Twitter so investigating these accounts further would side track the primary task. The analyses of the 200 user accounts with the most follow- ers for each of the eight streams were done by students who Copyright © 2013 SciRes. 94  G. R. BOYNTON ET AL. share authorship. I added the counts for the 100 user accounts that had approximately 1000 followers. The collections are samples so the raw numbers are very par- tial totals. However comparison between the collections does give an indicat i on of their relative si ze (see Table 6). The search for Twitter messages containing barackobama found the largest number of individual user accounts, at 149,889, with retweeting nytimes messages, search for Romney and for Palin close behind. Many fewer user accounts were involved in the messages that retweeted ThinkProgress mes- sages, searches for #p2 and #teaparty, and even farther down was retweets of messages of MoveOn with only 8585 user ac- counts. The total followers are the sum of followers of each of the user accounts that posted a message to Twitter mentioning the search term. While there are substantial differences in the number of user accounts there is much less variation in the average number of followers per user account. The user ac- counts found in the search for Romney had substantially more than any of the others with 2604 followers per account. Then there were two at 1600s, barackobama and palin, the rest were in the 1300 except for the user accounts that retweeted Think- Progress messages with an average of 966 followers. Not only is there variation in the focus of the streams of communication, there is also considerable variation in the size of the streams. It is variation across two important dimensions for characterizing streams of communication. The number of followers per user account is highly skewed in each of the independent data collections. Table 7 gives the percentage of all accounts that follow the top 200 for each data collection. The extremes in the table are readily explicable. Obama and Romney streams are most likely to include messages from the major news organizations such as CNN, CBSNews, BBCWorld, and others with large followings. They are also more likely to be mentioned by celebrities such PerezHilton, EvaLongoria and DanielTosh who also have very large followings. #p2, #teaparty, and ThinkProgress are fringe elements of US politics. Hence they are less likely to have posts from Obama or major news organizations or major celebrities. But even for the “fringe” streams the top 200 still get 38% of all followers of posts in those streams. The challenge is interpreting the very large number of re- cipients of Twitter messages about politics from these streams. To what extent are those numbers produced by large number of fake accounts? Table 8 shows the number of fake accounts for each of the streams of messages. The three that are over 20% are RT @nytimes, with 28% fakes, barackobama, with 26% fakes, and Romney, with 23% fakes. These are the most prominent subjects of the eight. They are the ones most likely to have been mentioned by user ac- counts that attract bots that set up fake accounts. It is easy to illustrate how this happens. Table 9 is the number of followers and the number of fake accounts for the 10 user accounts with the most followers that mentioned barackobama in a tweet. Obama is clearly at the top with 19 million followers, and that was to increase substantially during the election campaign. Like Obama the rest are stars. CNN, CNNEE, and mashable are media “stars”. And the rest are entertainment stars including Carmelo Anthony an NBA entertainment star. Stars attract fake Table 6. Comparing the eight d ata collection. Total User Accounts Total Followers Average Followers barackobama 149,889 249,924,216 1667 RT @nytimes 134,339 186,646,099 1389 Romney 122,081 318,012,582 2604 Palin 119,236 201,333,569 1691 RT @thinkpro gr ess 51,615 51,445,535 996 #p2 39,948 52,668,719 1318 #teaparty 28,249 39,232,240 1389 RT @moveon 8585 11,928,535 1389 Table 7. Percentage all accounts that follow top 200. barackobama romney RT @moveon palin RT @nytime s #p2 #teaparty RT @thinkprogress 53% 52% 51% 47% 40% 38% 38% 38% Table 8. Fake accounts. barackobama Romney RT @moveon Palin RT @nytimes #p2 #teaparty RT @ thinkprogres s Top 200 26% 23% 5% 19% 28% 16% 16% 18% 1000 2% 3% 2% 2% 2% 1% 1% 2% Copyright © 2013 SciRes. 95  G. R. BOYNTON ET AL. Table 9. Top followers barackobama. User Account Followers Fake Followers Obama 19,027,066 36% danieltosh 6,216,847 18% CNN 5,657,090 39% PerezHilton 5,358,086 22% EvaLongoria 4,101,633 29% BBCBreaking 3,855,283 27% SarahKSilverman 3,126,763 14% mashable 2,981,526 9% CNNEE 2,972,160 27% carmeloanthony 2,450,160 15% obama2012 190,529 7% Table 10. Good accounts. barackobama Romney Palin R T @nytimes #p2 #teapa rty RT @thinkprogress Top 200 44% 38% 44% 40% 59% 66% 50% 1000 87% 83% 86% 85% 93% 94% 90% accounts. For the top 200 the pattern is straightforward. The “stars”— barackobama, Romney, Palin and RT @nytimes—are men- tioned in Twitter messages that go to only 40% good user ac- counts. That is balanced by roughly 25% of user accounts re- ceiving messages mentioning them that are fake accounts. That leaves roughly 30% as inactive accounts, which is in the neighborhood of what Costolo tells us we should expect. The “fringe”—#p2, #teaparty, and RT @thinkprogress—are men- tioned in messages that go to followers who are considerably more likely to be good accounts. The messages mentioning #teaparty go to a high of 66% good accounts. The other way to illustrate this is by comparing the number of followers and the percentage of followers that are fake for Obama and Obama2012. Twenty million followers for barack- obama are accompanied by 36% fake followers. One hundred and ninety thousand for obama2012 only attracts 7% fake ac- counts. The streams mentioning the less famous—Palin, #p2, #tea- party and RT @thinkprogress—are included in Twitter mes- sages with fewer fake followers. For them it is between 16% and 19%. So fake followers are still a big part of the reach of messages mentioning them. But it is a smaller part than for the stars. RT @moveon is the interesting deviant case. One might suggest that this is what little social media fame gets you. They have, by far, the fewest user accounts retweeting their messages, and those accounts have, by far, the fewest number of fake followers. The user accounts with approximately 1000 followers have almost all good followers. The accounts mentioning the stars have followers who are good accounts in the 80% range. The fringe has followers who are 90% good. They have almost no fake followers. They are overwhelmingly connected with other good user accounts. The contrast between the top 200 accounts and the accounts that have approximately 1000 followers is striking. These ac- counts, drawn from the same streams, have one or two percent fakes. Only the accounts from the Romney stream have as many as thre e percent fake s. This is very similar to th e findings from the Romney speech. By the time you get to accounts with a thousand followers you are in a different world from the stars. They have no attraction for fakes. Conclusion The reason for examining the validity of the big numbers is that they portend a dramatic reorganization of the public do- main. We are moving from a broadcast-audience public domain to a much more elaborate co-motion in which broadcast media and social media interact in very new ways (Boynton, 2012b). If the numbers are as big as they appear to be, then “public” is going to become something new. One writer quipped that post-debate TV anchors are now basic for telling people what was said on Twitter during the debate. But people are not going to need this service much longer because they are engaged in the communication during the debate. They will not need What about good accounts; the accounts that follow, are fol- lowed and post messages? Table 10 gives the percentage of followers receiving messages mentioning each of the eight subjects that are good accounts. It gives the percentages for the top 200 accounts mentioning each of the eight and for 100 for each subject with approximately 1000 followers. Copyright © 2013 SciRes. 96  G. R. BOYNTON ET AL. someone to tell them what they have seen first hand. So, what should be the conclusion? What about the number of accounts? There are two estimates: Pew estimates 37 million and Semiocast estimates 170 million. Both are rough approximations. Since it is easy to find follow- ers of messages that add up to numbers in between, the two in between seems a safe estimate. What about fake accounts? For high profile communication it seems reasonable to estimate that roughly 50% of the total numbers of followers are following the top 200 users who post to Twitter, and half are following people with less stardom. The top 200 seem to have about 25% fake followers and 30% inac- tive followers. But the rest seem to have very different numbers. They are followed by very few fake accounts, and their follow- ers are overwhelmingly good, or active, user accounts. If you count only the fake followers of the top 200 then the total would be reduced by 12.5%. That could be increased to 15% or slightly more due to the fake followers of the not top 200. It looks like no more than 20% fake followers in those large numbers. So you could reduce the numbe r who saw “This seat’s taken” from 68 million to 55 million. That is still substantially more than saw the speech on TV. RT @thinkprogress is men- tioned in messages by user accounts that have 18% fake fol- lowers. That would suggest 3.9 million receiving retweets of ThinkProgress tweets instead of 4.7 million. But that is still greater than the leading lights on TV. The principal conclusion is that fake accounts are found in communication about politics. They exaggerate the number of recipients of Twitter messages because fake accounts do not read. Only the not-fakes read. However, it appears that the most one would expect is about 20%. That is a substantial number, but it is not so large that the large number of recipients of Twitter messages now looks small. The public domain is be- coming something new. REFERENCES Boynton, G. R. (2012a). It’s a global shoutout Mr. President. URL (last checked 13 November 2012). http://www.boyntons.us/website/new-media/analyses/users-baseline/ global-shoutout.html Boynton, G. R. (2012b). Voice and the Reconstruction of the Public Domain. unpublished. Boynton, G. R. (2012c). Really big Twitter numbers: the flow of com- motion/communi ca t io n. URL (last checked 20 September 2012). http://www.boyntons.us/website/new-media/analyses/really-big-num bers/tweeting-republicans-120910.html Boynton, G. R. (2012d). The reach of “This seat’s taken”. URL (last checked 6 September 2012). http://www.boyntons.us/website/new-media/analyses/seats-taken/rea ch-seats-taken.html Boynton, G. R. (2012e). Political Organizations and the Magic of Ret- weeting. URL (last checked 17 May 2012 ). http://www.boyntons.us/website/new-media/analyses/pol-groups-mul tiplier/pol-groups-retweet.html Boynton, G. R. (2012f). Triggers and Surges. URL (last checked 23 March 2012). http://www.boyntons.us/website/new-media/analyses/triggers-surges/ triggers-surges.html Cook, J. (2012). Jill Stein is the presidential candidate with the fewest fake followers on Twitter. Irregular Times, URL (last checked 27 August 2012). http://irregulartimes.com/index.php/archives/2012/08/27/jill-stein-is- the-presidential-candidate-with-the-fewest-fake-followers-on-twitter/ Dugan, L. (2012). Twitter users who see political ads are 97% more likely to visit a campaign donation page, AllTwitter. URL (last checked 12 October 2012). http://www.mediabistro.com/alltwitter/twitter-political-ads-effective ness_b29847 Fitzpatrick, A. (2012). Twitter dominated online chatter about the presidential debate, M ashable. URL (last checked 4 October 2012). http://mashable.com/2012/10/04/twitter-debate-chatter/ Fouhy, B. (2012). Republican convention ratings plummet from 2008, Huff Post Media. URL (last checked 5 September 2012) . http://www.huffingtonpost.com/2012/09/04/republican-convention-r atings_n_1852535.html Long, M. C. (2012). Twitter CEO dispels biggest micconception about Twitter and about fake followers, AllTwitter. URL (last checked 12 October 2012). http://www.mediabistro.com/alltwitter/twitter-misconception_b29863 Pew Research Center for the People & the Press (2012). In changing news landscape, even television is vulnerable. URL (last checked 27 September 2012). http://www.people-press.org/2012/09/27/in-changing-news-landscap e-even-television-is-vulnerable/ Pew Research Center (2012). Assessing the repres e nt a t iv e ne s s o f pu b li c opinion surveys. URL (last checked 15 May 2012). http://www.people-press.org/2012/05/15/assessing-the-representative ness-of-public-opinion-surveys/ PoliticusUSA Jon Stewart’s ratings are now higher than all of fox news. URL (last checked 4 June 2011). http://www.politicususa.com/jon-stewart-fox-ratings.html Semiocast (2012). Twitter reaches half a billion accounts; More than 140 millions in the U.S. URL (last checked 30 July 2012). http://semiocast.com/publications/2012_07_30_Twitter_reaches_half _a_billion_accounts_140m_in_the_US Sharp, A. (2012). Election night 2012, Twitter Blog. URL (last checked 6 November 2012). http://blog.twitter.com/2012/11/election-night-2012.html Smith, A., & Brenner, J. (2012). Twitter use 2012, Pew Research Cen- ter. URL (last checked 31 May 2012). http://pewinternet.org/Reports/2012/Twitter-Use-2012.aspx Status People (2012). Find out more. URL (last checked 22 August 2012). http://fakers.statuspeople.com/Fakers/FindOutMore/ Twitter Blog (2012). Dispatch from the Denver debate. URL (last checked 4 October 2012). http://blog.twitter.com/2012/10/dispatch-from-denver-debate.html Copyright © 2013 SciRes. 97 |