Paper Menu >>
Journal Menu >>
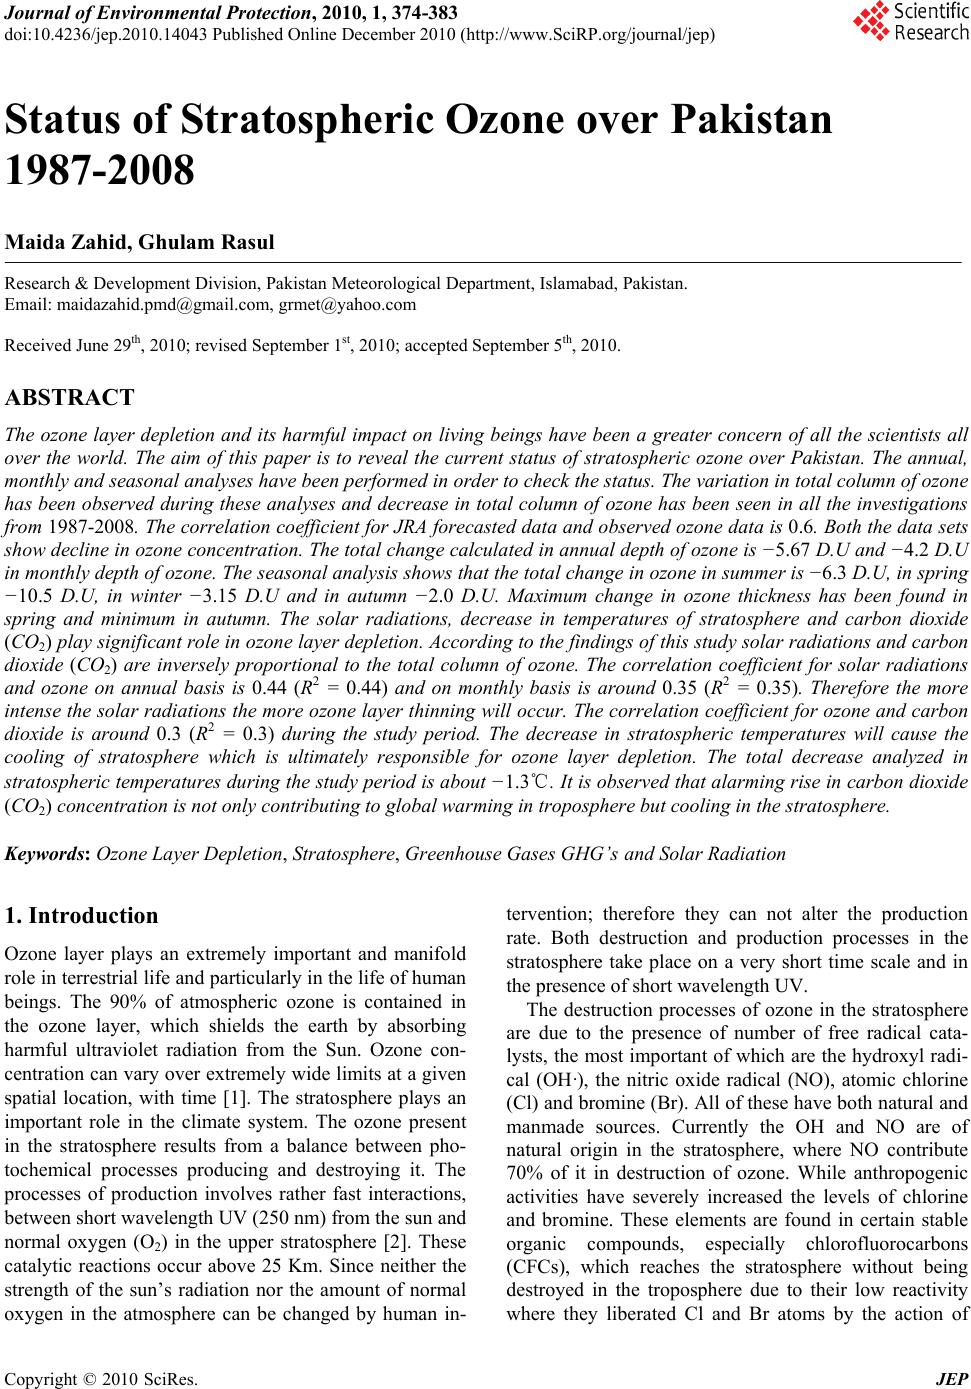 Journal of Environmental Protection, 2010, 1, 374-383 doi:10.4236/jep.2010.14043 Published Online December 2010 (http://www.SciRP.org/journal/jep) Copyright © 2010 SciRes. JEP Status of Stratospheric Ozone over Pakistan 1987-2008 Maida Zahid, Ghulam Rasul Research & Development Division, Pakistan Meteorological Department, Islamabad, Pakistan. Email: maidazahid.pmd@gmail.com, grmet@yahoo.com Received June 29th, 2010; revised September 1st, 201 0; accepted Septembe r 5th, 2010. ABSTRACT The ozone layer depletion and its harmful impact on living beings have been a greater concern of all the scientists all over the world. The aim of this paper is to reveal the current status of stratospheric ozone over Pakistan. The annual, monthly and seasonal analyses have been performed in order to check the status. The variation in total column of ozone has been observed during these analyses and decrease in total column of ozone has been seen in all the investigations from 1987-2008. Th e correlation coefficient for JRA forecasted data and ob served ozone data is 0.6. Both the data sets show decline in ozone concentration. The total change calculated in annual depth of ozone is −5.67 D.U and −4.2 D.U in monthly depth of ozone. The seasonal analysis shows that the total change in ozone in summer is −6.3 D.U, in spring −10.5 D.U, in winter −3.15 D.U and in autumn −2.0 D.U. Maximum change in ozone thickness has been found in spring and minimum in autumn. The solar radiations, decrease in temperatures of stratosphere and carbon dioxide (CO2) play significant role in o zone layer depletion. Accord ing to the findings of this stud y solar radiatio ns and carbon dioxide (CO2) are inversely proportional to the total column of ozone. The correlation coefficient for solar radiations and ozone on annual basis is 0.44 (R2 = 0.44) and on monthly basis is around 0.35 (R2 = 0.35). Therefore the more intense the solar radia tions the more ozone layer thinning will occur. The correlation coefficien t for ozone and carbon dioxide is around 0.3 (R2 = 0.3) during the study period. The decrease in stratospheric temperatures will cause the cooling of stratosphere which is ultimately responsible for ozone layer depletion. The total decrease analyzed in stratospheric temperatures during the study period is about −1.3℃. It is observed that alarming rise in carbon dioxide (CO2) concentration is not only contributing to global warming in troposphere but cooling in the stratosphere. Keywords: Oz one Layer Depletion, Stratosphere, Greenhouse Gases GH G’s and Solar Radiation 1. Introduction Ozone layer plays an extremely important and manifold role in terrestrial life and particularly in the life of human beings. The 90% of atmospheric ozone is contained in the ozone layer, which shields the earth by absorbing harmful ultraviolet radiation from the Sun. Ozone con- centration can vary over extremely wide limits at a given spatial location, with time [1]. The stratosphere plays an important role in the climate system. The ozone present in the stratosphere results from a balance between pho- tochemical processes producing and destroying it. The processes of production involves rather fast interactions, between short wavelength UV (250 nm) from the sun and normal oxygen (O2) in the upper stratosphere [2]. These catalytic reactions occur above 25 Km. Since neither the strength of the sun’s radiation nor the amount of normal oxygen in the atmosphere can be changed by human in- tervention; therefore they can not alter the production rate. Both destruction and production processes in the stratosphere take place on a very short time scale and in the presence of short wavelength UV. The destruction processes of ozone in the stratosphere are due to the presence of number of free radical cata- lysts, the most important of which are the hydroxyl radi- cal (OH·), the nitric oxide radical (NO), atomic chlorine (Cl) and bromine (Br). All of these have both na tural and manmade sources. Currently the OH and NO are of natural origin in the stratosphere, where NO contribute 70% of it in destruction of ozone. While anthropogenic activities have severely increased the levels of chlorine and bromine. These elements are found in certain stable organic compounds, especially chlorofluorocarbons (CFCs), which reaches the stratosphere without being destroyed in the troposphere due to their low reactivity where they liberated Cl and Br atoms by the action of  Status of Stratospheric Ozone over Pakistan 1987-2008 Copyright © 2010 SciRes. JEP 375 ultraviolet light as shown in Figure 1. However an in- crease of about 30% for Cl, source strength or a decrease of about 30% for NO, source strength from their current level may lead to catastrophic transition and results in a reduction of ozone concentration about 50 times [3]. The total amount of overhead ozone is an important quantity, as it determines the penetration of UV-B to the earth’s surface. Circulation disturbances change the ozone distribution by their vertical and horizontal advec- tion [4-5]. The distribution of ozone between tropopause and 30 Km is controlled by atmospheric and strato- spheric transport. Ozone is 260 D.U near the equator, while it between 300-350 D.U at mid latitudes and at poles its concentration varies from 450-500 D.U [6]. The ozone concentration is sensitive to significant daily, seasonal and interannual fluctuations and tends to be highest in late winter and early spring [7-10]. The Total Ozone Mapping Spectrometer (TOMS) satellite measurements are monitoring total ozone content (TOC) in the atmosphere nowadays. The data of ground based ozone stations supplement and refine the satellite meas- urements and yield information about regional features in TOC variations. The decrease in total ozone content has been observed over central Eurasia from 1980-2003 at an average rate of −1.29 ± 0.08 DU/ yr [11]. The ozone is transported to Pakistan atmospheric re- gions due to the geograph ical position and the large posi- tive correlation between the potential vo rticity deviations and the ozone mixing ratios in the stratosphere [12]. The ozone that has been transported to Pakistan’s atmos- pheric region by means of vertical lifting and horizontal shifting has also shown decreasing trends over Pakistan (West or Northwest of South Asia having latitude 23.45ºN-36.75ºN and longitude 61ºE and 75.5ºE) from 1979-1993 by comparing TOMS satellite data and Dob- son spectrometer ground observation data. Both the data sets have shown sharp decline in ozone layer thickness over Pakistan [13-14]. The long-term effect of ozone layer depletion appears to be an increase in the ultraviolet radiation reaching the earth. But the intensity of UV ra- diations varies with the thickness of ozone. Therefore the filtration of UV flux due to variation in ozone layer is still unanswered [1]. The effect of ozone layer depletion over marine life, forests and human beings have been studied by different scientists all over the world [15-17] But the annual, monthly and seasonal analysis of ozone layer over Pakistan using observed Dobson spectrometer data have not been do ne yet . The aim of this paper is not only to find out the annual, monthly and seasonal behavior of ozone over Pakistan but also to calculate the average change in total column ozone thickness in each of these analyses. The ozone layer thickness depends on some of the atmospheric variables like temperature and solar radiations. The stra- tosphere has been cooling in recent decades and changes in stratospheric ozone, greenhouse gases (GHG), water vapor and Sea Surface Temperatures (SSTs) all contrib- ute to this cooling [18-22]. Therefore the relations be- tween these parameters including CO2 and ozone have also been done in this study. 2. Methodology The World Meteorological Organization (WMO) has installed a Dobson Spectrophotometer at Geophysical Center, Pakistan Meteorological Department, Quetta for monitoring the data of Ozone depth for Pakistan’s at- mospheric region Figure 2. The Dobson ozone spectro- photometer measures the relative intensities of transmit- ted sunlight, at two different wavelengths in the UV, one being strongly and other being weakly absorbed by ozone to determine the total amount of ozone overhead. The real time data of mean monthly total column ozone and solar radiations for a period 1987-2008 is obtained from Geophysical Center, Quetta in order to calculate the current status of stratospheric ozone over Pakistan. The Japan Meteorological Agency (JMA) conducted the Japanese 25-year Reanalysis (JRA-25) in collabora- tion with the Central Research Institu te of Electric Power Industry (CRIEPI) and produced high quality meteoro- logical datasets for seasonal prediction models and cli- mate research use. The monthly mean values of Tem- perature at different levels (1000 hPa, 850 hPa, 700 hPa, 500 hPa, 300 hPa, 100 hPa 50 hPa and 15 hPa) and ozone has been extracted with the help of Japanese re- analysis data (JRA) for the study period using software GrADS (The Grid Analysis and Display System). The Carbon Dioxide Information Analysis Center (CDIAC) is the primary climate-change data and infor- mation analysis center of the U.S. Department of Energy (DOE) since 1982. They generate data at global, regional and national scale. Carbon dioxide emissions data for Pakistan has been obtained from Carbon dioxide Infor- mation Analysis Data Center (CDIAC) from 1987-2007. 3. Results & Discussion 3.1. Annual Analysis The annual analysis of total column ozone data has been done by generating a time series for the period 1987- 2008. The time series shows that there is a sharp decline in the thickness of ozone layer particularly from 1993 onwards over Pakistan. The time series of forecasted total column ozone Japanese Reanalysis Data (JRA) has further supported the evidence of ozone layer thinning in the region of Pakistan Figure 3. A comparison between two data sets has been made which portray a strong  Status of Stratospheric Ozone over Pakistan 1987-2008 Copyright © 2010 SciRes. JEP 376 Figure 1. Representation of the processes that determine the concentration of ozone in the atmosphere. Figure 2. Map showing the location of total ozone stations around the world.  Status of Stratospheric Ozone over Pakistan 1987-2008 Copyright © 2010 SciRes. JEP 377 Figure 3. Time series of average annual observed & JRA ozone data 1987-2008 over Pakistan. Figure 4. Inter-annual ozone anomalies 1987-2008 observed at Geophysical Center Quetta. positive correlation between observed and predicted data of ozone. The correlation coefficient for both the data sets is around 0.6 (R2 = 0.6). Figure 4 shows the change in annual depth of total column zone in the atmosphere of Pakistan. The annual ozone anomalies have been calculated with the help of observed data. The anomalies show decreasing trend of ozone and this loss in total colu mn ozone give a clue that ozone layer thickness has reduced and thinness has in- creased during the study period. The total change ob-  Status of Stratospheric Ozone over Pakistan 1987-2008 Copyright © 2010 SciRes. JEP 378 Figure 5. Monthly status of ozone over Pakistan 1987-2008. served in ozone over the last 21 years (1987-2008) is −5.67 D.U. It is assumed that this decrease can be due to huge gaseous emissions of Carbondioxide (CO2) and particularly Chlorofluorocarbons (CFC’s) which is the main cause of ozone de pl et i o n ov e r Paki st an. 3.2. Monthly Analysis The monthly analysis of ozone shows a lot of variations in ozone thickn ess throughout the year . There ar e months in which the ozone thickness remains far above the per- missible limits of ozone (i.e. 260 D.U. in tropics near equator) whereas on the other hand, there are few months when the ozone layer becomes thin and the value of ozone calculated below the 260 D.U. The highest amounts of total column ozone over Pakistan occur from March–May, the amount then starts to decrease from June–September. While the lowest amount of total col- umn ozone occurs from October–December, the amount of zone then again increases from January–February Figure 5. The wind transport of ozone is principally re- sponsible for this monthly variation of ozone patterns. Figure 6 shows the total change in thickness of monthly ozone and decreasing trend of ozone over Paki- stan’s atmosphere from 1987-2008. The monthly ozone anomalies show that ozone layer thinness has increased during the study period. The total decrease in ozone thickness is −4.2 D.U which is statistically significant at 95% confidence level. The change has been calculated with the help of straight line equation y = mx + c. In this equation multiplying ‘m’ or ‘slope’ with total number of years will give the total change during the study period. 3.3. Seasonal Analysis Pakistan has four seasons; a cool, dry winter starts from Dec and en ds in Feb; a hot dry spri n g fr om Mar to M a y ; a hot, rainy summer season or south west monsoon period from J un to Sep a nd autumn o f Oct and N ov. The behav ior of ozone varies from season to season. Since the strato- spheric ozone is produced by the UV radiation, therefore Figure 6. Ozone monthly anomalies monitored at GC Quetta from 1987-2008.  Status of Stratospheric Ozone over Pakistan 1987-2008 Copyright © 2010 SciRes. JEP 379 the highest concentration of ozone levels must be found over tropics and the lowest over the Po lar Regions which consequently lead to highest ozone level in summer and the lowest in the winter. But this is not the case; the ob- served behavior is quite different. The highest level of ozone occurs in spring not in summer and the lowest in the autumn instead of winter. Although most of the ozone is generated over tropics but its concentration is maximum at poles this is because of prevailing stratospheric wind patterns which distribute the ozone poleward and down- ward in the l ower st ratosp here. T he value of oz o ne shoul d be around 260 D. U nea r the equat or so it is a thr esh old for ozone in the tropics region Figure 7. 3.3.1. Winter In winters the concentration of ozone remains above permissible limit, i.e., 260 D.U except in 1993 the value of ozone reaches near the threshold. The highest value of ozone in winters can be observed in 1990 which is 292 D.U. (Figure 7(a)). 3.3.2. Spri ng In spring the concentration of ozone also remains above the permissible limit of 260 D.U. This shows th ickness in ozone layer over Pakistan is maximum during the season. The highest value of ozone in springs can be seen in 1991 i.e., 316 D.U. (Figure 7(b)). 3.3.3. Summer In summer season is a period of extreme high tempera- tures. The thickness of ozone is also above the threshold during summer. The peak value of ozone in summers is 292 D.U in 1990 & 2005 ( Fi gure 7(c) ). 3.3.4. Au tumn The ozone layer thinning is maximum all over the globe during autumn. The same situation can be analyzed dur- ing the autumn season in the atmosphere above Pakistan. The value of ozone reduced to a large extent and it falls below the permissible limit of 260 D.U. The lowest value of ozone in autumn is 242 D.U in 1998 (Figure 7(d)). The seasonal analysis therefore refers to the highest amount of total column ozone in spring which falls over the course of the summer to their lowest amounts in Oc- tober - November which then further rise again over the course of winter. The wind transport is the major factor responsible for the seasonal variations of ozone patterns. Besides, atmospheric circulation pattern solar intens ity is also responsible for ozone seasonal variation. Table 1 shows the change in amount of ozone during different seasons over the last 21 years. 3.5. Ozone & Solar Radiations The annual and monthly averages of solar radiations are plotted against the average observed ozone in the strato- Figure 7. Seasonal analysis of ozone in (a) winter; (b) spring; (c) summer; (d) autumn over Pakistan 1987-2008. sphere to verify their interdependence over each other. This is because solar radiation plays a vital role in sea- sonal variation of ozone. The solar radiation reaches the instrument after crossing the ozone layer. Therefore its value can give us good idea about the status of ozone measured by Dobson spectrophotometer. The plenty of Chlorine and Nitrogen compounds are produced in the me- sosphere and lower thermosphere during h igh solar activity which are responsible for ozone depletion. Figure 8(a)  Status of Stratospheric Ozone over Pakistan 1987-2008 Copyright © 2010 SciRes. JEP 380 Table 1. Change in total ozone in each season over Pakistan 1987-2008. Season 1987-2008 Winter - 3.15 D.U Spring -10.5 D.U Summer - 6.3 D. U Autumn - 2.0 D.U is a graph between annual amount of ozone and solar radiations evidently depict that when solar radiations are more intense the ozone thickness shows decrease. Where as in episodes where solar radiations are less intense the values of ozone increases. So ozone and solar radiations are inversely proportional to each other. Figure 8(b) shows the correlation between the two variables is R2 = 0.44 and statistically significant. The average monthly values of ozone and solar radia- tions demonstrate that from January to April when solar radiations are less intense the ozone thickness reaches to its high levels. But from May till December due to high intensity of so lar radiations the ozone concentration starts decreasing. The increase in solar intensity and decrease in concentration of ozone over Pakistan have been clearly illustrated in Figure 9. The correlation between the two variables, i.e., R2 = 0.35. (a) (b) Figure 8. (a) Average annual solar radiations & ozone observed at GC Quetta from1989-2008 and (b) Linear Regression. Figure 9. Average monthly solar radiations & ozone over Pakistan from 1989-2008.  Status of Stratospheric Ozone over Pakistan 1987-2008 Copyright © 2010 SciRes. JEP 381 3.6. Relation among Ozone, Temperature & Carbon Dioxide (CO2) Trends The temperature anomalies have been drawn at different levels (1000 hPa, 850 hPa, 700 hPa, 500 hPa, 300 hPa, 100 hPa 50 hPa, and 15 hPa). The temperature anomalies have shown increasing trend in temperatures till 200 hPa then from 100 hPa to 50 hP a there’s no significan t rise or decrease has been observed and at 15 hPa decreasing trend of temperatures have been noticed during the study. The temperature anomalies at 15 hPa indicate a small cooling of about −1.3℃ from 1987-2008 in the strato- sphere Figure 10. This change in temperatures at 15 hPa will change the rates of chemical reactions which are involved in the ozone layer production. Several natural and manmade factors like solar cycle, volcanic eruption, ENSO, atmospheric nuclear tests, air traffic, spring time Antarctic ozone hole and an increase in emissions of Carbon dioxide (CO2) contributes to ozone and tempera- ture variability. The ozone depletion leads to less absorption of Ultra Violet radiations from sun. Therefore the solar radiations will not convert in to heat radiations and ultimately cooling will occur in the stratosphere. On the other hand global warming induced high concentrations of Carbon dioxide (CO2) have greater warming potential so it emits heat radiations. The green house gases in troposphere trap majority of the infra red radiations within tropo- sphere. Therefore Car bon d ioxid e (CO2) emissions due to air crafts in the stratosphere will produce heat which will be larger than the energy received from troposphere hence the net energy loss results in cooling. The graph of average annual carbon dioxide and ozone shows reduc- tion in total ozone and sharp increase in carbon dioxide emissions during a study period over Pakistan. Further Figure 11(a) clearly illustrates that with the increase in CO2 emissions in the last decade the total column ozone over Pakistan has decreased. Hence reduced ozone causes the stratosphere to absorb less solar radiation, thus cooling the stratosphere while warming the troposphere. The maximum concentration of ozone appears in spring and summer and minimum concentration during winter and very less concentration during autumn. There- fore it is presumed that during spring and summer the most of the carbon dioxide is consumed by the vegetation in photosynthetic activity so less amount of carbon diox- ide got a chance to escape in to the atmosphere. So the concentration of ozone does not disturb much during summer and spring. Comparatively in autumn and winter there is less vegetation, so less consumption by the trees and more emission of carbon dioxide in the atmosphere. In autumn when ozone concentration falls below thresh- olds more ultra violet radiations reaches the earth making troposphere warmer. The carbon dioxide and ozone are inversely propor- tional to each other means that when ozone remains maximum the carbon dioxide emissions will be less and vise versa. The correlation between the average annual ozone and carbon dioxide is R2 = 0.3 which is statisti- cally significant at 95%confidence level Figure 11(b). Figure 10. Average temperature anomalies at 15 hPa over Pakistan from 1987-2008.  Status of Stratospheric Ozone over Pakistan 1987-2008 Copyright © 2010 SciRes. JEP 382 (a) (b) Figure 11. (a) Average annual carbon dioxide (CO2) emissions and ozone (O3) of Pakistan from 1987-2007; (b) Linear regres- sion. 4. Conclusions The annual, monthly and seasonal analysis of strato- spheric ozone data has been done during the study (1987- 2008). All the analysis have shown decreasing trend of stratospheric ozone supporting the evidence of ozone layer depletion over Pakistan. The change in annual depth of total column ozone is −5.67 D.U. The total de- crease found during monthly analysis is −4.2 D.U. The maximum value of ozone is observed in spring (> 260 D.U) while the lowest value of ozone is observed in au- tumn (< 260 D.U). The total change calculated in spring is −10.5 D.U, summer is −6.3 D.U, winter is −3.15 D.U and autumn is −2.0 D.U. The Japanese Reanalysis data also used to monitor ozone layer thickness therefore a comparison between observed and predicted values have been made to confirm the ozone layer is thinning over Pakistan region. Both the data sets have portrayed a cor- relation coefficient of 0.6. The average ozone has been plotted against average solar radiations for both annual and monthly analysis to figure out the mutual interde- pendence of the parameters. It is concluded that ozone and solar radiations are inversely proportional to each other. The correlation coefficient for the variables on annual basis is 0.44 and on monthly basis is 0.35. From December to April when solar radiations are less intense the ozone thickness reaches to its peak values. Whereas from May till November due to high intensity of solar radiations the concentration of ozone minimize and its concentration during October and November reduced so much that ozone reaches to its threshold values over Pakistan. The trend of small cooling has been seen in the stratosphere and the total change in temperature of stratosphere is about −1.3℃ from 1987-2008. The reason for lower temperatures of stratosphere has been related with increased carbon dioxide (CO2) emissions in the atmosphere. The correlation between ozone and carbon dioxide emissions is R2 = 0.3 which is statistically sig- nificant at 95% confidence level. The graph between ozone and carbon dioxide shows that with increasing concentration of carbon dioxide is not only contributing to global warming but also play role in ozone layer de- pletion. REFERENCES [1] M. A. K. Y. Zai, M. R. K. Ansari and J. Quamar, “Com- putation and Empirical Modeling of UV Flux Reaching Arabian Sea Due To O3 Hole,” The Arabian Journal for Science and Engineering, Vol. 33, No. 2, 2008, pp. 333- 342. [2] F. S. Rowland, “Stratospheric Ozone Depletion,” The Royal Society Publishing, London, 2006. [3] L. Chunhong, Y. Peicai and Z. Qingcun, “Nonlinear Be- havior on an Ozone Photochemical System in the Strato- sphere,” Institute of Atmospheric Physics, Chinese Aca- demy of Sciences, Vol. 40, No. 6, 1997, pp. 584-591. [4] V. Wirth, “Quasi-Stationary Planetary Waves in Total Ozone and Their Correlation with Lower Stratospheric Temperatures,” Journal of Geophysical Research, Vol. 98, No. D5, 1995, pp. 8873-8882 [5] T. G. Shepherd, “Dynamics, Stratospheric Ozone, and Climate Change,” Atmosphere-Ocean, Vol. 46, No. 1, 2008, pp. 117-138. [6] R. A. Plumb, “Stratospheric Transport,” Journal of the Meteorological Society of Japan, Vol. 80, No. 3, 2002, pp. 793-809. [7] S. H. Wayne, “Ozone and Atmospheric Transport Proc- esses,” Tellus, Vol. 18, No. 2, 1965, pp. 329-336. [8] K. Petzoldt, “The Role of Dynamics in Total Ozone De- viations from Their Long-Term Mean over the Northern Hemisphere,” Annals of Geophysics, Vol. 17, No. 2, 1999, pp. 231-241. [9] J. W. Krzyscin, “Interannual Changes in the Atmospheric Ozone Derived from Ground-Based Measurements,” Pa- pers in Meteorology and Geophysics, Vol. 43, No. 4, 1992, pp. 133-164. [10] M. L. Salby and P. F. Callaghan, “Interannual Changes of the Stratospheric Circulation: Relationship to Ozone and Tropospheric Structure,” Journal of Climate, Vol. 15, No.  Status of Stratospheric Ozone over Pakistan 1987-2008 Copyright © 2010 SciRes. JEP 383 24, pp. 3673-3685. [11] K. N. Visheratin, N. E. Kamenogradskii, V. Kashin, K. Semenov, P. Sinyakov and L. I. Sorokina, “Spectral– Temporal Structure of Variations in the Atmospheric To- tal Ozone in Central Eurasia, Izvestiya,” Atmospheric and Oceanic Physics, Vol. 42, No. 2, 2006, pp. 184-202. [12] H. A. Basset and A. Gahein, “Diagnostic Study on the Relation between Ozone and Potential Vorticity,” Atmos- fera, Vol. 16, 2002, pp. 67-82. [13] M. A. K. Y. Zai and J. Quamar, “The Study of Phe- nomenon of Ozone Layer Depletion as a Physical Proc- ess,” Indian Journal of Physics, Vol. 75B, No. 4, 2001, pp. 307-314. [14] M. A. Khan, Y. Zai, M. R. K. Ansari, J. Quamar, M. A. Husain and J. Iqbal, “Stratospheric Ozone in the Perspec- tives of Exploratory Data Analysis for Pakistan Atmos- pheric Regions,” Journal of Basic and Applied Sciences, Vol. 6, No. 1, 2010, pp. 45-49. [15] W. J. M. Marte ns, “Health Impact of Climat e Change and Ozone Depletion: An Ecoepidemiologic Modelling Ap- proach,” Environmental Health Perspectives, Vol. 6, No. (Suppl. 1), 1998, pp. 241-251. [16] J. A. Patz and J. M. Balbus, “Methods for Assessing Pub- lic Health Vulnerability to Global Climate Change,” Cli- mate Research, Vol. 6, No. 1, 1996, pp. 113-125. [17] K. Knowlton, J. E. Rosenthal, C. Hogrefe, B. Lynn, S. Gaffin, R. Goldberg, C. Rosenzweig, K. Civerolo, J. Y. Ku and P. L. Kinney, “Assessing Ozone-Related Health Impacts under a Changing Climate,” Environmental Health Perspectives, Vol. 112, No. 15, 2004, pp. 1557-1563. [18] C. Cagnazzo, C. Claud and S. Hare, “Aspects of Strato- spheric Long-Term Changes Induced by Ozone Deple- tion,” Geophysical Research Letters, Vol. 27, 2006, pp. 101-111. [19] V. Ramaswamy, M. L. Chanin, J. Angell, J. Barnett, D. Gaffen, M. Gelman, P. Keckhut, Y. Koshelkov, K. Labitzke, J. J. R. Lin, A. O’Neill, J. Nash, W. Randel, R. Rood, K. Shine, M. Shiotani and R. Swinbank, “Strato- spheric Temperature Trends: Observations and Model Simulations,” Reviews of Geophysics, Vol. 39, No. 1, 2001, pp. 71-122. [20] K. P. Shine, et al., “A Comparison of Model Simulated Trend in Stratospheric Temperature,” Quarterly Journal of the Royal Meteorological Society, Vol. 129, No. 594, 2003, pp. 1569-1588. [21] U. Langematz, “An Estimate of the Impact of Observed Ozone Losses on Stratospheric Temperature,” Geophysi- cal Research Letters, Vol. 27, No. 14, 2000, pp. 2077- 2080. [22] E. Manzini, B. Steil, C. Bruhl, M.A Giorgetta and K. Kruger, “A New Interactive Chemistry-Climate Model: 2. Sensitivity of the Middle Atmosphere to Ozone Depletion and Increase in Greenhouse Gases and Implications for Recent Stratospheric Cooling,” Journal of Geophysical Research, Vol. 108, No. (D14), 2003, p. 4429. |