Paper Menu >>
Journal Menu >>
 Journal of Environmental Protection, 2010, 1, 362-373 doi:10.4236/jep.2010.14042 Published Online December 2010 (http://www.SciRP.org/journal/jep) Copyright © 2010 SciRes. JEP Cytochrome P450 Induction and Gene Expression in Channel Catfish (Ictalurus punctatus) Following Wastewater Treatment Plant Effluent Exposure in Field and Laboratory Settings Alicia Whatley1*, In Ki Cho1, Christi Magrath1, Paul M. Stewart1, Robert W. Li2 1Department of Biological and Environmental Sciences, Troy University, Troy, USA; 2Bovine Functional Genomics Laboratory, USDA, Beltsville, USA. Email: awhatley@troy.edu. Received July 16th, 2010; revised August 26th, 2010; accepted August 30th, 2010. ABSTRACT The objectives of this study were as follows: 1) to establish a baseline ethoxyresorufin-O-deethylase (EROD) activity level in channel catfish (Ictalurus punctatus), 2) to assess changes in induction of cytochrome P450 enzyme in channel catfish following exposure to creek water at the discharge point from the Troy (Alabama) Wastewater Treatment Plant (TWWTP) compared to upstream samples from Walnut Creek, 3) to compare EROD activity in populations maintained in laboratory and field settings, and 4) to quantify cytochrome P450 gene expression. Enzyme activity was measured fluorometrically and CYP1 gene expression was analyzed by quantitative real-time reverse transcription polymerase chain reaction. A mean EROD baseline was established at 0.03 nmol/min/µg of protein. The overall mean field effluent (TF) EROD had a significant 5-fold increase over field upstream (UF) exposed catfish; and overall mean laboratory effluent (TL) exposed catfish EROD had a significant 1.8-fold increase over laboratory upstream (UL) exposed catfish. Field exposures generally showed more robust enzyme induction over laboratory exposures on all sampling days. Ex- pression of the CYP1B gene following TF exposure was 6-fold over UF. Results suggested that in situ exposure to wastewater pollutants using caged test organisms provided a much more sensitive local monitor of pollutant exposure and biological impact than ex situ toxicological studies. Keywords: EROD, CYP1B, Molecular Biomarker, Channel Catfish, Liver Monooxygenases, MFO 1. Introduction Measurements of molecular biomarkers are useful for determining the impact of water-borne contaminants on living organisms in the aquatic environment. The use of biomarkers also addresses some of the disadvantages of other water quality assessment techniques, such as the ineffectiveness of chemical and physical analyses to deal with dilution and dispersion of chemicals in the ambient environment that reduce concentrations below analytical detection limits [1]. Since the ambient environment may also alter the availability of chemicals for uptake by liv- ing organisms [2], the complexity of chemical mixtures, distribution, and interactions with other environmental factors makes it difficult to estimate the impacts of pol- lutants on living organisms. Although the problem with mixtures may be addressed through use of bioassess- ments, these studies primarily examine a single end point, such as reproduction, lethality (as LC50), and behavioral changes; and while these are clearly defined and fre- quently used, they may be inadequate in terms of sensi- tivity, duration, and accuracy [3]. Because of their fo- cus on the toxicity of pollutants [4], bioassessments may miss subtle metabolic changes that can be picked up by molecular biomarkers. One important and useful molecular biomarker is in- duction of cytochrome P450 (CYP1) enzyme, measured as ethoxyresorufin-O-deethylase (EROD) activity, which is involved in metabolism of a variety of drugs and xe- nobiotics, such as polycyclic chlorinated biphenyls (PCBs) [5] and polycyclic aromatic hydrocarbons (PAHs) This article is sponsored by a Troy University Faculty Development t 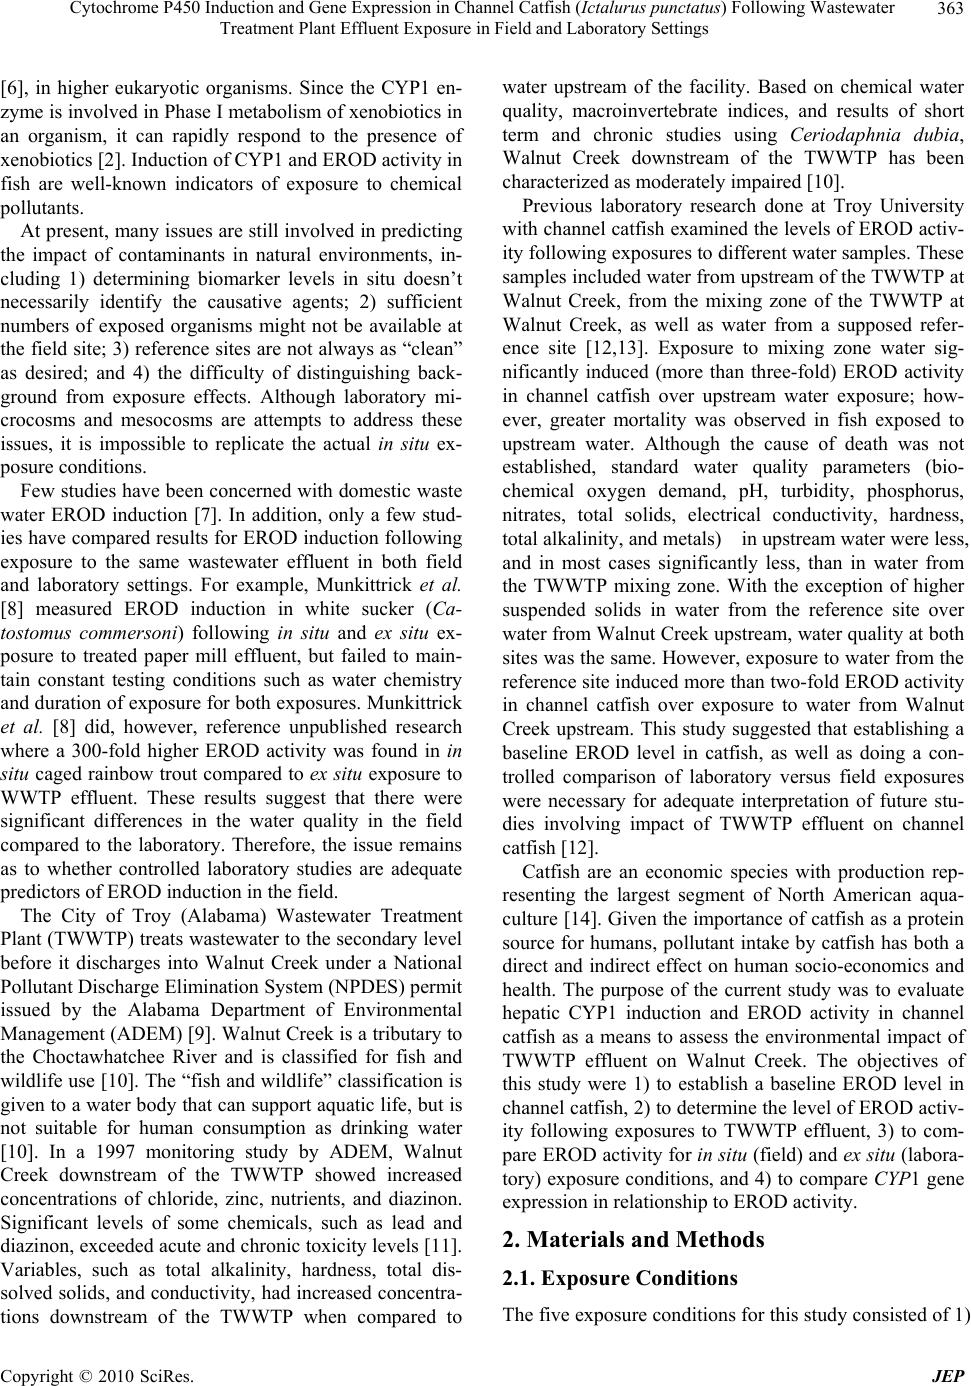 Cytochrome P450 Induction and Gene Expression in Channel Catfish (Ictalurus punctatus) Following Wastewater Treatment Plant Effluent Exposure in Field and Laboratory Settings Copyright © 2010 SciRes. JEP 363 [6], in higher eukaryotic organisms. Since the CYP1 en- zyme is involved in Phase I metabolism of xenobiotics in an organism, it can rapidly respond to the presence of xenobiotics [2]. Induction of CYP1 and EROD activity in fish are well-known indicators of exposure to chemical pollutants. At present, many issues are still involved in predicting the impact of contaminants in natural environments, in- cluding 1) determining biomarker levels in situ doesn’t necessarily identify the causative agents; 2) sufficient numbers of exposed organisms might not be available at the field site; 3) reference sites are not always as “clean” as desired; and 4) the difficulty of distinguishing back- ground from exposure effects. Although laboratory mi- crocosms and mesocosms are attempts to address these issues, it is impossible to replicate the actual in situ ex- posure conditions. Few studies have been concerned with domestic waste water EROD induction [7]. In addition, only a few stud- ies have compared results for EROD induction following exposure to the same wastewater effluent in both field and laboratory settings. For example, Munkittrick et al. [8] measured EROD induction in white sucker (Ca- tostomus commersoni) following in situ and ex situ ex- posure to treated paper mill effluent, but failed to main- tain constant testing conditions such as water chemistry and duration of exposure for both exposures. Munkittrick et al. [8] did, however, reference unpublished research where a 300-fold higher EROD activity was found in in situ caged rainbow trout compared to ex situ exposure to WWTP effluent. These results suggest that there were significant differences in the water quality in the field compared to the laboratory. Therefore, the issue remains as to whether controlled laboratory studies are adequate predictors of EROD induction in the field. The City of Troy (Alabama) Wastewater Treatment Plant (TWWTP) treats wastewater to the secondary level before it discharges into Walnut Creek under a National Pollutant Discharge Elimination System (NPDES) permit issued by the Alabama Department of Environmental Management (ADEM) [9]. Walnut Creek is a tributary to the Choctawhatchee River and is classified for fish and wildlife use [10]. The “fish and wildlife” classification is given to a water body that can support aquatic life, but is not suitable for human consumption as drinking water [10]. In a 1997 monitoring study by ADEM, Walnut Creek downstream of the TWWTP showed increased concentrations of chloride, zinc, nutrients, and diazinon. Significant levels of some chemicals, such as lead and diazinon, exceeded acute and chronic toxicity levels [11]. Variables, such as total alkalinity, hardness, total dis- solved solids, and conductivity, had increased concentra- tions downstream of the TWWTP when compared to water upstream of the facility. Based on chemical water quality, macroinvertebrate indices, and results of short term and chronic studies using Ceriodaphnia dubia, Walnut Creek downstream of the TWWTP has been characterized as moderately impaired [10]. Previous laboratory research done at Troy University with channel catfish examined the levels of EROD activ- ity following exposures to different water samples. These samples included water from upstream of the TWWTP at Walnut Creek, from the mixing zone of the TWWTP at Walnut Creek, as well as water from a supposed refer- ence site [12,13]. Exposure to mixing zone water sig- nificantly induced (more than three-fold) EROD activity in channel catfish over upstream water exposure; how- ever, greater mortality was observed in fish exposed to upstream water. Although the cause of death was not established, standard water quality parameters (bio- chemical oxygen demand, pH, turbidity, phosphorus, nitrates, total solids, electrical conductivity, hardness, total alkalinity, and metals) in upstream water were less, and in most cases significantly less, than in water from the TWWTP mixing zone. With the exception of higher suspended solids in water from the reference site over water from Walnut Creek upstream, water quality at both sites was the same. However, exposure to water from the reference site induced more than two-fold EROD activity in channel catfish over exposure to water from Walnut Creek upstream. This study suggested that establishing a baseline EROD level in catfish, as well as doing a con- trolled comparison of laboratory versus field exposures were necessary for adequate interpretation of future stu- dies involving impact of TWWTP effluent on channel catfish [12]. Catfish are an economic species with production rep- resenting the largest segment of North American aqua- culture [14]. Given the importance of catfish as a protein source for humans, pollutant intake by catfish has both a direct and indirect effect on human socio-economics and health. The purpose of the current study was to evaluate hepatic CYP1 induction and EROD activity in channel catfish as a means to assess the environmental impact of TWWTP effluent on Walnut Creek. The objectives of this study were 1) to establish a baseline EROD level in channel catfish, 2) to determine the level of EROD activ- ity following exposures to TWWTP effluent, 3) to com- pare EROD activity for in situ (field) and ex situ (labora- tory) exposure conditions, and 4) to compare CYP1 gene expression in relationship to EROD activity. 2. Materials and Methods 2.1. Exposure Conditions The five exposure conditions for this study consisted of 1) 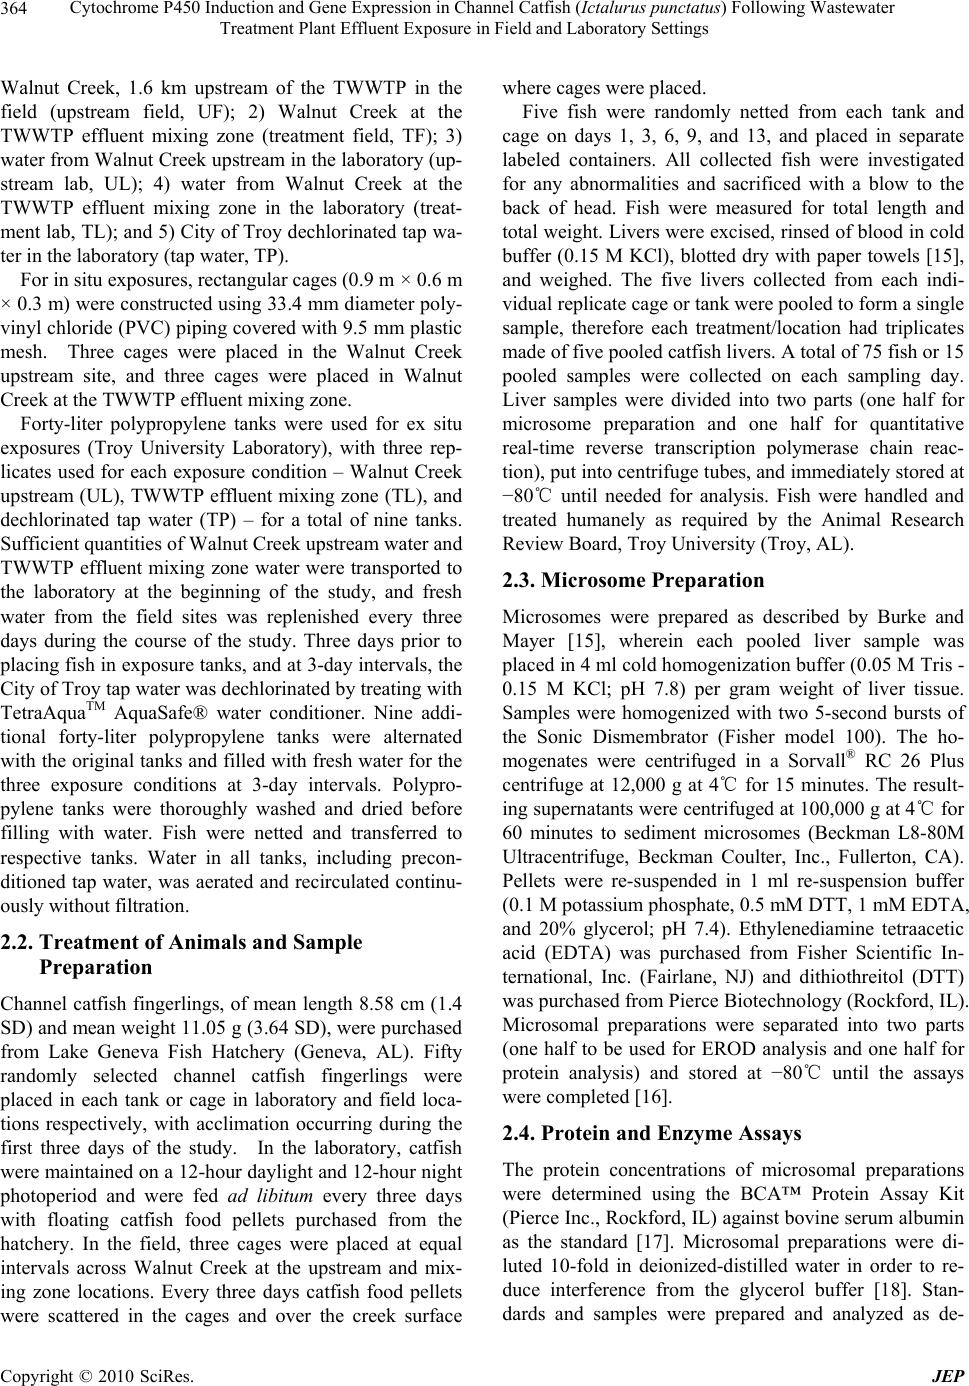 Cytochrome P450 Induction and Gene Expression in Channel Catfish (Ictalurus punctatus) Following Wastewater Treatment Plant Effluent Exposure in Field and Laboratory Settings Copyright © 2010 SciRes. JEP 364 Walnut Creek, 1.6 km upstream of the TWWTP in the field (upstream field, UF); 2) Walnut Creek at the TWWTP effluent mixing zone (treatment field, TF); 3) water from Walnut Creek upstream in the laboratory (up- stream lab, UL); 4) water from Walnut Creek at the TWWTP effluent mixing zone in the laboratory (treat- ment lab, TL); and 5) City of Troy dechlorinated tap wa- ter in the laboratory (tap water, TP). For in situ exposures, rectangular cages (0.9 m × 0.6 m × 0.3 m) were constructed using 33.4 mm diameter poly- vinyl chloride (PVC) piping covered with 9.5 mm plastic mesh. Three cages were placed in the Walnut Creek upstream site, and three cages were placed in Walnut Creek at the TWWTP effluent mixing zone. Forty-liter polypropylene tanks were used for ex situ exposures (Troy University Laboratory), with three rep- licates used for each exposure condition – Walnut Creek upstream (UL), TWWTP effluent mixing zone (TL), and dechlorinated tap water (TP) – for a total of nine tanks. Sufficient quantities of Walnut Creek upstream water and TWWTP effluent mixing zone water were transported to the laboratory at the beginning of the study, and fresh water from the field sites was replenished every three days during the course of the study. Three days prior to placing fish in exposure tanks, and at 3-day intervals, the City of Troy tap water was dechlorinated by treating with TetraAquaTM AquaSafe® water conditioner. Nine addi- tional forty-liter polypropylene tanks were alternated with the original tanks and filled with fresh water for the three exposure conditions at 3-day intervals. Polypro- pylene tanks were thoroughly washed and dried before filling with water. Fish were netted and transferred to respective tanks. Water in all tanks, including precon- ditioned tap water, was aerated and recirculated continu- ously without filtration. 2.2. Treatment of Animals and Sample Preparation Channel catfish fingerlings, of mean length 8.58 cm (1.4 SD) and mean weight 11.05 g (3.64 SD), were purchased from Lake Geneva Fish Hatchery (Geneva, AL). Fifty randomly selected channel catfish fingerlings were placed in each tank or cage in laboratory and field loca- tions respectively, with acclimation occurring during the first three days of the study. In the laboratory, catfish were maintained on a 12-hour daylight and 12-hour night photoperiod and were fed ad libitum every three days with floating catfish food pellets purchased from the hatchery. In the field, three cages were placed at equal intervals across Walnut Creek at the upstream and mix- ing zone locations. Every three days catfish food pellets were scattered in the cages and over the creek surface where cages were placed. Five fish were randomly netted from each tank and cage on days 1, 3, 6, 9, and 13, and placed in separate labeled containers. All collected fish were investigated for any abnormalities and sacrificed with a blow to the back of head. Fish were measured for total length and total weight. Livers were excised, rinsed of blood in cold buffer (0.15 M KCl), blotted dry with paper towels [15], and weighed. The five livers collected from each indi- vidual replicate cage or tank were pooled to form a single sample, therefore each treatment/location had triplicates made of five pooled catfish livers. A total of 75 fish or 15 pooled samples were collected on each sampling day. Liver samples were divided into two parts (one half for microsome preparation and one half for quantitative real-time reverse transcription polymerase chain reac- tion), put into centrifuge tubes, and immediately stored at −80℃ until needed for analysis. Fish were handled and treated humanely as required by the Animal Research Review Board, Troy University (Troy, AL). 2.3. Microsome Preparation Microsomes were prepared as described by Burke and Mayer [15], wherein each pooled liver sample was placed in 4 ml cold homogenization buffer (0.05 M Tris - 0.15 M KCl; pH 7.8) per gram weight of liver tissue. Samples were homogenized with two 5-second bursts of the Sonic Dismembrator (Fisher model 100). The ho- mogenates were centrifuged in a Sorvall® RC 26 Plus centrifuge at 12,000 g at 4℃ for 15 minutes. The result- ing supernatants were centrifuged at 100,000 g at 4℃ for 60 minutes to sediment microsomes (Beckman L8-80M Ultracentrifuge, Beckman Coulter, Inc., Fullerton, CA). Pellets were re-suspended in 1 ml re-suspension buffer (0.1 M potassium phosphate, 0.5 mM DTT, 1 mM EDTA, and 20% glycerol; pH 7.4). Ethylenediamine tetraacetic acid (EDTA) was purchased from Fisher Scientific In- ternational, Inc. (Fairlane, NJ) and dithiothreitol (DTT) was purchased from Pierce Biotechnology (Rockford, IL). Microsomal preparations were separated into two parts (one half to be used for EROD analysis and one half for protein analysis) and stored at −80℃ until the assays were completed [16]. 2.4. Protein and Enzyme Assays The protein concentrations of microsomal preparations were determined using the BCA™ Protein Assay Kit (Pierce Inc., Rockford, IL) against bovine serum albumin as the standard [17]. Microsomal preparations were di- luted 10-fold in deionized-distilled water in order to re- duce interference from the glycerol buffer [18]. Stan- dards and samples were prepared and analyzed as de- 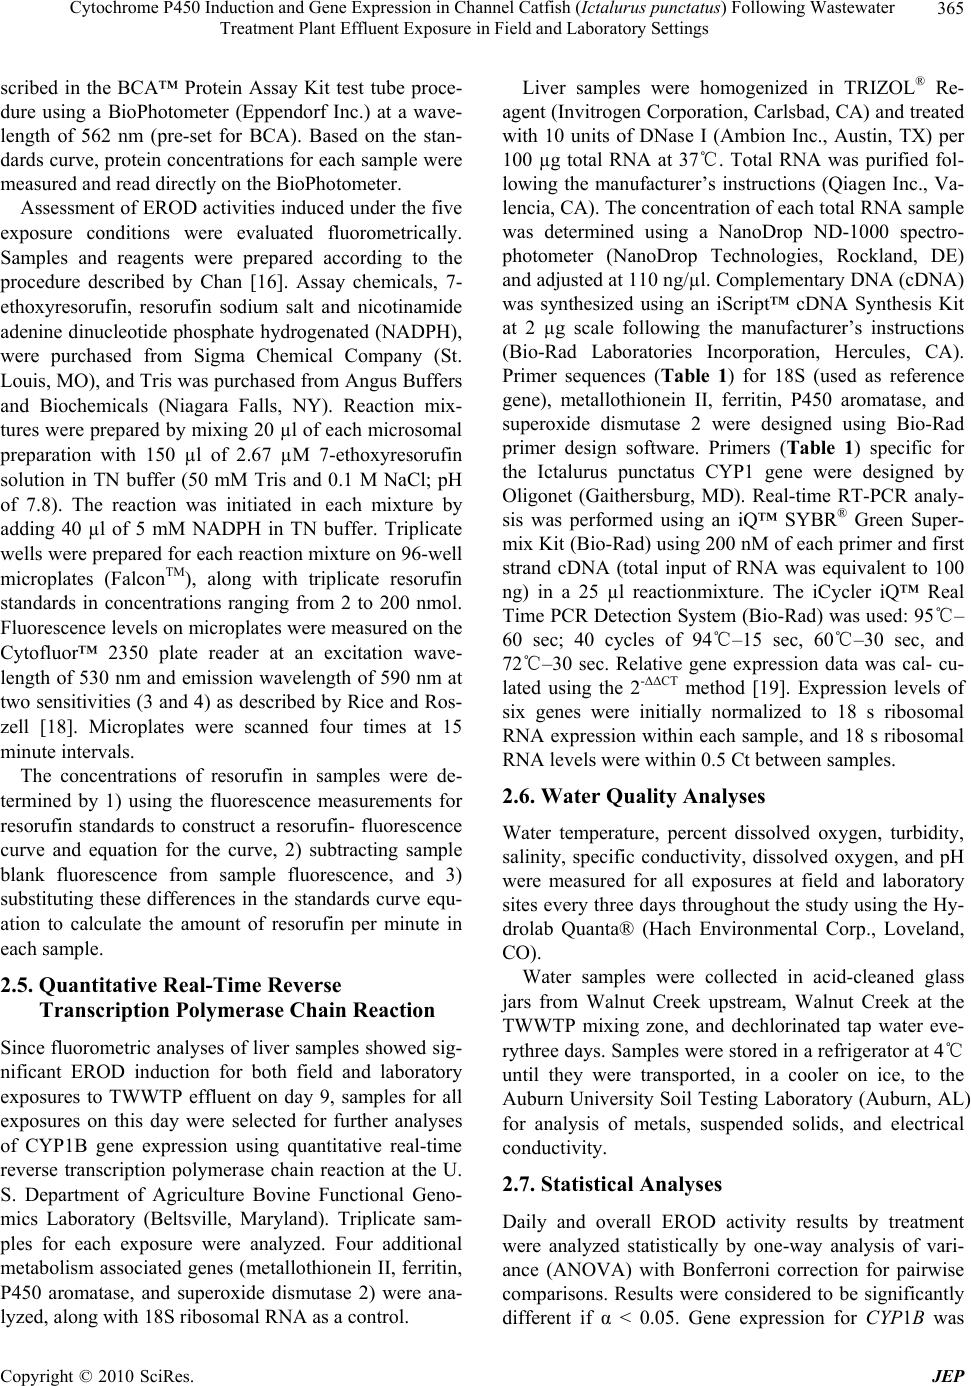 Cytochrome P450 Induction and Gene Expression in Channel Catfish (Ictalurus punctatus) Following Wastewater Treatment Plant Effluent Exposure in Field and Laboratory Settings Copyright © 2010 SciRes. JEP 365 scribed in the BCA™ Protein Assay Kit test tube proce- dure using a BioPhotometer (Eppendorf Inc.) at a wave- length of 562 nm (pre-set for BCA). Based on the stan- dards curve, protein concentrations for each sample were measured and read directly on the BioPhotometer. Assessment of EROD activities induced under the five exposure conditions were evaluated fluorometrically. Samples and reagents were prepared according to the procedure described by Chan [16]. Assay chemicals, 7- ethoxyresorufin, resorufin sodium salt and nicotinamide adenine dinucleotide phosphate hydrogenated (NADPH), were purchased from Sigma Chemical Company (St. Louis, MO), and Tris was purchased from Angus Buffers and Biochemicals (Niagara Falls, NY). Reaction mix- tures were prepared by mixing 20 µl of each microsomal preparation with 150 µl of 2.67 µM 7-ethoxyresorufin solution in TN buffer (50 mM Tris and 0.1 M NaCl; pH of 7.8). The reaction was initiated in each mixture by adding 40 µl of 5 mM NADPH in TN buffer. Triplicate wells were prepared for each reaction mixture on 96-well microplates (FalconTM), along with triplicate resorufin standards in concentrations ranging from 2 to 200 nmol. Fluorescence levels on microplates were measured on the Cytofluor™ 2350 plate reader at an excitation wave- length of 530 nm and emission wavelength of 590 nm at two sensitivities (3 and 4) as described by Rice and Ros- zell [18]. Microplates were scanned four times at 15 minute intervals. The concentrations of resorufin in samples were de- termined by 1) using the fluorescence measurements for resorufin standards to construct a resorufin- fluorescence curve and equation for the curve, 2) subtracting sample blank fluorescence from sample fluorescence, and 3) substituting these differences in the standards curve equ- ation to calculate the amount of resorufin per minute in each sample. 2.5. Quantitative Real-Time Reverse Transcription Polymerase Chain Reaction Since fluorometric analyses of liver samples showed sig- nificant EROD induction for both field and laboratory exposures to TWWTP effluent on day 9, samples for all exposures on this day were selected for further analyses of CYP1B gene expression using quantitative real-time reverse transcription polymerase chain reaction at the U. S. Department of Agriculture Bovine Functional Geno- mics Laboratory (Beltsville, Maryland). Triplicate sam- ples for each exposure were analyzed. Four additional metabolism associated genes (metallothionein II, ferritin, P450 aromatase, and superoxide dismutase 2) were ana- lyzed, along with 18S ribosomal RNA as a control. Liver samples were homogenized in TRIZOL® Re- agent (Invitrogen Corporation, Carlsbad, CA) and treated with 10 units of DNase I (Ambion Inc., Austin, TX) per 100 µg total RNA at 37℃. Total RNA was purified fol- lowing the manufacturer’s instructions (Qiagen Inc., Va- lencia, CA). The concentration of each total RNA sample was determined using a NanoDrop ND-1000 spectro- photometer (NanoDrop Technologies, Rockland, DE) and adjusted at 110 ng/µl. Complementary DNA (cDNA) was synthesized using an iScript™ cDNA Synthesis Kit at 2 µg scale following the manufacturer’s instructions (Bio-Rad Laboratories Incorporation, Hercules, CA). Primer sequences (Table 1) for 18S (used as reference gene), metallothionein II, ferritin, P450 aromatase, and superoxide dismutase 2 were designed using Bio-Rad primer design software. Primers (Table 1) specific for the Ictalurus punctatus CYP1 gene were designed by Oligonet (Gaithersburg, MD). Real-time RT-PCR analy- sis was performed using an iQ™ SYBR® Green Super- mix Kit (Bio-Rad) using 200 nM of each primer and first strand cDNA (total input of RNA was equivalent to 100 ng) in a 25 µl reactionmixture. The iCycler iQ™ Real Time PCR Detection System (Bio-Rad) was used: 95℃– 60 sec; 40 cycles of 94℃–15 sec, 60℃–30 sec, and 72℃–30 sec. Relative gene expression data was cal- cu- lated using the 2-ΔΔCT method [19]. Expression levels of six genes were initially normalized to 18 s ribosomal RNA expression within each sample, and 18 s ribosomal RNA levels were within 0.5 Ct between samples. 2.6. Water Quality Analyses Water temperature, percent dissolved oxygen, turbidity, salinity, specific conductivity, dissolved oxygen, and pH were measured for all exposures at field and laboratory sites every three days throughout the study using the Hy- drolab Quanta® (Hach Environmental Corp., Loveland, CO). Water samples were collected in acid-cleaned glass jars from Walnut Creek upstream, Walnut Creek at the TWWTP mixing zone, and dechlorinated tap water eve- rythree days. Samples were stored in a refrigerator at 4℃ until they were transported, in a cooler on ice, to the Auburn University Soil Testing Laboratory (Auburn, AL) for analysis of metals, suspended solids, and electrical conductivity. 2.7. Statistical Analyses Daily and overall EROD activity results by treatment were analyzed statistically by one-way analysis of vari- ance (ANOVA) with Bonferroni correction for pairwise comparisons. Results were considered to be significantly different if α < 0.05. Gene expression for CYP1B was 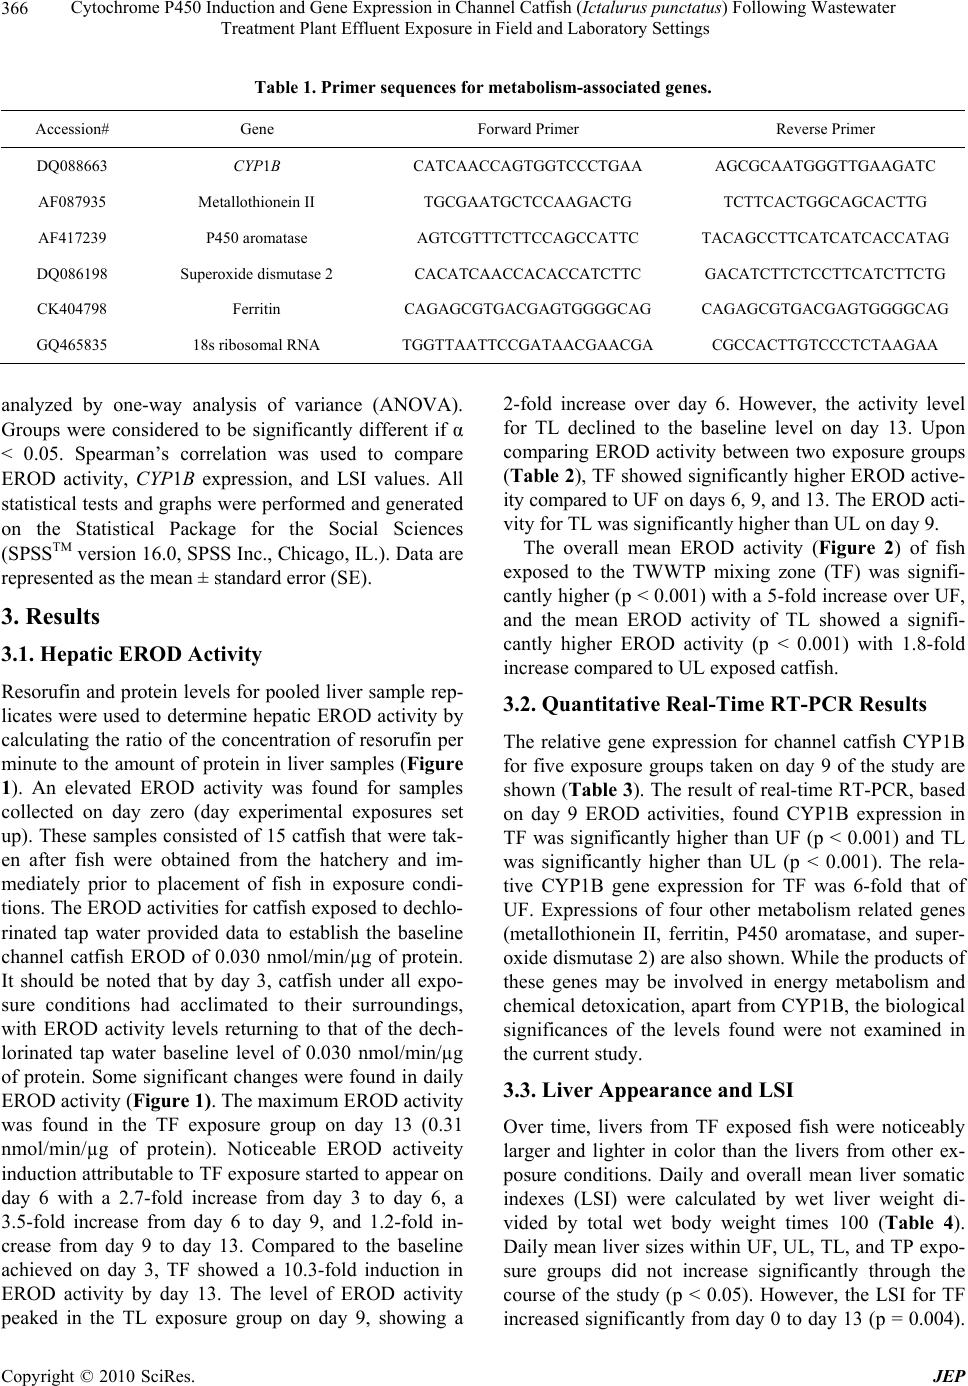 Cytochrome P450 Induction and Gene Expression in Channel Catfish (Ictalurus punctatus) Following Wastewater Treatment Plant Effluent Exposure in Field and Laboratory Settings Copyright © 2010 SciRes. JEP 366 Table 1. Primer sequences for metabolism-associated genes. Accession# Gene Forward Primer Reverse Primer DQ088663 CYP1B CATCAACCAGTGGTCCCTGAA AGCGCAATGGGTTGAAGATC AF087935 Metallothionein II TGCGAATGCTCCAAGACTG TCTTCACTGGCAGCACTTG AF417239 P450 aromatase AGTCGTTTCTTCCAGCCATTC TACAGCCTTCATCATCACCATAG DQ086198 Superoxide dismutase 2 CACATCAACCACACCATCTTC GACATCTTCTCCTTCATCTTCTG CK404798 Ferritin CAGAGCGTGACGAGTGGGGCAG CAGAGCGTGACGAGTGGGGCAG GQ465835 18s ribosomal RNA TGGTTAATTCCGATAACGAACGA CGCCACTTGTCCCTCTAAGAA analyzed by one-way analysis of variance (ANOVA). Groups were considered to be significantly different if α < 0.05. Spearman’s correlation was used to compare EROD activity, CYP1B expression, and LSI values. All statistical tests and graphs were performed and generated on the Statistical Package for the Social Sciences (SPSSTM version 16.0, SPSS Inc., Chicago, IL.). Data are represented as the mean ± standard error (SE). 3. Results 3.1. Hepatic EROD Activity Resorufin and protein levels for pooled liver sample rep- licates were used to determine hepatic EROD activity by calculating the ratio of the concentration of resorufin per minute to the amount of protein in liver samples (Figure 1). An elevated EROD activity was found for samples collected on day zero (day experimental exposures set up). These samples consisted of 15 catfish that were tak- en after fish were obtained from the hatchery and im- mediately prior to placement of fish in exposure condi- tions. The EROD activities for catfish exposed to dechlo- rinated tap water provided data to establish the baseline channel catfish EROD of 0.030 nmol/min/µg of protein. It should be noted that by day 3, catfish under all expo- sure conditions had acclimated to their surroundings, with EROD activity levels returning to that of the dech- lorinated tap water baseline level of 0.030 nmol/min/µg of protein. Some significant changes were found in daily EROD activity (Figure 1). The maximum EROD activity was found in the TF exposure group on day 13 (0.31 nmol/min/µg of protein). Noticeable EROD activeity induction attributable to TF exposure started to appear on day 6 with a 2.7-fold increase from day 3 to day 6, a 3.5-fold increase from day 6 to day 9, and 1.2-fold in- crease from day 9 to day 13. Compared to the baseline achieved on day 3, TF showed a 10.3-fold induction in EROD activity by day 13. The level of EROD activity peaked in the TL exposure group on day 9, showing a 2-fold increase over day 6. However, the activity level for TL declined to the baseline level on day 13. Upon comparing EROD activity between two exposure groups (Table 2), TF showed significantly higher EROD active- ity compared to UF on days 6, 9, and 13. The EROD acti- vity for TL was significantly higher than UL on day 9. The overall mean EROD activity (Figure 2) of fish exposed to the TWWTP mixing zone (TF) was signifi- cantly higher (p < 0.001) with a 5-fold increase over UF, and the mean EROD activity of TL showed a signifi- cantly higher EROD activity (p < 0.001) with 1.8-fold increase compared to UL exposed catfish. 3.2. Quantitative Real-Time RT-PCR Results The relative gene expression for channel catfish CYP1B for five exposure groups taken on day 9 of the study are shown (Table 3). The result of real-time RT-PCR, based on day 9 EROD activities, found CYP1B expression in TF was significantly higher than UF (p < 0.001) and TL was significantly higher than UL (p < 0.001). The rela- tive CYP1B gene expression for TF was 6-fold that of UF. Expressions of four other metabolism related genes (metallothionein II, ferritin, P450 aromatase, and super- oxide dismutase 2) are also shown. While the products of these genes may be involved in energy metabolism and chemical detoxication, apart from CYP1B, the biological significances of the levels found were not examined in the current study. 3.3. Liver Appearance and LSI Over time, livers from TF exposed fish were noticeably larger and lighter in color than the livers from other ex- posure conditions. Daily and overall mean liver somatic indexes (LSI) were calculated by wet liver weight di- vided by total wet body weight times 100 (Table 4). Daily mean liver sizes within UF, UL, TL, and TP expo- sure groups did not increase significantly through the course of the study (p < 0.05). However, the LSI for TF increased significantly from day 0 to day 13 (p = 0.004).  Cytochrome P450 Induction and Gene Expression in Channel Catfish (Ictalurus punctatus) Following Wastewater Treatment Plant Effluent Exposure in Field and Laboratory Settings Copyright © 2010 SciRes. JEP 367 Figure 1. Daily mean hepatic ethoxyresorufin-O-deethylase activity (EROD) for samples from channel catfish exposed to Walnut Creek Upstream (UF) and Walnut Creek at the Troy Wastewater Treatment Plant effluent mixing zone (TF) in the field setting, and Walnut Creek Upstream (UL), Walnut Creek at Troy Wastewater Treatment Plant effluxent mixing zone (TL), and dechlorinated tap water (TP) in the laboratory setting. Unexposed samples were taken after catfish were obtained from the hatchery and prior to any study exposure conditions. Data represent the mean for three replicates (consisting of five pooled livers) ± SE. Figure 2. Overall mean hepatic EROD activity for channel catfish following exposure to five different exposure conditions (UF, TF, UL, TL, and TP). Data represent the mean ± SE and are expressed as nmol/min/µg of protein. Exposures sharing a common letter indicates a statistical significant difference between means (ANOVA, p < 0.05).  Cytochrome P450 Induction and Gene Expression in Channel Catfish (Ictalurus punctatus) Following Wastewater Treatment Plant Effluent Exposure in Field and Laboratory Settings Copyright © 2010 SciRes. JEP 368 Table 2. Statistical comparisons using ANOVA of daily he- patic ethoxyresorufin O-deethylase activity (EROD) (nmol/ min/µg protein) in channel catfish following exposure: Walnut Creek upstream in field (UF) vs. Walnut Creek at the TWWTP effluent mixing zone in field (TF), Walnut Creek upstream in field (UF) vs. Walnut Creek upstream in laboratory (UL), Walnut Creek at the TWWTP effluent mixing zone in laboratory (TL) vs. Walnut Creek upstream in laboratory (UL), and Walnut Creek at the TWWTP ef- fluent mixing zone in laboratory (TL) vs. Walnut Creek at the TWWTP effluent mixing zone in field (TF). Data are shown as the mean differences (ANOVA significance in parentheses). TF vs. UF UF vs. UL TL vs. UL TF vs. TL Day 1 0.127 (0.001) 0.035 (0.001) 0.000 (1.000) 0.162 (0.001) Day 3 0.000 (1.000) 0.000 (1.000) 0.000 (1.000) 0.000 (1.000) Day 6 0.050 (0.013) 0.000 (1.000) 0.000 (1.000) 0.050 (0.013) Day 9 0.230 (0.001) 0.010 (1.000) 0.034 (0.001) 0.197 (0.001) Day 13 0.287 (0.001) 0.000 (1.000) 0.000 (1.000) 0.280 (0.001) When overall mean LSI between exposures were com- pared, TF had a significantly higher LSI compared to all other exposures (p = 0.025). A comparison of EROD activity, CYP1B expression, and LSI for day 9 exposures (Figure 3), showed that there was a significant positive relationship between EROD activity and LSI (p = 0.012), while other combinations were not correlated (p > 0.05). 3.4. Water Quality Water quality data are shown (Table 5). While the cur- rent study did not focus on identification of causal agents, comparisons of water quality (inorganics and physical properties) at the Walnut Creek upstream (UF), TWWTP effluent mixing zone (TF), and tap water (TP) revealed that Walnut Creek upstream contained the highest con- centrations of magnesium, aluminum, iron, and manga- nese. Water from the TWWTP effluent mixing zone contained the highest concentrations of sodium, calcium, potassium, nitrate, boron, phosphate, and suspended sol- ids, along with the highest dissolved oxygen, specific conductance, and temperature. Although tap water generally contained the lowest concentrations of every variable tested, tap water pH was the highest for samples taken. The freshwater Criterion Continuous Concentrations (CCC) [11] for aluminum and trivalent chromium were exceeded by all samples. The freshwater Criteria Maximum Concentration [11] for lead was also exceeded by all samples. Figure 3. Comparison of day 9 hepatic samples for LSI, CYP1B gene expression, and EROD activity fol- lowing Walnut Creek Upstream (UF) and Walnut Creek at the Troy Wastewater Treatment Plant ef- Sfluent mixing zone (TF) in the field setting, and Walnut Creek Upstream (UL), Walnut Creek at Troy Wastewater Treatment Plant effluent mixing zone (TL), and dechlorinated tap water (TP) in the labo- ratory setting exposures.  Cytochrome P450 Induction and Gene Expression in Channel Catfish (Ictalurus punctatus) Following Wastewater Treatment Plant Effluent Exposure in Field and Laboratory Settings Copyright © 2010 SciRes. JEP 369 Table 3. Relative expressionsa of metabolism-associated genes determined by real-time RT-PCR for hepatic samples from channel catfish exposed to Walnut Creek Upstream (UF) and Walnut Creek at the Troy Wastewater Treatment Plant efflux- ent mixing zone (TF) in the field setting, and Walnut Creek Upstream (UL), Walnut Creek at Troy Wastewater Treatment Plant effluent mixing zone (TL), and dechlorinated tap water (TP) in the laboratory setting. Data represent the mean fold change ± SE. Exposure Group CYP1B Metallothionein II Ferritin P450 aromatase Superoxide dismutase 2 UF 0.59 (0.10)b 0.34 (0.050) 1.26 (0.203) 1.67 (0.081) 0.45 (0.086) TF 3.60 (0.87)b 0.71 (0.106) 0.52 (0.023) 1.39 (0.142) 1.77 (0.413) UL 1.21 (0.11)c 0.81 (0.050) 0.84 (0.057) 2.77 (0.222) 3.81 (0.859) TL 1.38 (0.16)c 2.24 (0.144) 1.72 (0.218) 1.69 (0.139) 1.26 (0.170) TP 1.10 (0.11) 1.16 (0.146) 1.03 (0.067) 1.08 (0.102) 1.28 (0.253) aGene expression data were normalized with the 18S reference gene; bSignificantly different (ANOVA, p < 0.001); cSignificantly different (ANOVA, p < 0.001). Table 4. Liver Somatic Indexes for channel catfish following UF, TF, UL, TL and TP exposures. Data represent the mean for three replicates (consisting of 5 livers pooled) ± SE. UF TF UL TL TP DAY 1 Exposure 0.916 (0.040) 0.823 (0.026) 0.657 (0.018) 0.849 (0.019) 0.664 (0.043) DAY 3 Exposure 0.725 (0.018) 0.658 (0.006) 0.698 (0.080) 0.829 (0.014) 0.911 (0.054) DAY 6 Exposure 0.672 (0.008) 0.823 (0.041) 0.698 (0.080) 0.999 (0.055) 0.826 (0.065) DAY 9 Exposure 0.642 (0.027) 1.324 (0.063)a 0.815 (0.036) 0.879 (0.020) 0.907 (0.068) DAY 13 Exposure 0.724 (0.001) 1.460 (0.047) a 0.974 (0.023) 0.920 (0.028) 1.001 (0.011) Mean Overall LSI 0.736 (0.035) 1.018 (0.094) 0.768 (0.063) 0.895 (0.035) 0.862 (0.060) Mean Difference: Day 0b to Day 130.046 0.781c 0.295 0.241 0.323 aSignificantly higher than UF on same day of exposure (ANOVA, p < 0.05; bDay 0 mean LSI was 0.679 ± SE; cSignificantly higher than Day 0 mean LSI (ANOVA, p < 0.001) 4. Discussion Some of the earliest changes to occur in an organism following exposure to an environmental pollutant occur at the cellular level as a result of xenobiotic and molecu- lar interactions. Many of these effects can be indicated by changes in physiological parameters that may serve as sentinels of environmental pollution by organic chemi- cals, metals, and various other stressors. These bio- markers of chemical contamination can include altera- tions in the structural integrity of the cellular membrane, interference with the involvement of macromolecules in metabolic processes, alterations in genetic material and gene expression, inhibition or induction of certain en- zyme activity, activation of the immune system, and in- terference with the regulation of cell growth [21-25]. Wastewater treatment plant effluent has been exten- sively studied due to its complex chemistry and direct impact on the ecology of surrounding water resources [20]. However, determining the nature of this impact on native species for a specific area in a timely manner re- mains an important issue for risk management. This is certainly a concern for Walnut Creek which receives discharges from TWWTP and is potential habitat for channel catfish. Although several studies have investigated induction of EROD in channel catfish in response to known toxic chemicals or environmental pollutants [26-29], little or no attention has been given to establishing the baseline EROD activity level in channel catfish in the field. Stud- ies have mainly focused on increased “fold-induction” of EROD in experimental groups compared to a controlled group [28,29], or simply the level or presence of EROD activity [26,27]. In a previous study [13] using EROD as a biomarker of exposure and impact of TWWTP effluent, the use of upstream exposures suggested that components of up- stream water and effluent produced synergistic effects that were beyond control, making it difficult to assess the impact of the effluent itself. The use of what was previ-  Cytochrome P450 Induction and Gene Expression in Channel Catfish (Ictalurus punctatus) Following Wastewater Treatment Plant Effluent Exposure in Field and Laboratory Settings Copyright © 2010 SciRes. JEP 370 Table 5. Water chemistry for samples collected from Walnut Creek (UF), TWWTP effluent mixing zone (TF), and tap water (TP). (Values represent the mean for five sampling days - 1, 3, 6, 9, and 13 - with standard error in parentheses). Parameters UF TF TP Calcium (ppm) 10.52 (0.500) 76.24 (9.730) 1.00 (0.300) Potassium (ppm) 0.62 (0.049) 12.52 (2.020) 0.55 (0.080) Magnesium (ppm) 0.18 (0.058) < 0.10 < 0.10 Phosphate (ppm) < 0.10 1.20 (0.095) 0.06 (0.024) Aluminum (ppm) 0.50 (0.16) 0.48 (0.240) 0.10 (0.077) Arsenic (ppm) < 0.10 < 0.10 < 0.10 Boron (ppm) < 0.10 0.52 (0.049) 0.15 (0.022) Cadmium (ppm) < 0.10 < 0.10 < 0.10 Chromium (ppm) 0.22 (0.091) 0.28 (0.097) 0.25 (0.050) Copper (ppm) 0.02 (0.020) < 0.10 0.02 (0.020) Iron (ppm) 1.12 (0.150) 0.08 (0.037) 0.05 (0.039) Manganese (ppm) 0.18 (0.058) < 0.10 < 0.10 Sodium (ppm) 1.58 (0.037) 204.10 (31.080) 67.00 (1.270) Nickel (ppm) < 0.10 0.04 (0.040) 0.03 (0.019) Lead (ppm) 0.6 (0.260) 0.94 (0.210) 0.63 (0.280) Zinc (ppm) < 0.10 < 0.10 < 0.10 Nitrate (ppm) 0.26 (0.040) 3.12 (0.900) 0.13 (0.019) ECa (mmhos/cm) 0.07 (0.004) 0.98 (0.096) 0.28 (0.0067) SSb (ppm) 52.36 (2.240) 683.20 (67.050) 192.50 (4.700) pH 7.64 (0.052) 8.08 (0.028) 8.42 (0.083) ously considered a reference site with relatively low pol- lutants, actually induced higher EROD than the effluent. Not only did this study point to the need to establish a baseline EROD level in catfish, but it also pointed out the challenges of using a reference site for cohort studies. In the present study, initial overall EROD activity on day 0 was high (Figure 1) for unexposed fish sampled prior to initiation of exposures for the study. These data may be attributed to the stresses caused by confinement, handling, anoxia, and transportation from the hatchery to the testing sites [2,30,31]. The current study focused on eliminating or reducing the influence of unknown identi- ties and quantities of chemicals on EROD induction by using dechlorinated tap water to establish a baseline EROD level in channel catfish. Juvenile fingerlings were used to avoid age and sex-linked variations, as they have shown higher EROD activities with less discrepancy between both sexes than adult fish [32]. After catfish acclimated to their surroundings by day 3, EROD for TP exposed fish was 0.03 nmol/min/µg of protein and re- mained constant throughout the study. As with the 5-fold EROD increase in fish exposed to water at the TWWTP effluent mixing zone compared to Walnut Creek upstream of the facility, a field study con- ducted by Gagne and Blaise [33] on rainbow trout ex- posed to pulp and paper mill secondary wastewater treatment plant effluent water found a similarly elevated 9.4-fold EROD induction. Our data demonstrated that TWWTP effluent significantly impacted EROD induc- tion in both field and laboratory scenarios. However, the greater EROD levels and fold differences found in in situ exposures suggest that EROD-inducing volatiles may be present in field exposures that are lost as water samples are transported to the laboratory. Although it is not known which specific chemicals in TWWTP effluent mixing zone water caused induction of EROD activity, it can be deduced from the data that WWTP effluent contributed to the effect. The water  Cytochrome P450 Induction and Gene Expression in Channel Catfish (Ictalurus punctatus) Following Wastewater Treatment Plant Effluent Exposure in Field and Laboratory Settings Copyright © 2010 SciRes. JEP 371 sample collected at TWWTP effluent mixing zone ex- ceeded standards for certain metals (aluminum, chro- mium, and lead) [11]. The levels of some metals (such as calcium, potassium, boron, sodium, and lead), phosphate, and nitrate were found to be higher in TF than UF, but other studies have shown that these chemicals can be antagonistic to EROD induction [8]. Moreover, of the other metabolic enzymes measured in the study, metal- lothionein II, ferritin, and P450 aromatase levels were less in TF than other exposures (Table 3). Therefore, the higher EROD levels in TF exposed fish, despite higher levels of these potentially antagonistic materials, sug- gested that there must be greater and effective levels of other inorganic and organic EROD inducing pollutants present. In further support of this reasoning, noticeable anatomical changes in the livers (enlarged and pale color) as well as higher LSI in catfish exposed to Walnut Creek were found at the effluent mixing zone. The liver somatic index is known to be sensitive to pollutants, and LSI increases due to organisms’ efforts to detoxify the intake of such toxins as polychlorinated bi- phenyls (PCBs) and polyaromatic hydrocarbons (PAHs) [34]. Although identification of the cause for LSI changes was not within the scope of this study, the higher LSIs in TF compared to all other exposures, suggests that it was due to the higher concentration of pollutants in TWWTP effluent. Moreover, since Vosylienė [35] showed that LSI of fish exposed to a mixture of heavy metals (composite of copper, zinc, nickel, chromium, lead, cadmium, and magnesium) either decreased or showed no effect on LSI, our conclusion that there must be high levels of other inorganic and organic EROD inducing pollutants in TWWTP effluent is further supported. When all aspects of ex situ and in situ setting expo- sures in our study were compared, it was found that in situ exposures provided several advantages over the ex situ setting. Using caged catfish of standard size and known exposure history in situ made it easier to normal- ize data; it was not necessary to transport large quantities of water to a different location; and the issue of having to recreate or maintain the water quality and conditions of the field location was eliminated. In our comparison of field and laboratory data for dai- ly and overall EROD activity, LSI and CYP1B gene ex- pression, TF was found to be significantly higher for all parameters compared to TL and UF was higher than UL. These results emphasize the robustness of field expo- sures compared to using laboratory microcosms and me- socosms. 5. Conclusions The use of biomarkers has been validated as a diagnostic tool for monitoring ecosystem health [2]. Biomarkers directly assess the impact of contaminants on biological systems. Monod [36] has suggested that CYP1 induction could be used as an early warning sign for more serious environmental effects, ranging from aquatic contamina- tion to biological alterations in exposed organisms. Al- though CYP1 was classically recognized as specifically induced by polycyclic aromatic hydrocarbons (PAHs) and pesticide exposure, it is now known that it is not specific for one unique class of pollutants; it can be used as a biomarker to monitor the ecological risk of various chemicals in the environment [2,36]. The determination of baseline EROD activity level in channel catfish can have immediate application in water quality assessment where the goal is to determine if EROD levels are due to exposure to the contaminants and not inherent levels that exist within the species. Ra- ther than selecting channel catfish from a reference site, which may have questionable levels of pollution or con- tamination, the established EROD baseline can serve as the reference. Also, an established baseline EROD in- duction can be useful for monitoring for slight distur- bances in the environment [37]. An induced level of EROD activity does not predict whether a single environmental contaminant will have a negative impact on the organism, since organisms are capable of further processing chemicals to be inactivated and/or eliminated from the body. Therefore, future stud- ies are needed to determine relationships between the ranges of EROD activities – from those levels that reflect normal activity and are no threat to the survival of the organisms, to those that do indicate adverse effects – and toxic effects beyond the molecular level. Troy Wastewater Treatment Plant effluent water in- duced significant EROD activity in channel catfish and combined with the liver somatic index, water chemistry, and physical changes, these data suggest that the pollut- ants in the TWWTP effluent may pose a possible threat to the survival of organisms and to the integrity of the Walnut Creek ecosystem. Our study also draws attention to the inadequacy of relying on exposing aquatic organ- isms (such as Daphnia and fathead minnows) in labora- tory settings to assess the toxicity of wastewater rather than using in situ exposures that are much more indica- tive of the actual impact of contaminants at the site. Consequently we suggest that EROD or other molecular biomarkers be included in requirements for water quality assessment, even when the contributors to these water bodies are considered to have relatively low toxicity; particularly as these biomarkers could serve as early warnings for more serious biological impact.  Cytochrome P450 Induction and Gene Expression in Channel Catfish (Ictalurus punctatus) Following Wastewater Treatment Plant Effluent Exposure in Field and Laboratory Settings Copyright © 2010 SciRes. JEP 372 6. Acknowledgements This study was funded by a faculty development grant from Troy University (Troy, Alabama). REFERENCES [1] M. L. Haasch, R. Prince, P. J. Wejksnora, K. R. Cooper and J. J. Lech, “Caged and Wild Fish: Induction of He- patic Cytochrome P-450 (CYP1A1) as an Environmental Bio- monitor,” Environmental Toxicology and Chemistry, Vol. 12, No. 5, pp. 885-895, 1993. [2] J. C. Amiard, T. Caquet, and L. Lagadic, “Use of Bio- Markers for Environmental Quality Assessment,” CRC Press, London, 2000. [3] M. Parveen, Y. Momose, E. Kitagawa, S. Kurita, O. Ko- dama and H. Iwahashi, “Bioassay of Pesticide Lindane Using Yeast-DNA Microarray Technology,” Chem-Bio In- formatics Journal, Vol. 3, No. 1, 2003, pp. 12-29. [4] Murata, S. Murata-Mizukami, E. Kitagawa, H. Iwahashi and K. Takamizawa, “The Evaluation of Environmental Waters Using Yeast DNA Microarray,” Chem-Bio Infor- matics Journal, Vol. 6, No. 2, 2003, pp. 29-46. [5] C. M. Brumley, V. S. Haritos, J. T. Ahokas and D. A. Holdway, “Validation of Biomarkers of Marine Pollution Exposure in Sand Flathead Using Aroclor 1254,” Aquatic Toxicology, Vol. 31, No. 3, 1995, pp. 249-262. [6] P. A. van Veld, D. J. Westbrook, B. R. Woodin, R. C. Hale, C. L. Smith, R. J. Huggett and J. J. Stegeman, “In- duced Cytochrome P-450 in Intestine and Liver of Spot (Leiostomus xanthurus ) from a Polycyclic Aromatic Hy- drocarbon Contaminated Environment,” Aquatic Toxicol- ogy, Vol. 17, No. 2, 1990, pp. 119-132. [7] B. Hoeger, M. R. van der Heuvel, B. C. Hitzfeld and D. R. Dietrich, “Effects of Treated Sewage Effluent on Immune Function in Rainbow Trout (Oncorhynchus mykiss),” Aquatic Toxicology, Vol. 70, No. 4, 2004, pp. 345-355. [8] K. R. Munkittrick, G. J. van Der Kraak, M. E. McMaster, C. B. Portt, M. R. van der Heuvel and M. R. Servos, “Survey of Receiving-Water Environmental Impacts As- sociated with Discharges from Pulp Mills,” Environ- mental Toxicology and Chemistry, Vol. 13, No. 7, 1994, pp. 1089-1101. [9] ADEM (Alabama Department of Environmental Man- agement), “Water Quality Program, Admin. Code R. 335-6-6 et seq., ” Montgomery, Alabama, 2007. [10] ADEM (Alabama Department of Environmental Man- agement), Environmental Indicators Section, Field Opera- tions Division, “Water quality assessment, Walnut Creek, Troy, Alabama, Pike County,” Montgomery, Alabama, 1997. [11] U.S EPA (Environmental Protection Agency), National Recommended Water Quality Criteria, 2009. http://www. epa.gov/waterscience/criteria/wqctable/#cmc [12] S. S. Bhattarai, “Induction of Cytochrome P450 in Chan- nel Catfish (Ictalurus punctatus) Following Exposure to Troy (Alabama) Waste Water Treatment Plant Effluent,” M.S. thesis. Troy University, Troy, 2005. [13] A. Whatley, P. M. Stewart, S. S. Bhattarai and C. Ma- grath, “Cytochrome P450 in Channel Catfish (Ictalurus punctatus) Following Exposure to Troy (Alabama) Waste Water Treatment Plant Effluent,” Aquatic Ecosystem Health and Management, Vol. 12, No. 2, 2009, pp. 206- 214. [14] R. W. Li and G. C. Waldbieser, “Genomic Organization and Expression of the Natural Killer Cell Enhancing Fac- tor (NKEF) Gene in Channel Catfish, Ictalurus punctatus (Rafinesque),” Fish & Shellfish Immunology, Vol. 20, No. 1, 2006, pp. 72-82. [15] M. D. Burk and R. T. Mayer, “Ethoxyresorufin: Direct Fluorimetric Assay of a Microsomal O-Dealkylation Which is Preferentially Inducible by 3-Methylcholanthrene,” Drug Metabolism and Disposi- tion, Vol. 2, No. 6, 1974, pp. 583-588. [16] K. M. Chan, “Kinetic Cytofluor EROD Assay for Micro- Somes in 48-Well Plates,” 2005. http://www.bch.cuhk. edu.hk/webct/ens4310/kmc/erod_assay.html [17] E. Stephensen, M. Adolfsson-Erici, M. Celander, M. Hu- lander, J. Parkkonen, T. Hegelund, J. Sturve, L. Hassel- berg, M. Bengtsson and L. Förlin, “Biomarker Responses and Chemical Analyses in Fish Indicate Leakage of Poly- Cyclic Aromatic Hydrocarbons and Other Compounds from Car Tire Rubber,” Environmental Toxicology and Chemis- try, Vol. 22, No. 12, 2003, pp. 2926-2931. [18] C. D. Rice and L. E. Roszell, “Tributyltin Modulates 3,3’,4,4’,5-Pentachlorobiphenyl (PCB-12 6)-Induced He- patic CYP1A Activity in Channel Catfish, Ictalurus punc- tatus,” Journal of Toxicology and Environmental Health A, Vol. 55, No. 3, 1998, pp. 197-212. [19] K. J. Livak and T. D. Schmittgen, “Analysis of Relative Gene Expression Data Using Real-Time Quantitative PCR and the 2-ΔΔCT Method,” Methods, Vol. 25, 2001, pp. 402-408. [20] W. J. Birge, J. A. Blac, T. M. Short and A. G. Wester- man, “A Comparative Ecological and Toxicological In- ves- tigation of a Secondary Wastewater Treatment Plant Efflux- ent and Its Receiving Stream,” Environmental Toxicology and Chemistry, Vol. 8, No. 5, 1989, pp. 437- 450. [21] R. M. Maier, I. L. Pepper and C P. Gerba, “Environ- mental Microbiology,” Academic Press, Burlington, 2009. [22] A. M. El-Shehawi, F. K. Ali and M. A. Seehy, “Estima- tion of Water Pollution by Genetic Biomarkers in Tilapia and Catfish Species Shows Species-Site Interaction,” Af- rican Journal of Biotechnology, Vol. 6, No. 7, 2007, pp. 840-846. [23] D. Nadeau, S. Corneau, I. Plante, G. Morrow and R. M. Tanguay, “Evaluation for HSP 70 as a Biomarker of Ef- fect of Pollutants on the Earthworm Lumbricus terrestri,” Cell Stress and Chaperones, Vol. 6, No. 2, 2001, pp. 153-163.  Cytochrome P450 Induction and Gene Expression in Channel Catfish (Ictalurus punctatus) Following Wastewater Treatment Plant Effluent Exposure in Field and Laboratory Settings Copyright © 2010 SciRes. JEP 373 [24] D. Schlenk, M. Chelius, S. K. Wolford and K. M. Chan, “Characterization of Hepatic Metallothionein Expression in Channel Catfish (Ictalurus punctatus) by Reverse- Transcriptase Polymerase Chain Reaction,” Biomarkers, Vol. 2, No. 3, 1997, pp. 161-167. [25] P. J. Kloepper-Sams and E. Benton, “Exposure of Fish to Biologically Treated Bleached-Kraft Effluent. 2. Induc- tion of Hepatic Cytochrome P450 in Mountain Whitefish (Prosopium williamsoni) and Other Species,” Environ- mental Toxicology and Chemistry, Vol. 13, No. 9, 1994, pp. 1483-1497. [26] J. M. Grizzle, S. A. Horowitz and D. R. Strength, “Caged Fish as Monitors of Pollution: Effects of Chlorinated Ef- fluxent from a Wastewater Treatment Plant,” Journal of the American Water Resources Association, Vol. 24, No. 5, 1988, pp. 951-959. [27] M. O. James, A. H. Altman, K. Morris, K. M. Kleinow and Z. Tong, “Dietary Modulation of Phase 1 and Phase 2 Activities with Benzo(A)Pyrene and Related Compounds in the intestine But Not the Liver of the Channel Catfish, Ictalurus punctatus,” Drug Metabolism and Disposition, Vol. 25, No. 3, 1997, pp. 346-354. [28] D. E. Watson, W. Reichert and R. T. Di Giulio, “Induc- tion of Hepatic CYP1A in Channel Catfish Increases Binding of 2-Aminoanthracene to DNA in Vitro and in Vivo,” Carcinogenesis, Vol. 19, No. 8, 1998, pp. 1495- 1501. [29] K. L. Willett, P. R. Gardinali, L. A. Lienesch and R. T. Di Giulio, “Comparative Metabolism and Excretion of Benzo(A)Pyrene in 2 Species of Ictalurid Catfish,” Toxi- cological Sciences, Vol. 58, No. 1, 2000, pp. 68-76. [30] R. Soimasuo, L. Jokinen and J. Kukkonen, “Biomarker Responses along a Pollution Gradient: Effects of Pulp Mill Effluents on Caged Whitefish,” Aquatic Toxicology, Vol. 31, No. 3, 1995, pp. 329-346. [31] M. Celander, “Impact of Stress on Animal Toxicology,” In: P. H. M. Balm, Ed., Stress Physiology in Animals, Sheffield Academic Press, Sheffield, 1999, pp. 246-279. [32] T. K. Collier, B. F. Anulacion and J. E. Stein, “A Field Evolution of Cytochrome p4501A as a Biomarker of Contaminant Exposure in Three Species of Flatfish,” En- vironmental Toxicology and Chemistry, Vol. 14, 1995, pp. 143-152. [33] F. Gagne and C. Blaise, “Hepatic Metallothionein Level and Mixed Function Oxidase Activity in Fingerling Rainbow Trout (Oncorhynchus mykiss) after Acute Ex- posure to Pulp Mill Effluents,” Water Resesearch, Vol. 27, No. 11, 1993, pp. 1669-1682. [34] J. F. Crivello, “Liver-Somatic Index,” 2009. http://estuary. uconn.edu/EWP6.html [35] M. Z. Vosylienė, “Distinctive Features of Changes in Biological Parameters of Rainbow Trout Exposed to Heavy Metal Model Mixture,” Ekologija, Vol. 48, No. 2, 2002, pp. 22-25. [36] G. Monod, “L’induction du Cytochrome P4501A1 chez les Poissons,” In: L. Lagadic, T. Caquet, J. C. Amiard and F. Ramade, Eds., Biomarqueurs en Ecotoxicologie: Aspects Foundamentaux, Paris, 1997, pp. 33-54. [37] U. Kammann, T. Lang, M. Vobach, and W. Wosniok, “Ethoxyresorufin-O-deethylase (EROD) Activity in Dab (Limanda limanda) as Biomarker for Marine Monitor- ing,” Environmental Science and Pollution Research, Vol. 12, No. 3, 2005, pp. 140-145. |