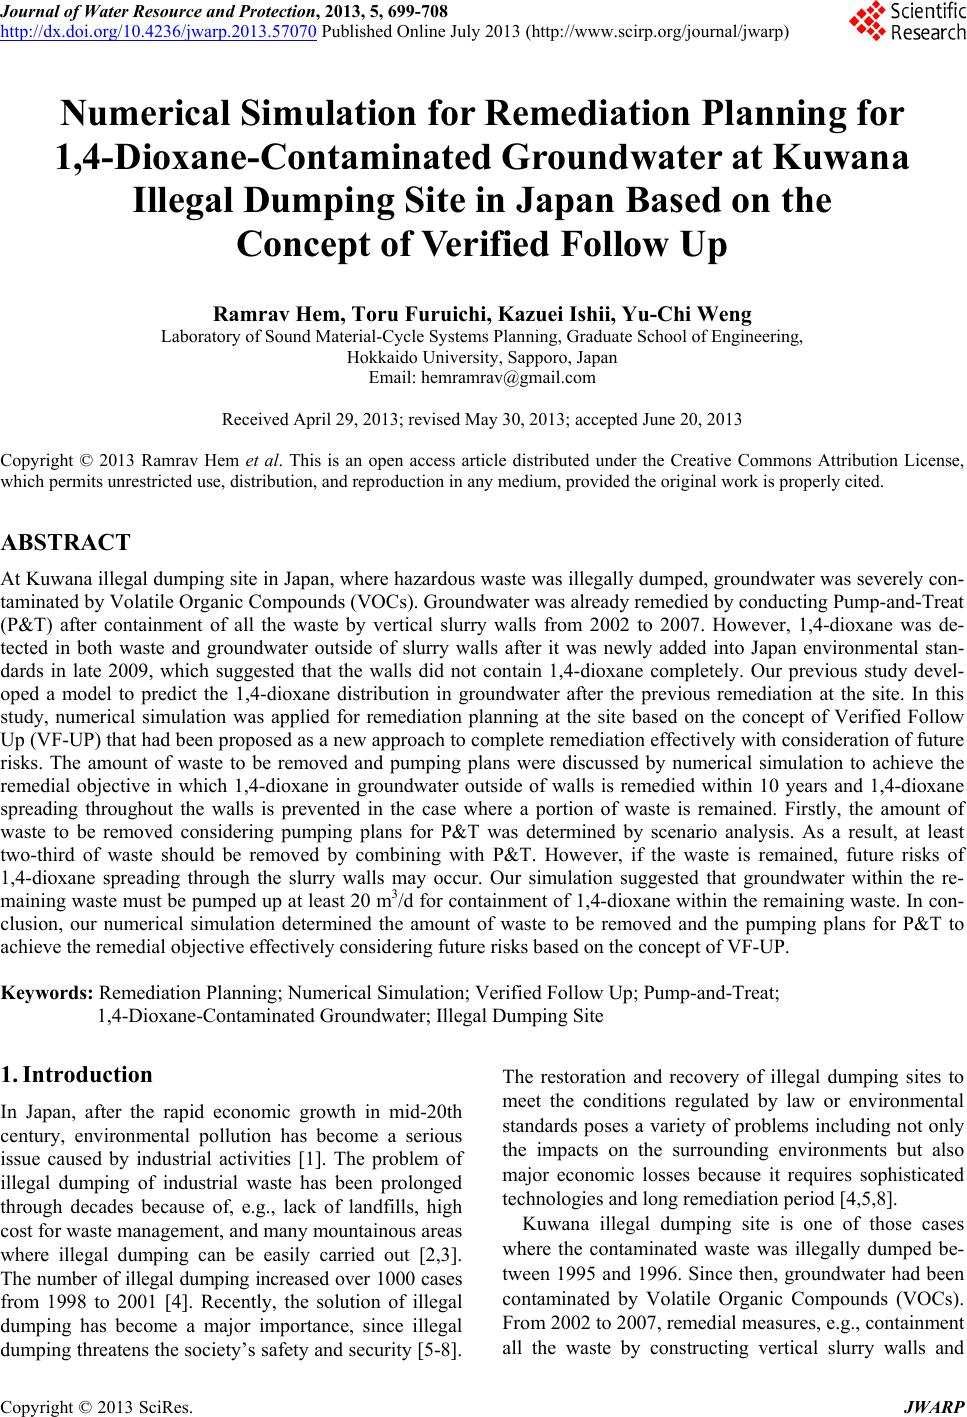
 Journal of Water Resource and Protection, 2013, 5, 699-708 http://dx.doi.org/10.4236/jwarp.2013.57070 Published Online July 2013 (http://www.scirp.org/journal/jwarp) Numerical Simulation for Remediation Planning for 1,4-Dioxane-Contaminated Groundwater at Kuwana Illegal Dumping Site in Japan Based on the Concept of Verified Follow Up Ramrav Hem, Toru Furuichi, Kazuei Ishii, Yu-Chi Weng Laboratory of Sound Material-Cycle Systems Planning, Graduate School of Engineering, Hokkaido University, Sapporo, Japan Email: hemramrav@gmail.com Received April 29, 2013; revised May 30, 2013; accepted June 20, 2013 Copyright © 2013 Ramrav Hem et al. This is an open access article distributed under the Creative Commons Attribution License, which permits unrestricted use, distribution, and reproduction in any medium, provided the original work is properly cited. ABSTRACT At Kuwana illegal dumping site in Japan, where hazardous waste was illegally dumped, groundwater was severely con- taminated by Volatile Organic Compounds (VOCs). Groundwater was already remedied by conducting Pump-and-Treat (P&T) after containment of all the waste by vertical slurry walls from 2002 to 2007. However, 1,4-dioxane was de- tected in both waste and groundwater outside of slurry walls after it was newly added into Japan environmental stan- dards in late 2009, which suggested that the walls did not contain 1,4-dioxane completely. Our previous study devel- oped a model to predict the 1,4-dioxane distribution in groundwater after the previous remediation at the site. In this study, numerical simulation was applied for remediation planning at the site based on the concept of Verified Follow Up (VF-UP) that had been proposed as a new approach to complete remediation effectively with consideration of future risks. The amount of waste to be removed and pumping plans were discussed by numerical simulation to achieve the remedial objective in which 1,4-dioxane in groundwater outside of walls is remedied within 10 years and 1,4-dioxane spreading throughout the walls is prevented in the case where a portion of waste is remained. Firstly, the amount of waste to be removed considering pumping plans for P&T was determined by scenario analysis. As a result, at least two-third of waste should be removed by combining with P&T. However, if the waste is remained, future risks of 1,4-dioxane spreading through the slurry walls may occur. Our simulation suggested that groundwater within the re- maining waste must be pumped up at least 20 m3/d for containment of 1,4-dioxane within the remaining waste. In con- clusion, our numerical simulation determined the amount of waste to be removed and the pumping plans for P&T to achieve the remedial objective effectively considering future risks based on the concept of VF-UP. Keywords: Remediation Planning; Numerical Simulation; Verified Follow Up; Pump-and-Treat; 1,4-Dioxane-Contaminated Groundwater; Illegal Dumping Site 1. Introduction In Japan, after the rapid economic growth in mid-20th century, environmental pollution has become a serious issue caused by industrial activities [1]. The problem of illegal dumping of industrial waste has been prolonged through decades because of, e.g., lack of landfills, high cost for waste management, and many mountainous areas where illegal dumping can be easily carried out [2,3]. The number of illegal dumping increased over 1000 cases from 1998 to 2001 [4]. Recently, the solution of illegal dumping has become a major importance, since illegal dumping threatens the society’s safety and security [5-8]. The restoration and recovery of illegal dumping sites to meet the conditions regulated by law or environmental standards poses a variety of problems including not only the impacts on the surrounding environments but also major economic losses because it requires sophisticated technologies and long remediation period [4,5,8]. Kuwana illegal dumping site is one of those cases where the contaminated waste was illegally dumped be- tween 1995 and 1996. Since then, groundwater had been contaminated by Volatile Organic Compounds (VOCs). From 2002 to 2007, remedial measures, e.g., containment all the waste by constructing vertical slurry walls and C opyright © 2013 SciRes. JWARP 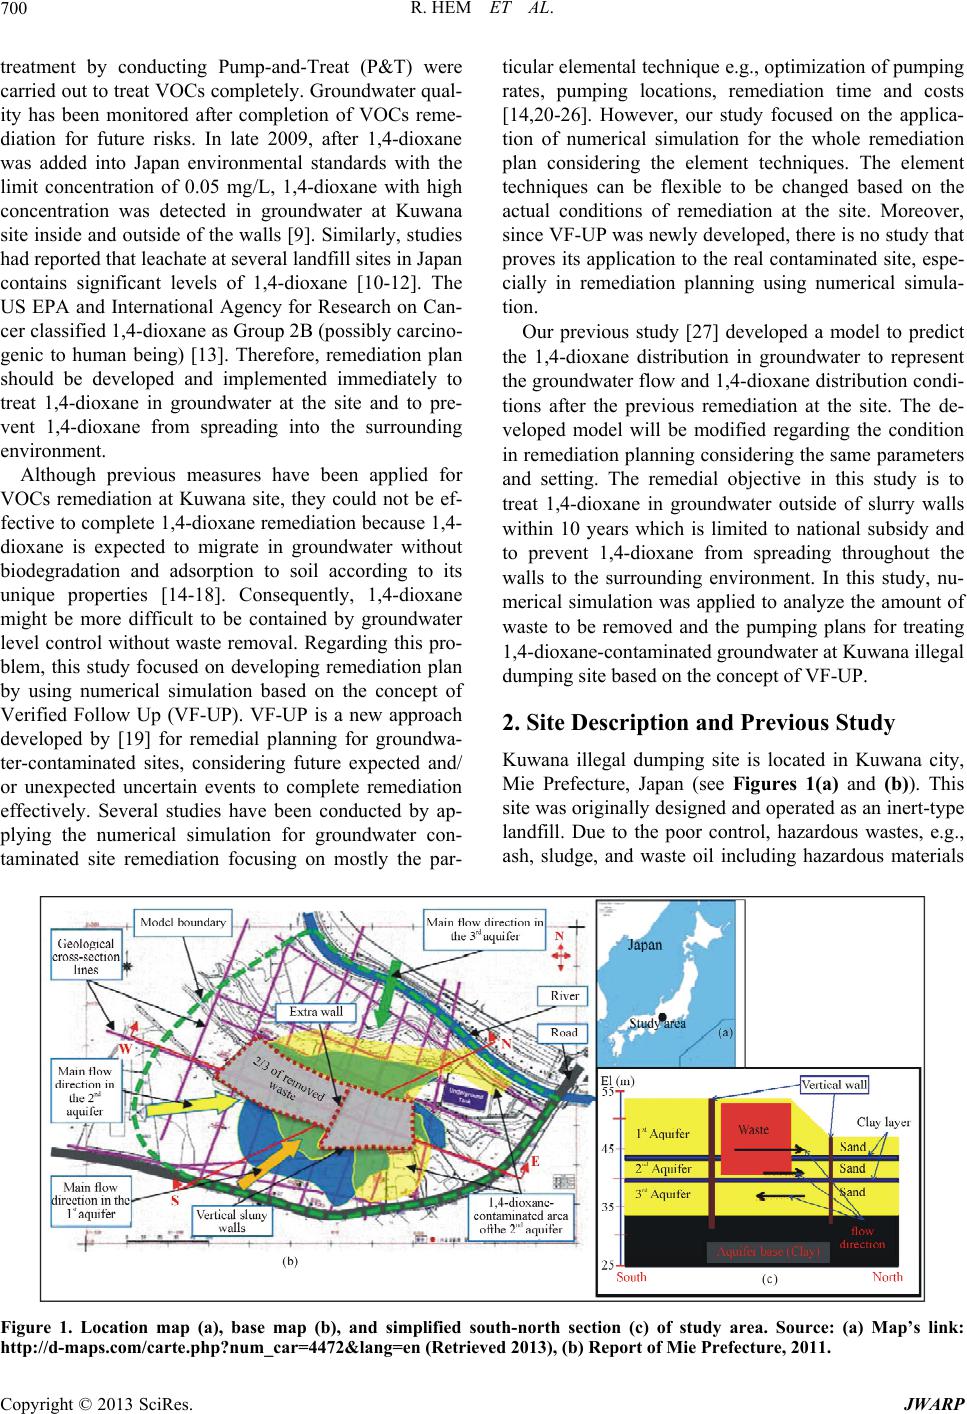 R. HEM ET AL. 700 treatment by conducting Pump-and-Treat (P&T) were carried out to treat VOCs completely. Groundwater qual- ity has been monitored after completion of VOCs reme- diation for future risks. In late 2009, after 1,4-dioxane was added into Japan environmental standards with the limit concentration of 0.05 mg/L, 1,4-dioxane with high concentration was detected in groundwater at Kuwana site inside and outside of the walls [9]. Similarly, studies had reported that leachate at several landfill sites in Japan contains significant levels of 1,4-dioxane [10-12]. The US EPA and International Agency for Research on Can- cer classified 1,4-dioxane as Group 2B (possibly carcino- genic to human being) [13]. Therefore, remediation plan should be developed and implemented immediately to treat 1,4-dioxane in groundwater at the site and to pre- vent 1,4-dioxane from spreading into the surrounding environment. Although previous measures have been applied for VOCs remediation at Kuwana site, they could not be ef- fective to complete 1,4-dioxane remediation because 1,4- dioxane is expected to migrate in groundwater without biodegradation and adsorption to soil according to its unique properties [14-18]. Consequently, 1,4-dioxane might be more difficult to be contained by groundwater level control without waste removal. Regarding this pro- blem, this study focused on developing remediation plan by using numerical simulation based on the concept of Verified Follow Up (VF-UP). VF-UP is a new approach developed by [19] for remedial planning for groundwa- ter-contaminated sites, considering future expected and/ or unexpected uncertain events to complete remediation effectively. Several studies have been conducted by ap- plying the numerical simulation for groundwater con- taminated site remediation focusing on mostly the par- ticular elemental technique e.g., optimization of pumping rates, pumping locations, remediation time and costs [14,20-26]. However, our study focused on the applica- tion of numerical simulation for the whole remediation plan considering the element techniques. The element techniques can be flexible to be changed based on the actual conditions of remediation at the site. Moreover, since VF-UP was newly developed, there is no study that proves its application to the real contaminated site, espe- cially in remediation planning using numerical simula- tion. Our previous study [27] developed a model to predict the 1,4-dioxane distribution in groundwater to represent the groundwater flow and 1,4-dioxane distribution condi- tions after the previous remediation at the site. The de- veloped model will be modified regarding the condition in remediation planning considering the same parameters and setting. The remedial objective in this study is to treat 1,4-dioxane in groundwater outside of slurry walls within 10 years which is limited to national subsidy and to prevent 1,4-dioxane from spreading throughout the walls to the surrounding environment. In this study, nu- merical simulation was applied to analyze the amount of waste to be removed and the pumping plans for treating 1,4-dioxane-contaminated groundwater at Kuwana illegal dumping site based on the concept of VF-UP. 2. Site Description and Previous Study Kuwana illegal dumping site is located in Kuwana city, Mie Prefecture, Japan (see Figures 1(a) and (b)). This site was originally designed and operated as an inert-type landfill. Due to the poor control, hazardous wastes, e.g., ash, sludge, and waste oil including hazardous materials Figure 1. Location map (a), base map (b), and simplified south-north section (c) of study area. Source: (a) Map’s link: http://d-maps.com/carte.php?num_car=4472&lang=en (Retrieved 2013), (b) Report of Mie Prefecture, 2011. Copyright © 2013 SciRes. JWARP 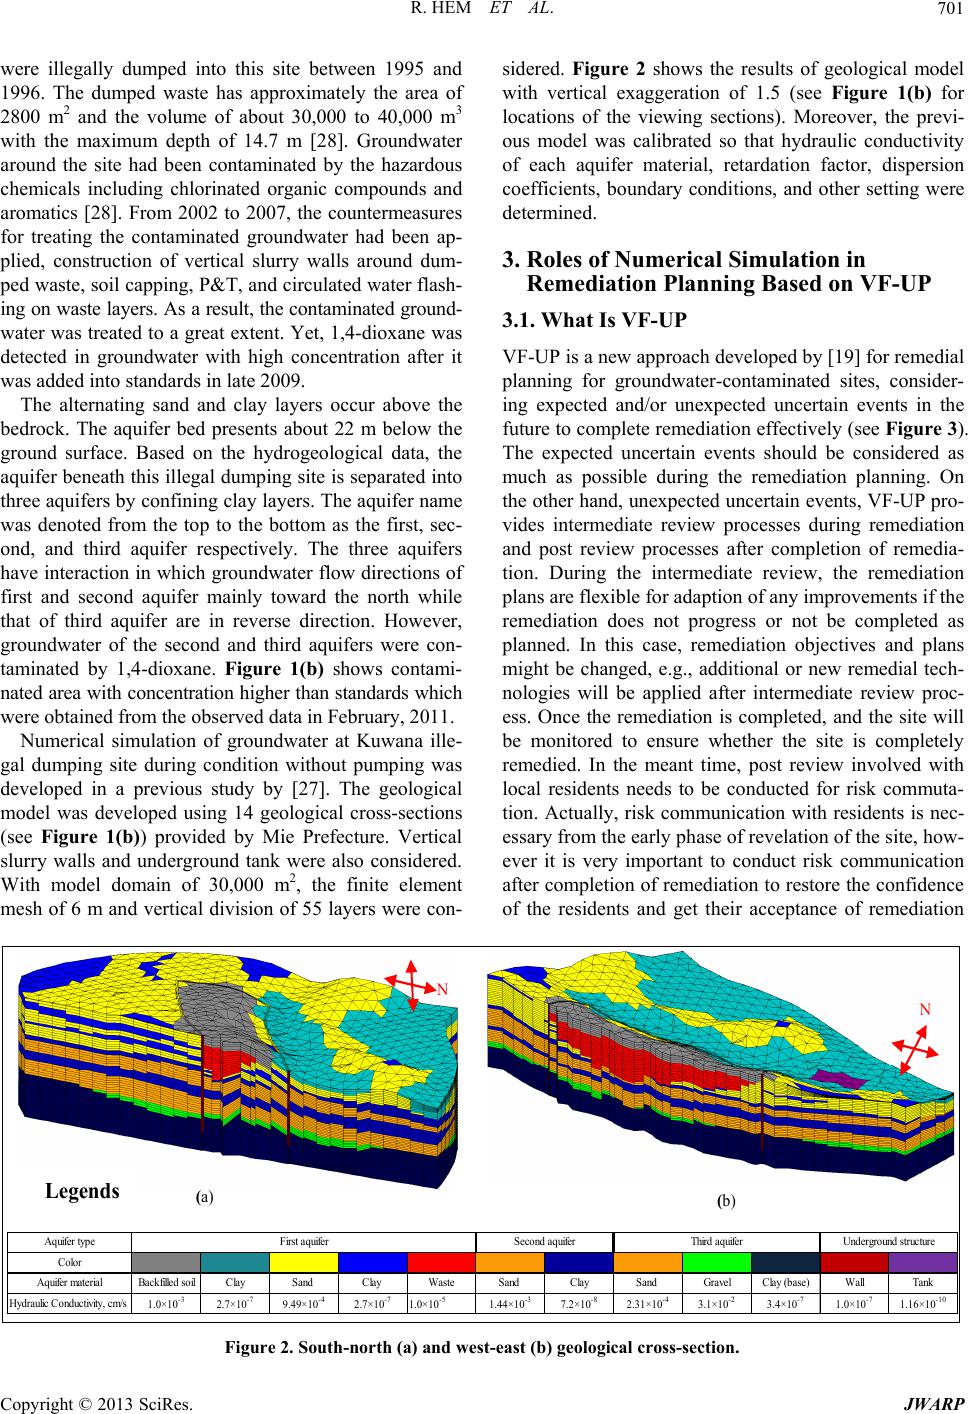 R. HEM ET AL. 701 were illegally dumped into this site between 1995 and 1996. The dumped waste has approximately the area of 2800 m2 and the volume of about 30,000 to 40,000 m3 with the maximum depth of 14.7 m [28]. Groundwater around the site had been contaminated by the hazardous chemicals including chlorinated organic compounds and aromatics [28]. From 2002 to 2007, the countermeasures for treating the contaminated groundwater had been ap- plied, construction of vertical slurry walls around dum- ped waste, soil capping, P&T, and circulated water flash- ing on waste layers. As a result, the contaminated ground- water was treated to a great extent. Yet, 1,4-dioxane was detected in groundwater with high concentration after it was added into standards in late 2009. The alternating sand and clay layers occur above the bedrock. The aquifer bed presents about 22 m below the ground surface. Based on the hydrogeological data, the aquifer beneath this illegal dumping site is separated into three aquifers by confining clay layers. The aquifer name was denoted from the top to the bottom as the first, sec- ond, and third aquifer respectively. The three aquifers have interaction in which groundwater flow directions of first and second aquifer mainly toward the north while that of third aquifer are in reverse direction. However, groundwater of the second and third aquifers were con- taminated by 1,4-dioxane. Figure 1(b) shows contami- nated area with concentration higher than standards which were obtained from the observed data in February, 2011. Numerical simulation of groundwater at Kuwana ille- gal dumping site during condition without pumping was developed in a previous study by [27]. The geological model was developed using 14 geological cross-sections (see Figure 1(b)) provided by Mie Prefecture. Vertical slurry walls and underground tank were also considered. With model domain of 30,000 m2, the finite element mesh of 6 m and vertical division of 55 layers were con- sidered. Figure 2 shows the results of geological model with vertical exaggeration of 1.5 (see Figure 1(b) for locations of the viewing sections). Moreover, the previ- ous model was calibrated so that hydraulic conductivity of each aquifer material, retardation factor, dispersion coefficients, boundary conditions, and other setting were determined. 3. Roles of Numerical Simulation in Remediation Planning Based on VF-UP 3.1. What Is VF-UP VF-UP is a new approach developed by [19] for remedial planning for groundwater-contaminated sites, consider- ing expected and/or unexpected uncertain events in the future to complete remediation effectively (see Figure 3). The expected uncertain events should be considered as much as possible during the remediation planning. On the other hand, unexpected uncertain events, VF-UP pro- vides intermediate review processes during remediation and post review processes after completion of remedia- tion. During the intermediate review, the remediation plans are flexible for adaption of any improvements if the remediation does not progress or not be completed as planned. In this case, remediation objectives and plans might be changed, e.g., additional or new remedial tech- nologies will be applied after intermediate review proc- ess. Once the remediation is completed, and the site will be monitored to ensure whether the site is completely remedied. In the meant time, post review involved with local residents needs to be conducted for risk commuta- tion. Actually, risk communication with residents is nec- essary from the early phase of revelation of the site, how- ever it is very important to conduct risk communication after completion of remediation to restore the confidence of the residents and get their acceptance of remediation Aquifer type Color Aquifer materialBackfilled soilClaySand Clay WasteSand ClaySand GravelClay (base)WallTank Hydraulic Conductivity, cm/s1.0×10 -3 2.7×10 -7 9.49×10 -4 2.7×10 -7 1.0×10 -5 1.44×10 -3 7.2×10 -8 2.31×10 -4 3.1×10 -2 3.4×10 -7 1.0×10 -7 1.16×10 -10 Second aquiferFirst aquiferThird aquiferUnderground structure Legends (a) (b) Figure 2. South-north (a) and w e st-east (b) geological cross-section. Copyright © 2013 SciRes. JWARP  R. HEM ET AL. 702 completion. 3.2. Uncertain Factors in Remediation Planning The expected and unexpected events caused by many factors categorized as technical and social uncertain fac- tors. Remediation planning based on VF-UP requires planners to consider expected uncertain events as much as possible. Once the uncertain events occur in the future, during remediation or after completion of remediation, they may exert a significant influence on the progress of the remediation. In Table 1, the first column shows the process of remedial planning from site discovering to the completion of remediation and followed by the technical and social uncertain factors [19]. The uncertain events may happen due to technical un- certain factors that might happen at each phase from the site investigation to the completion of remediation. Once the contaminated site is discovered, field investigation is carried out for data collection for analysis. Generally, the number of data is limited and discrete over space and time, therefore, the analysis of hydrogeological condition, waste distribution, and contaminant distribution contains much uncertainty. Next, remedial alternatives and plans were decided and implemented uncertainly. The selected technologies might not be good enough for specific site condition and contaminants to be treated. Moreover, de- sign and implementation of technologies might not be proper because the predicted hydrogeological condition, waste and contaminant distribution also contain uncer- tainty. In addition, operation and maintenance might not be well progress as planned because uncertain events may occur. Lastly, the completion of remediation might be judged in different ways from person to person which required the adequate knowledge and experiences. Be- sides, enough information must be required to be prop- erly judged the completion of remediation. For the uncertain events caused by the social uncertain factors, may occur at any time of the whole processes for remediation planning. There is no good communication in society structure and not enough disclosure for resi- dents about the site information. The registration or law could be revised any time in which a new compound might be added into environmental standards. Likewise, the remediation could be terminated due to the cuts in national subsidy. Furthermore, the new residents would complaint or protest against the contaminated site. Last but not least, sometimes the remediation is slower than available period of fund so that the remediation might be left incomplete. 3.3. Objective of Numerical Simulation for Remediation Planning Based on VF-UP Considering the above technical uncertain factors, there might be many uncertain events will occur at Kuwana illegal dumping site during the remediation and after completion of remediation because the site has complex hydrogeological features. There are three aquifers with interaction and groundwater flows in different directions. Moreover, the site has a steep slope so that groundwater control for 1,4-dioxane containment is difficult. Since the Figure 3. Remediation planning based on the conc e pt of VF -UP. Table 1. Uncertain factors considered in remediation planning based on VF-UP. Remediation planning phase Technical uncertain factors Social uncertain factors Investigation and analysis after site discovering Hydrogeological condition Waste distribution Contaminant distribution Remedial alternatives, remedial plans and implementation Selected technologies Design and implementation Operation and maintenance Completion of remediation How is “completion” judged? Society structure Not enough disclosure Registration or law new standard subsidy cut New residents Funding Copyright © 2013 SciRes. JWARP  R. HEM ET AL. 703 number of data is limited and discrete over space and time, prediction of groundwater flow and 1,4-dioxane distribution might involve much uncertainty which exert the remediation to progress slowly or remediation could not be completed within time as planned. Due to the above conditions, the uncertain events might occur dur- ing remediation and after completion of remediation. Therefore, in this study, two uncertain events were con- sidered for remediation planning for Kuwana site: 1) Decreasing of remediation efficiency in P&T for 1,4-dioxane-contaminated groundwater out of the verti- cal wall. 2) Emitting of 1,4-dioxane through the vertical walls because the remaining waste might contain 1,4-dioxane with high concentration. Waste removal and P&T were considered as remedial methods for 1,4-dioxane-contaminated groundwater at Kuwana illegal dumping site. The objective of numerical simulation for remediation planning based on the concept of VF-UP is to treat 1,4-dioxoane outside of the walls within 10 years and to prevent the spreading of 1,4-diox- ane within the walls in case where a part of waste is re- mained. Numerical simulation will play an important role for estimating the effectiveness of waste removal and P & T plans by considering the above mentioned expected uncertain events. During remediation, the performance of remediation was reviewed if any additional measures are needed for improving the effectiveness of remediation. However, if a portion of waste is remained, future risks of 1,4-dioxane spreading through the walls into the sur- rounding environment might occur. The future risks might occur after completion of remediation. For that reason, numerical simulation can be used to predict the possible occurrence of future risks so that the measures against future risks can be considered beforehand. 4. Model Development for Remediation 4.1. Governing Equations Basically, the development of any deterministic model for the groundwater flow and contaminant transport in groundwater flow system is a set of representative partial differential equations [29]. Equation (1) represents the net inflow into the volume that must be equal to the rate at which water is accumulating within the investigated volume [30], ij ij k xx s hh SQ t ,1,2,3ij (1) where are principal coordinate directions; is the hydraulic conductivity (m/s); h is the hydrau- k lic head (m); S Q is the specific storage of porous me- dium (1/m); is the local sources and sinks per unit- volume (1/s); is the space coordinate (m); denotes time (s). t The transport model can be represented by the follow- ing advection-dispersion equation [30]: Riijs ii j cc c vDQ txxx (2) where 1 1sd n RK n is retardation factor of sol- ute (dimensionless), is density of dry matrix mate- rial (kg/m3), is total porosity (dimensionless), nd is distribution coefficient (m3/kg) ; c is the concentration (mg/L); is the Darcy velocity (m/s); D is the disper- v sion coefficient (m2/s); Q is the concentration of solute of water that added from sources or sinks (mg/L·s). 4.2. Solving Method and Used Software The application of finite element method to groundwater problem simulation was recently developed comparing to the finite difference method. For the finite difference model, the heads throughout the domain are defined only at the nodal points themselves while the finite element model permits the application of variational or weighted residual principles. Finite element method is flexible for irregular boundaries of problem and, moreover, in solv- ing coupled problems, e.g., contaminant transport, or in solving moving boundary problems, such as moving wa- ter table [31]. For this model, numerical finite element methods ba- sed on the mixed Eulerian-Lagrangian approaches were used to solve the advection-dispersion equations. The La- grangian methods are particularly suitable for solving ad- vection term, while the Eulerian methods are more effec- tive in dealing with dispersion term [32]. In this paper, a three-dimensional numerical model was developed by using GeoModeler software for simulating the ground- water flow and 1,4-dioxane transport. GeoModeler is a numerical finite element-based software for modeling subsurface flow, solute transport, and heat transport pro- cesses which was recently developed by a Japanese com- pany, GMLabo Inc (http://www.gmlabo.co.jp/). 4.3. New Model Development for P&T Remediation 4.3.1. Grou ndwater Data fo r Pumpi ng Conditi on Based on the data given by Mie Prefecture, groundwater had been normally pumped from the first and second aquifers for VOCs treatment. However, during two peri- ods, groundwater from the third aquifer also pumped, from November, 2007 to March, 2008 and from Decem- ber, 2009 to March, 2010. During these two periods, the Copyright © 2013 SciRes. JWARP  R. HEM ET AL. 704 maximum pumped water was found in February, 2010. The average pumping rate was about 52 m3/d, in which 36 m3/d from the inside the walls (21 pumping wells) and 16 m3/d from the outside of the walls (six pumping wells), and much water was pumped from the second and third aquifers. Therefore, the groundwater data in Febru- ary, 2010 will be used for the model calibration for pum- ping condition. 4.3.2. Model Calibr ation It is never possible that one model can correspond to all the conditions on groundwater behavior [33]. For the case of Kuwana site, since the model domain is narrow, the pumping activities might influence the model bound- ary, e.g., the boundary might be lower than the condition without pumping. Therefore, the model calibrated using the data during the absence of pumping cannot be used to represent the groundwater behavior during pumping. For that reason, the existing model developed by [27] re- quires to be calibrated for pumping condition. The avail- able measured groundwater head data in the first, second, and third aquifers were obtained from 12, 12, and 14 monitoring wells respectively. These data were used for comparing within the model result from each calibration. An error index, root mean square error (RMSE) calcu- lated by comparing the calculated and observed heads was used to compare the goodness-of-fit of each calibra- tion result. Firstly, the existing model was run for the pumping condition by inputting all the above pumping data, case 0. As a result, the mean error of each aquifer ranged from −0.5 to +0.5 m so that the decreasing bound- ary will be done for calibration limited to 0.5 m. Nor- mally, the boundary at the upstream (UB) is much influ- enced than that in the downstream (DB) of aquifer, therefore, the decreasing upstream boundary was priori- tized for the calibration. Table 2 shows that case 3 gave the better minimum RMSE value. In this case, only the upstream boundary of the third aquifer was decreased by 0.5 m while that of the first and second aquifers were kept the same as their original levels. The boundary of the third aquifer was influenced by the pumping because there was not enough water supplied from the boundary due to the low hydrau- lic conductivity and the aquifer thickness is relatively thin comparing the other two aquifers. For the first and second aquifers, plenty of water was supplied from the boundary, especially from the upstream boundary. Fig- ure 4 shows the comparison between the calculated and observed head at monitoring wells in each aquifer. Addi- tionally, groundwater flow directions in each aquifer from case 3 were found to be consistent with those ob- tained from the measured groundwater head data during pumping. And, if there is no such calibration, groundwa- ter flow direction of the third aquifer would be in rever- sion directions with those from measured data during pumping. 5. Remediation Planning Based on VF-UP 5.1. Estimation of Removed Waste and Pumping Rates for Remediation Plan The required time for contaminated groundwater reme- Figure 4. Comparison of calculated and observed ground- water head. Table 2. Scenarios for model calibration and RMSE results. Case 0 Case 1 Case 2 Case 3 Case 4 Case 5 Case 6 Calibration Case UB DB UB DB UB DB UB DB UB DB UB DB UB DB First aquifer × × × × × × × × × Second aquifer × × × × × × × × × Third aquifer × × × × × × × × × × RMSE 0.624 0.668 0.608 0.558 0.666 0.620 0.798 × Groundwater head boundary was not changed. Groundwater head boundary was decreased 0.5 m from the original level. Copyright © 2013 SciRes. JWARP  R. HEM ET AL. 705 diation will depend on several factors, which vary from site to site, e.g., it may take longer for the site where the contaminant source has not been completely removed [34]. Since the national subsidy is limited for Kuwana illegal dumping site, complete removal of waste from the site is impossible. This study has supposed four cases of waste removal with the same depth of about 15 m from ground surface, (a) no removal of waste, (b) one-third of waste is removed, (c) two-third of waste is removed, and (d) all of waste is removed. Based on the waste distribu- tion and current 1,4-dioxane concentration distribution, the zone of waste to be removed is considered to start from eastern part of walls. For plan (c) and (d), extra wall which has similar property with the vertical slurry walls was added for the calculation (see Figure 1(b)). In order to determine pumping well locations and rates, plan (c) is considered because it is the most considerable case based on the waste distribution and 1,4-dioxane concentration distribution. In case where a portion of waste is remained, the remaining waste is considered as the continuous source of 1,4-dioxane with relative concentration of 1 unit. The 1,4-dioxane concentration distribution calcu- lated in the previous model was used as initial condition, however, 1,4-dioxane within the removed waste was ex- cluded in calculation. According to 1,4-dioxane distribution in the previous study [27], locations of four pumping wells outside and two wells inside of walls were considered for plan (b). The wells inside of walls were used to pump groundwa- ter from all aquifers, while the two wells outside the walls for only groundwater from the second and third aquifers. 1,4-Dioxane transport with 14 pumping plans were analyzed (see Table 3). The total pumping rates from each combination were limited by the capacity of treatment facilities of 60 m3/d. As a result, the last pump- ing plan (P14) gives minimum average concentration outside of walls in each aquifer. Reviewing all the result from the 14 pumping plans, remediation is more effective when pumping rates of wells within waste layers in- creased, however, at least 10 m3/d of water should be pumped to treat 1,4-dioxane outside of the walls. From this result, 50 m3/d is needed for pumping groundwater from the remaining waste for 1,4-dioxane containment and 10 m3/d is needed for pumping ground- water from outside of walls for 1,4-dioxane remediation. The estimated pumping plan was used then to calculate the effectiveness of remediation of other plans. Since the spatial distribution of waste is large, six and four pump- ing wells are required for plan (a) and (b) respectively. For plan (d), even all waste was removed, the remaining pumping capacity should focused on the treatment of 1,4-dioxane in groundwater of the third aquifer. There- fore, six pumping wells installed in only third aquifer. The average concentration observed at 19, 29 and 30 monitoring wells outside of the walls of the first, second, and third aquifer respectively is used to evaluate the ef- fectiveness of each plan. Corresponding to the each pum- ping plan, the results of remaining average concentration measured from those observation wells are shown in Figure 5. Groundwater outside of walls can be com- pletely treated to lower than standard limit only by plan (d). For plan (a) and (b), there is no further ways to im- prove the efficiency of remediation because the 1,4-diox- ane remained high in all aquifers. In contrast, in plan (c), groundwater of the first and second aquifers was com- pletely treated, but the third aquifer is still contaminated. In addition, since the waste remained only in the first aquifer, the third aquifer will be easily remedied. For that reason, remediation in plan (c) suggested to review pum- ping plans if there is uncertain event that may exert the significant influence on remediation efficiency. During the review of pumping plans, two wells outside the wall found to be no longer effective and they were relocated into the zones where concentration was slowly decreased during remediation. Moreover, only groundwater from the third aquifer should be pumped. In addition, a new Table 3. Scenarios of pumping plans and average 1,4-dioxane concentration result from wells outside of walls. Scenario of pumping plans P1 P2 P3 P4 P5 P6 P7 P8 P9 P10 P11 P12 P13P14 Inside of walls 15 20 30 40 50 South of walls 5 10 15 20 5 10 15 20 5 10 15 5 10 5 North of walls 5 10 15 20 5 10 15 20 5 10 15 5 10 5 Pumping rate (m3/d) Total 25 35 45 55 30 40 50 60 40 50 60 50 60 60 First aquifer 0.0370.036 0.034 0.0330.0350.0320.0310.0300.0310.030 0.029 0.029 0.0290.029 Second aquifer 0.0480.044 0.043 0.0410.0450.0410.0400.0380.0400.038 0.038 0.038 0.0370.036 Third aquifer 0.1220.112 0.105 0.0980.1130.0990.0930.0870.0850.080 0.073 0.073 0.0690.066 Average concentration outside of walls All aquifers 0.0690.064 0.061 0.0570.0640.0580.0550.0520.0520.049 0.047 0.047 0.0450.044 Copyright © 2013 SciRes. JWARP  R. HEM ET AL. 706 Figure 5. Average concentration of 1,4-dioxane in 10 years after remediati o n started. well is required to the zone of removed waste because the concentration was remaining high. After the plan (c) was completely revised, simulation was rerun for another 10 years using the 5th year concen- tration of its result as initial concentration. As a result, Figure 6 shows that 1,4-dioxane concentration especially in the third aquifer was decreased drastically from the first year and gradually decreased to lower than standard limit in four to five years after the review of plan (c) (see Figure 6). Thus, in remediation planning, revised plan (c) and plan (d) could be proposed. However, if revised plan (c) is selected for the site, when P&T will be shut down in future, risks of 1,4-dioxane spreading out of the walls might occur. Therefore, further study for future risks management should be conducted. 5.2. Estimation of Pumping Rate for Future Risks Management after Completion of Remediation In order to predict the future risks that may occur after completion of remediation, we assumed that the remain- ing waste contains high 1,4-dioxane concentration. In this case, the whole remaining waste was assumed to contain 1,4-dioxane with relative concentration of 1 unit release constantly over calculation period for 15 years. As a result, if there is no pumping, 1,4-dioxane could spread out of the walls into the surrounding environment. For that reason, P&T is required. Using two pumping wells as similar as in plan (c), in which groundwater was pumped from the waste layer of all aquifers with pump- ing rates varied from 0 to 60 m3/d in order to observe the trench of decreasing rate of concentration until the mini- mum spreading concentration is achieved. To observe the spreading concentration, eight and nine observation points were placed from the south and north walls respectively until the model boundary. 1,4-dioxane spreading was simulated for 15 years with pumping. As a result, the average concentration of 1,4-dioxane from 17 observation points were plotted corresponding to the each pumping rate in Figure 7. In case of pumping rate reached 20 m3/d the average spreading concentration was minimized. Therefore, the required pumping rate for hy- draulic containment to prevent future spreading of 1,4- dioxane into surrounding environment was determined as 20 m3/d. 6. Conclusions With regardless of national subsidy, the removal of all Figure 6. Decreasing average concentration in plan (c) from 1 day to 15 years. Copyright © 2013 SciRes. JWARP 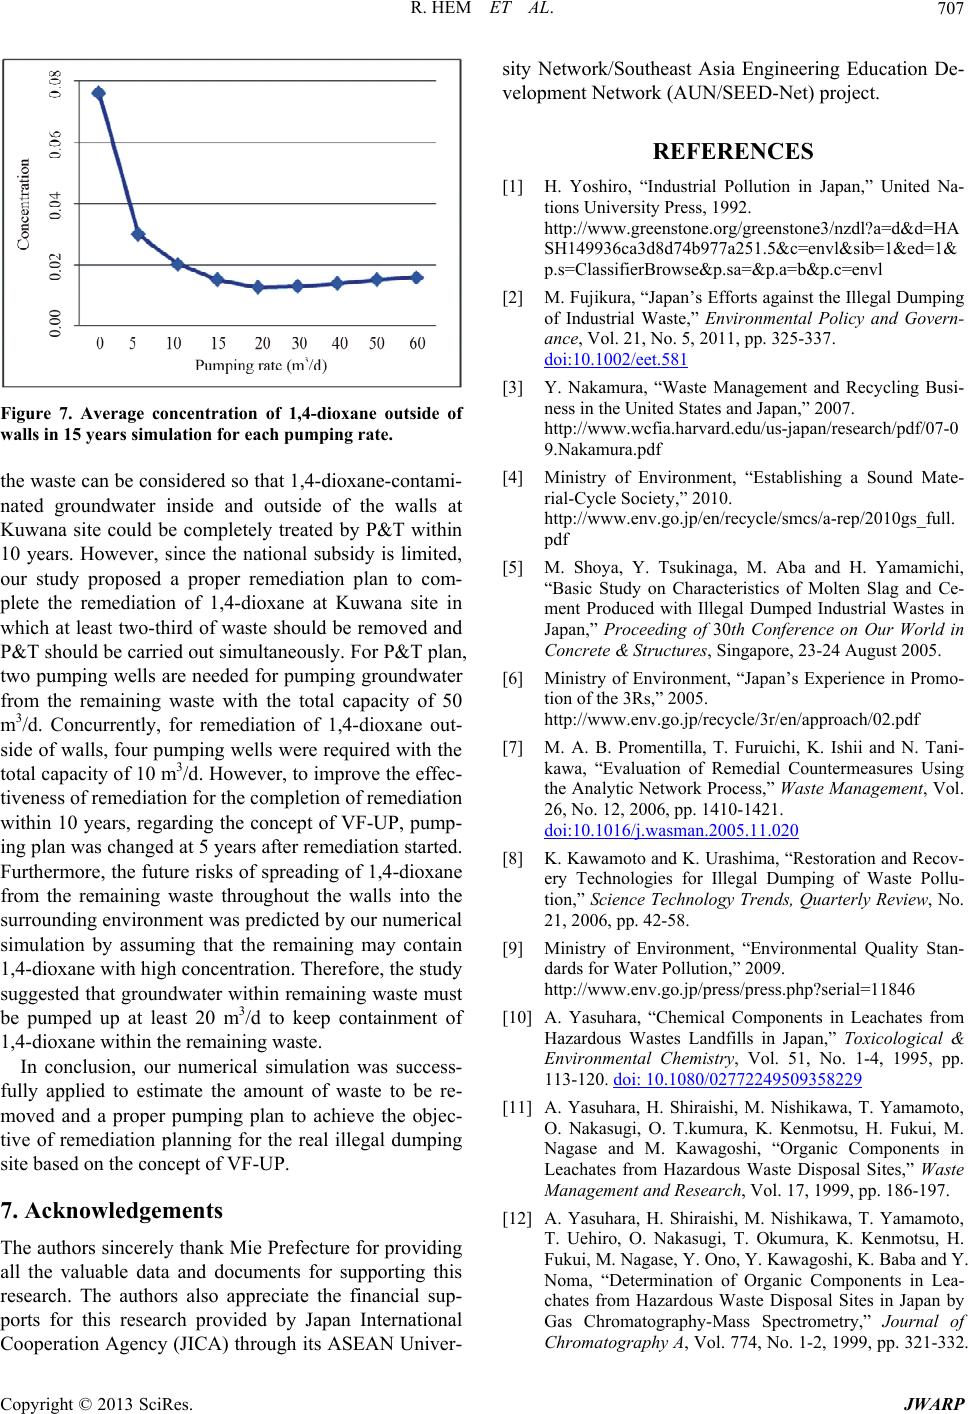 R. HEM ET AL. 707 Figure 7. Average concentration of 1,4-dioxane outside of walls in 15 years simulation for each pumping rate. the waste can be considered so that 1,4-dioxane-contami- nated groundwater inside and outside of the walls at Kuwana site could be completely treated by P&T within 10 years. However, since the national subsidy is limited, our study proposed a proper remediation plan to com- plete the remediation of 1,4-dioxane at Kuwana site in which at least two-third of waste should be removed and P&T should be carried out simultaneously. For P&T plan, two pumping wells are needed for pumping groundwater from the remaining waste with the total capacity of 50 m3/d. Concurrently, for remediation of 1,4-dioxane out- side of walls, four pumping wells were required with the total capacity of 10 m3/d. However, to improve the effec- tiveness of remediation for the completion of remediation within 10 years, regarding the concept of VF-UP, pump- ing plan was changed at 5 years after remediation started. Furthermore, the future risks of spreading of 1,4-dioxane from the remaining waste throughout the walls into the surrounding environment was predicted by our numerical simulation by assuming that the remaining may contain 1,4-dioxane with high concentration. Therefore, the study suggested that groundwater within remaining waste must be pumped up at least 20 m3/d to keep containment of 1,4-dioxane within the remaining waste. In conclusion, our numerical simulation was success- fully applied to estimate the amount of waste to be re- moved and a proper pumping plan to achieve the objec- tive of remediation planning for the real illegal dumping site based on the concept of VF-UP. 7. Acknowledgements The authors sincerely thank Mie Prefecture for providing all the valuable data and documents for supporting this research. The authors also appreciate the financial sup- ports for this research provided by Japan International Cooperation Agency (JICA) through its ASEAN Univer- sity Network/Southeast Asia Engineering Education De- velopment Network (AUN/SEED-Net) project. REFERENCES [1] H. Yoshiro, “Industrial Pollution in Japan,” United Na- tions University Press, 1992. http://www.greenstone.org/greenstone3/nzdl?a=d&d=HA SH149936ca3d8d74b977a251.5&c=envl&sib=1&ed=1& p.s=ClassifierBrowse&p.sa=&p.a=b&p.c=envl [2] M. Fujikura, “Japan’s Efforts against the Illegal Dumping of Industrial Waste,” Environmental Policy and Govern- ance, Vol. 21, No. 5, 2011, pp. 325-337. doi:10.1002/eet.581 [3] Y. Nakamura, “Waste Management and Recycling Busi- ness in the United States and Japan,” 2007. http://www.wcfia.harvard.edu/us-japan/research/pdf/07-0 9.Nakamura.pdf [4] Ministry of Environment, “Establishing a Sound Mate- rial-Cycle Society,” 2010. http://www.env.go.jp/en/recycle/smcs/a-rep/2010gs_full. pdf [5] M. Shoya, Y. Tsukinaga, M. Aba and H. Yamamichi, “Basic Study on Characteristics of Molten Slag and Ce- ment Produced with Illegal Dumped Industrial Wastes in Japan,” Proceeding of 30th Conference on Our World in Concrete & Structures, Singapore, 23-24 August 2005. [6] Ministry of Environment, “Japan’s Experience in Promo- tion of the 3Rs,” 2005. http://www.env.go.jp/recycle/3r/en/approach/02.pdf [7] M. A. B. Promentilla, T. Furuichi, K. Ishii and N. Tani- kawa, “Evaluation of Remedial Countermeasures Using the Analytic Network Process,” Waste Management, Vol. 26, No. 12, 2006, pp. 1410-1421. doi:10.1016/j.wasman.2005.11.020 [8] K. Kawamoto and K. Urashima, “Restoration and Recov- ery Technologies for Illegal Dumping of Waste Pollu- tion,” Science Technology Trends, Quarterly Review, No. 21, 2006, pp. 42-58. [9] Ministry of Environment, “Environmental Quality Stan- dards for Water Pollution,” 2009. http://www.env.go.jp/press/press.php?serial=11846 [10] A. Yasuhara, “Chemical Components in Leachates from Hazardous Wastes Landfills in Japan,” Toxicological & Environmental Chemistry, Vol. 51, No. 1-4, 1995, pp. 113-120. doi: 10.1080/02772249509358229 [11] A. Yasuhara, H. Shiraishi, M. Nishikawa, T. Yamamoto, O. Nakasugi, O. T.kumura, K. Kenmotsu, H. Fukui, M. Nagase and M. Kawagoshi, “Organic Components in Leachates from Hazardous Waste Disposal Sites,” Waste Management and Research, Vol. 17, 1999, pp. 186-197. [12] A. Yasuhara, H. Shiraishi, M. Nishikawa, T. Yamamoto, T. Uehiro, O. Nakasugi, T. Okumura, K. Kenmotsu, H. Fukui, M. Nagase, Y. Ono, Y. Kawagoshi, K. Baba and Y. Noma, “Determination of Organic Components in Lea- chates from Hazardous Waste Disposal Sites in Japan by Gas Chromatography-Mass Spectrometry,” Journal of Chromatography A, Vol. 774, No. 1-2, 1999, pp. 321-332. Copyright © 2013 SciRes. JWARP  R. HEM ET AL. 708 doi:10.1016/S0021-9673(97)00078-2 [13] World Health Organization, “Rolling Revision of the WHO Guidelines for Drinking-Water Quality: 1,4-Dio- xane in Drinking-Water,” 2004. http://www.who.int/water_sanitation_health/dwq/chemica ls/1,4dioxanesum.pdf [14] W. H. Liu, M. A. Medina, W. Thomann, W. T. Piver and T. L. Jacobs, “Optimization of Intermittent Pumping Schedules for Aquifer Remediation Using a Genetic Al- gorithm,” Journal of the American Water Resources As- sociation, Vol. 36, No. 6, 2000, pp. 1335-1348. doi:10.1111/j.1752-1688.2000.tb05730.x [15] T. K. G. Mohr, J. A. Stickney and W. H. Diguiseppi, “En- vironmental Investigation And Remediation: 1,4-Dioxane and Other Solvent Stabilizers” CRC Press, Boca Raton, 2010. doi:10.1201/EBK1566706629 [16] M. W. Priddle and R. E. Jackson, “Laboratory Column Measurement of VOCs Retardation Factors and Compare with Field Values,” Ground Water, Vol. 29, No. 2, 1991, pp. 260-266. doi:10.1111/j.1745-6584.1991.tb00518.x [17] R. J. Patterson, R. E. Jackson, B. W. Graham, D. Chaput and M. Priddle, “Remediation of Toxic Chemicals in a Contaminated Outwash Aquifer,” Water Science Techno- logy, Vol. 17, 1985, pp. 57-69. [18] M. J. Zenker, R. C. Borden and M. A. Barlaz, “Occur- rence and Treatment of 1,4-Dioxanein Aqueous Environ- ments,” Environmental Engineering Science, Vol. 20, No. 5, 2003, pp. 423-432. doi:10.1089/109287503768335913 [19] T. Furuichi, “Remediation of Environmental Contami- nated Sites: New Approach for Practitioners,” Ohmsha, Tokyo, 2013. (in Japanese) [20] D.Becker, B. Minsker, R. Greenwald, Y. Zhang, K. Harre, K. Yager, C. M. Zheng and R. Peralta, “Reducing Long- Term Remedial Costs by Transport Modeling Optimiza- tion,” Ground Water, Vol. 44, No. 6, 2006, pp. 864-875. doi:10.1111/j.1745-6584.2006.00242.x [21] L. S. Matott, “Screening-Level Sensitivity Analysis for the Design of Pump-and-Treat Systems,” Groundwater Monitoring & Remediation, Vol. 32, No. 2, 2012, pp. 66- 80. doi:10.1111/j.1745-6592.2011.01375.x [22] C. Zhen and P. P. Wang, “An Integrated Global and Local Optimization Approach for Remediation System Design,” Water Resources Research, Vol. 35, No. 1, 1999, pp. 137-148. doi:10.1029/1998WR900032 [23] C. F. Harvey, R. Haggerty and S. M. Gorelick, “Aquifer Remediation: A Method for Estimating Mass Transfer Rate Coefficients and an Evaluation of Pulsed Pumping,” Water Resources Research, Vol. 30, No. 7, 1994, pp. 1979-1991. doi:10.1029/94WR00763 [24] P. Bayer, M. Finkel and Georg Teutsch, “Cost-Optimiza- tion Contaminant Plume Management with a Combina- tion of Pump-and-Treat and Physical Barrier Systems,” Groundwater Monitoring & Remediation, Vol. 25, No. 2, 2005, pp. 96-106. doi:10.1111/j.1745-6592.2005.0022.x [25] D. M. Rizzo and D. E. Dougherty, “Design Optimization for Multiple Management Period Groundwater Remedia- tion,” Water Resources Research, Vol. 32, No. 8, 1996, pp. 2549-2561. doi:10.1029/96WR01334 [26] C. Huang and A. S. Mayer, “Pumping-and-Treat Optimi- zation Using Locations and Pumping Rates as Decision Variables,” Water Resources Research, Vol. 33. No. 5, 1997, pp. 1001-1012. doi:10.1029/97WR00366 [27] R. Hem, T. Furuichi, K. Ishii and Y. C. Weng, “A New Approach for Prediction of 1,4-Dioxane Distribution in Groundwater at an Illegal Dumping Site in Japan,” 2013. (under Review) [28] K. Ishii, T. Furuichi and T. Imai, “A Study on Remedial Alternatives of Soil and Groundwater Contamination Caused by Improperly Controlled Landfill Sites-A Nu- merical Simulation Case Stud,” Proceeding of Sardinia 01, Eighth International Waste Management and Landfill Symposium, Sardinia, 1-5 October 2001, Vol. 3, 2001, pp. 723-734. [29] A. G. Bobba and S. R. Joshi, “Groundwater Transport of Radium-226 and Uranium from Port Granby Waste Ma- nagement Site To Lake Ontario,” Nuclear and Chemical Waste Management, Vol. 8, No. 3, 1988, pp. 199-209, doi:10.1016/0191-815X(88)90027-7 [30] K. Spitz and J. Moreno, “A Practical Guide to Ground- water and Solute Transport Modeling,” John Wiley & Sons, Inc, Toronto, 1996. [31] H. F. Wang and M. P. Anderson, “Introduction to Ground- water Modeling: Finite Difference and Finite Element Methods,” Academic Press, San Francisco, 1982. [32] C. Zheng and G. D. Bennett, “Applied Contaminant Tran- sport Modeling,” John Wiley and Sons, Inc., New York, 2002. [33] B. Barnett, L. R. Townley, V. Post, R. E. Evans, R. J. Hunt, L. Peeters, S. Richardson, A. D. Werner, A. Knap- ton and A. Boronkay, “Australian Groundwater Modeling Guidelines,” Waterlines Report, National Water Commis- sion, Canberra, 2012. [34] US EPA, “A Citizen’s Guide to Pump and Treat,” EPA 542-F-12-017, 2012. http://www.clu-in.org/download/citizens/a_citizens_guide _to_pump_and_treat.pdf Copyright © 2013 SciRes. JWARP
|