 Creative Education 2010. Vol.1, No.3, 170-183 Copyright © 2010 SciRes. DOI:10.4236/ce.2010.13027 Childhood Learning: An Examination of Ability and Attitudes toward School Jeffrey David Geddes, Amy Rebekah Murrell, Jessica Bauguss University of North Texas, Department of Psychology, Denton, USA. Email: amurrell@unt.edu Received July 25th, 2010; revised September 1st, 2010; accepted September 10th, 2010. A child’s ability to learn and school performance are influenced by various factors. Variables that affect learning and academic performance in 46 children, 4 - 7 years old, were examined. Children, parents, and teachers com- pleted questionnaires rating children’s attitudes toward and behavior in school. Children completed a computer- ized matching-to-sample (MTS) task, which trained the children to form 3 stimulus classes. One stimulus class included three arbitrary stimuli, the others contained a positively or negatively valenced stimulus, a school-re- lated stimulus, and an arbitrary stimulus. Class formation performance (including rate of learning, or the number of correct relations formed divided by the time spent in each training class) was assessed. Rate of learning pre- dicted attitudes toward school, and school attitudes predicted academic performance. Future directions for inter- vention in the early education of students who have poor attitudes toward school are discussed. Keywords: Childhood, Learning, Ability, Attitudes, School Childhood Learning: An Examination of Ability and Attitudes toward School Learning can be defined as “a relatively permanent change in behavior resulting from experience” (Catania, 1984, p. 3). The concept of learning is of utmost importance for educators at every level and especially for early childhood educators. A child’s early learning experiences may shape his/her behavior toward school and future learning. Therefore, it is essential to understand the factors that affect learning processes. Individual differences in learning may be a result of some combination of genetically or maturationally determined capabilities (Carroll, 1985), but are sometimes related to other factors such as moti- vation, attitudes, feelings, intelligence, affect, self-regard, and anxiety, as well as to many other factors (Brophy, 1983; Saras- son, 2004). Given that most learning in schools is accomplished via verbal mediums and a child’s verbal ability can be linked to his/her learning potential in school and other educational situa- tions (Carroll, 1985), an adequate model of verbal behavior seems necessary. The purpose of this paper is to discuss verbal learning as it is related to attitudes and school perfor mance. Equivalence Relations Stimulus equivalence and equivalence class formation are phenomena related to language/verbal behavior. Equivalence has been demonstrated in language-able humans, including typi- cally developing children and children with mental retardation (Sidman, 1971). Non-humans and humans who are not lan- guage competent have been unable to demonstrate equivalence class formation (Devany, Hayes; Nelson, 1986). When a child is taught a relation between two stimuli, A = B, and then taught another relation, B = C, without further training he/she will be able to derive four other relations, B = A, C = B, A = C, and C = A. When these relationships possess the proper- ties of reflexivity, symmetry, and transitivity they are said to be part of an equivalence class (Novak & Pelaez, 2004; Sidman, 1994). Reflexivity is established when a relationship is main- tained between a stimulus and itself, regardless of the context in which it exists (A = A). Symmetry exists when a relationship is held between two different stimuli. When the relationship A = B, is established, then the relationship B = A would also hold true. To satisfy the requirement for the property of transitivity a relationship must hold between three different stimuli. If sti- mulus A is related to stimulus B, and stimulus B is related to stimulus C in the same way, then stimuli A and C must also have the same relationship as the other relationships previously established (Novak & Pelaez, 2004; Sidman, 1994). Importance of Equivalence Relations. Sidman (1994) stated that establishing an equivalence relation is a method for generating new cognitive performances without directly teach- ing them. The more that we are able to understand equivalence relations, the better we will understand creativity/originality and, subsequently, gain the ability to predict and generate other behaviors from specific sets of circumstances. Equivalence relations underlie a person’s cognitive development, advanced reasoning abilities, language comprehension and verbal beha ve- ior, as well as other complex human behaviors (Hayes, Gifford, & Townsend, 2001). Equivalence relations lie at the heart of human language comprehension and verbal behavior. Formation of stimulus classes is fundamental to linguistic competence, because this process makes it possible for words to mediate the emergence of new behavior that has never been directly taught (Sidman, 1977). Relations can be directly taught through contact with the environment, but relations may also form indirectly through verbal mediums. In other words, even if a person has never been in direct contact with a stimulus, he/she can create a rela- tionship with that stimulus and other stimuli with which he/she  J. D. G EDDE S ET AL. has been in direct contact. It is through this, verbally mediated, knowledge that humans come to know things that are unrelated to anything that they have directly experienced, or even related to anything that they have witnessed. The number of relationships that emerge, and those that are not directly trained, increases with each additional relationship that is trained. The more relationships that are directly trained, the larger the stimulus class and the more relationships that emerge. This can be especially useful - or problematic - when t ransfor mation of function is considered. Transformation of Function. The functions related to one stimulus can be transferred to another stimulus in the same equivalence class (Dougher, Augustson, Markham, Greenway, & Wulfert, 1994). If one stimulus acquires a negative or posi- tive function then all of the relationships tied to that stimulus may also take on that negative or positive function. Through this class expansion people can learn to adaptively - or mal- adaptively - interact with numerous stimuli in environments to which they have never been exposed. The same phenomenon often occurs with words, in that words take on the same properties and functions as the objects that they label (Hayes et al., 2001). This ability for words to virtually function as objects can greatly facilitate learning and normal adaptive functioning. However, it can become problem- atic for children in school situations if they attach negative feelings or behaviors to some school-related stimuli. If a child has negative feelings and behaviors directed toward his/her teacher, he/she may experience negative emotions and act out at the mention of the teacher’s name. The problem may be further complicated if the child has “teacher” in the same equivalence class as “school” or something similar. “School” could take on the same negative functions as “teacher,” and this could further extend to any other words in the same class as “school” or “teacher.” The child may act out at the mention of school, homework or other related topics. Matching-To-Sample (MTS) Stimulus equivalence is usually studied (i.e., taught and measured) using a matching-to-sample (MTS) procedure. These studies are most often conducted on a computer. In a visual sample a stimulus is presented at the top of the screen. A set of three comparison stimuli are shown at the bottom of the screen. The participant is required to choose the stimulus at the bottom of the screen that “goes with” or “is the same as” the stimulus at the top of the screen. Participants’ behavior is reinfor ce d for making the correct selection. The three properties of stimulus classes, reflexivity, symmetry, and transitivity, are present in the task. If all relationships are demonstrated, the participant has formed an equivalence class which is a basic unit underly- ing many learning processes and academic success. Teaching New Skills. Stimulus equivalence and MTS tasks have been used frequently to teach new skills such as reading, oral naming, auditory recognition, and spelling (Sidman 1971; De Rose, De Souza, & Hanna, 1996). Previous research has demonstrated that students have been able to learn new skills such as reading and spelling by creating equivalence relations through the MTS task (De Rose et al., 1996; Melchiori, De Souza, & De Rose, 2000; Sidman, 1971). The ability to create classes of stimuli involving both trained and untrained rela- tionships underlies success in a variety of academic subjects. The ability to derive relations plays a central role in a child’s problem-solving, logic and mathematical abilities, and aca- demic achievement, and is strongly correlated with general intelligence (Strand, Barnes-Holmes, & Barnes-Holmes, 2003). Prior Learning History Affects MTS Performance. An individual’s learning history can interfere with his/her ability to form new equivalence classes (Peoples, Tierney, Bracken, & Mackay, 1998). Previous research has demonstrated that social history can interfere with a person’s equivalence responding, and therefore impact their ability to learn new relations and behavi ors (Watt, Keenan, Barnes, & Cairns, 1991). Feelings previously associated with the stimuli in a MTS task can affect formation of new stimulus classes that include those stimuli. As mentioned earlier, emotions and functions related to one stimu- lus can then be transferred to another stimulus in the same class. The result might be increased difficulty with learning new equivalence relations, as this behavior requires novel pairings of emotionally relevant stimuli (Plaud, 1995). Variables that More Broadly Affect Learning and School Performance Just as equivalence class formation is affected by learning history, there are a multitude of variables that affect school performance. Numerous factors affect outcomes including school variables, classroom instruction, and student variables (Sternberg, Torff, & Grigorenko, 1998). Student variables will be discussed as these are most relevant to the present study. Demographic variables (e.g., socioeconomic status or SES, family environment, age), educational history, social and be- havioral variables, motivation, knowledge, comprehension, and psychomotor variables all contribute to student outcomes (Bryant, Schulenberg, Bachman, O’Malley & Johnston, 2000; Cunningham & Stanovich, 1997; Demirbas & Yagbasan, 2006; M arjori banks, 2001; Morrison, Griffiths, & Alberts, 1997; Pin- trich, 2003; Price, 2002; Sarasson, 2004; Stevenson, 1972; Wang, Haertel, & Walberg, 1990). Demographic Variables. Various environmental and family variables have been shown to predict higher verbal achievement and, therefore, higher learning ability. Socioeconomic status, language ability, gender, and parenting are some variables that determine the extent to which a child has been exposed to lan- guage (Carroll, 1985; Okagaki & Frensch, 1998). The more early and diverse exposure a child has to language, the greater his/her verbal ability will be. Children from higher SES fami- lies and families wherein parents are more involved with chil- dren will develop greater verbal repertoires. A study of school- related outcomes in Australian adolescents found that early family learning experiences and reading achievement dem on - strated the greatest differentiation in outcomes (Marjoribanks, 2001). Differences have been found in children’s performances on word comprehension and knowledge, attitudes toward school and academic achievement, dependent on family attitude and approach to academics (Marjoribanks, 1987; Okagaki & Frensch, 1998). Brophy (1983) suggested that learning may depend on the degree to which a child is taught to value learn- ing opportunities and enjoy the process of learning. These val- ues are likely taught to children by parents, siblings, teachers, and other important people early in their life.  J. D. G EDDE S ET AL . Academic Performance and Behavior. Learning is most commonly measured through testing that occurs in school set- tings. However, test scores and grades reveal little about the specifics of learning and the role of the various factors in the learning process (Sarasson, 2004). A child may have the innate ability to learn but may be underachieving academically for numerous reasons. On the other hand, it has been found that many of the same variables that affect the basic learning proc- ess can also affect academic achievement and performance outcomes. Regardless of learning capacity or ability, if a child has had previous academic difficulties and failures, he/she may be less motivated toward future academic achievement, display poorer attitudes toward academics, and have a lower academic self-concept (Demirbas & Yagbasan., 2006; Guay, Marsh, & Boivin, 2003). Therefore, prior academic success can have positive implications for future learning (Catania, 1984). “Re- search findings over many years have consistently indicated that young people who do well in school tend to be interested in learning” (Weiner, 1992, p. 260). Many of the factors affecting academic achievement can also affect learning. Given this association, it is likely that there are associations between a child’s behavior and academic perfor- mance. Previous literature has also shown that lower school achievement has also been associated with children exhibiting more problem behavior (Ak & Sayil, 2006). Students whose early school experiences include misbehavior and failure have demonstrated decreases in academic achievement in the future (Bryant et al., 2000). Negative correlations have also been found between academic performance and problem behavior (Berndt & Mekos, 1995). Attitudes Toward School. A child’s motivation, attitude, temperament, and feelings toward school can also affect his/her learning and educational outcomes. Various studies have dem- onstrated that the way children learn can affect their ability to achieve academically (Sternberg et al., 1998). Positive correl a- tions between children’s attitudes toward school and academic achievement have been found (Ak & Sayil, 2006; Marjoribanks, 1992; Price, 2000). Children who have positive attitudes toward school demon- strate more positive learning outcomes and academic achieve- ments (Ak & Sayil, 2006; Weiner, 1992). A child’s emotions have been shown to have an impact on the learning process (Price, 2000). This has been demonstrated cross culturally in children in that academic achievement can be dependent on attitudes toward education, and cultural value placed on educa- tion and achievement patterns (Elliott, Hufton, HIldreth, & Illushin, 1999). Furthermore, students who have been identified as “regular class” students have been shown to express more positive attitudes toward academics than did students identified as “learning handicapped” (Macmillan, Widaman, Balow, Hemsley, & Little, 1992). It is likely that children who exper i- ence difficulties in learning hold more negative attitudes toward all academic subjects and school environments. The Current Study Childhood learning and school experiences will shape the academic future of our children. An examination of the factors that affect learning is, therefore, of great value to parents and educators. As previously mentioned, learning as measured by an MTS performance can be affected by a child’s attitudes about school, prior learning, behavior, and demographic factors. Therefore, children’s learning was examined in light of their attitudes toward school. This was examined in two ways: the r ate of learning directly trained symmetrical relations that paired school stimuli with valenced stimuli was examined, and per- formance in the testing phase which examines the formation of equivalence classes that contain these stimuli was measured. The following hypotheses were tested. First: children’s atti- tudes toward school would predict academic performance and behavior. Second: a child’s attitudes about school would medi- ate the relationship between their ability to learn (as measured by rate of learning in the testing phase, across classes, on a MTS task) and academic performance (as measured by teacher report), such that a child with positive attitudes toward school would demonstrate a better academic performance when ability was equal. This was examined utilizing data from the testing phase in a MTS task, along with report of attitudes as the inde- pendent variable. Method Participants. The sample for this study consisted of 46 children from pre-kindergarten (n = 25) and kindergarten (n = 20) classes (there was also 1 child form a 2nd grade class), in 2 public elementary schools (n = 14 and n = 22) in middle to lower middle class neighborhoods and 2 private elementary schools (n = 8 and n = 2) in upper middle class neighborhoods in the Southcentral United States. Children ages 4 years old (n = 13), 5 years old (n = 20), 6 years old (n = 11), and 7+ years old (n = 2) participated in the study. The mean age of all par- ticipants was 5.06 years. There were more males (n = 28) than females (n = 18) in this particular sample. Measures. A series of questionnaires were used to examine the child’s behavior and attitudes about school from the child, parent and teacher perspectives. A questionnaire was also given to parents to gather demographic information. Demographics Questionnaire. The parents or guardians of the participants completed a brief demographic questionnaire to determine the age, gender, diagnosis of learning disabilities (if any), developmental history and ethnicity of the child, as well as socioeconomic status (SES) of the family and whether the child has both parents residing in the home. See Table 1 for a complete reporting of demographics variables. Behavioral Assessment System for Children, Second Edi- tion (BASC-2). The BASC-2 (Reynolds & Kamphaus, 2004) is an assessment scale that measures the child’s observable be- havior as well as numerous positive and negative aspects of behavior and personality. For the purposes of the current study, the BASC-2 was utilized to validate the School Attitude and Behavior Questionnaire (SABQ) The BASC-2 is has a child self-report form as well as teacher and parent report forms. For the purposes of this study, only the parent rating scale was used. The scale is divided into age-appropriate forms, and parents compl eted the appropriate form for the corresponding age of their child. In this study, the preschool rating form covering ages 2-5 and the child rating form covering ages 6-11 were used. The items for each form are rated in a Likert-type format ranging from nev er to almost always. The preschool scale con- tains 134 items and the child scale contains 160 items. Each  J. D. G EDDE S ET AL. scale takes an average of 10 to 20 minutes to complete (Rey- nolds & Kamphaus, 2004). The preschool scale evidences a high alpha reliability for ages 4-5 in general population (coefficients ranging from .87 to .93). The preschool rating scale also has acceptable levels of interrater (.66 to .84) and test-retest reliabilities (.81 to .86) (Reynolds & Kamphaus, 2004). The child rating scale also has similarly high levels of alpha, test-retest, and interrater reliabil- ities. In this sample, the BASC-2 questionnaires were entered directly into the BASC-2 scoring software and as a result the internal consistency reliability could not be calculated. Table 1. Demographic Information. Demographic Variable N Age (n = 46) 4 years old 13 5 years old 20 6 years old 11 7+ years old 2 Grade (n = 45) P re-K 25 Kindergarten 20 Other 1 Gender (n = 46) Male 28 Female 18 School Hodge 22 Newton Rayzor 14 Primrose 8 Kid’s Corrall 2 Ethnicity (n = 30) European American 12 African American 3 Native American 1 Asia n 3 Hispanic 5 Bi-racial 3 Other 3 Parents Living @ Home (n = 30) Both Parents at Home 22 One Parent at Home 8 Developmental Problems (n = 30) Yes 4 No 26 Income (n = 29) 0 - $20,000 5 $20,001 - $40,000 7 $40,001 - $60,000 7 $60,001 - $80,000 2 $80,001 - $100,000 4 $100,000 + 4 School Refusal Assessment Scale-Revised (SRAS-R). The School Refusal Assessment Scale (Kear ne y , 2002) is a 24-item Liker t-type scale. The scale contains two forms: a child self- report and a parent report. The scales was originally normed on children as young as 6 years old, however, for the purposes of this study, parents of children as young as age 4 were asked to complete the survey. Given that the children being recruited for this study were young (many younger than 6), only the parent report was used. Responses to items range from ne ver (indica t- ing that the child never behaves in a certain way) to always (indicating that the child always behaves in a certain way). The scale examines school refusal across four different domains: 1- the child avoids school related stimuli that provoke a negative feeling; 2- the child seeks an escape from aversive social situa- tions; 3- the child seeks to avoid school to gain attention from others; and 4- the child seeks to avoid school to gain tangible reinforcement outside the school setting (Kearney, 2002). In this study, each of the domains were correlated with and used to validate the scores of a child’s attitudes toward school. The SRAS-R demonstrates acceptable test retest reliabilities at 7- to 14-day intervals. In the process of validating the meas- ures, the test retest correlations were calculated for each of the subscales listed above individually (the correlation coefficients were .63, .67, .78, and .61, respectively). Interrater reliabilities for each scale were also conducted (the reliability coefficients were .57, .49, .64, and .46, respectively). Acceptable concurrent validity, with the original scale, has also been demonstrated (r = .68) (Kearney, 2002). The current sample demonstrated ac- ceptable internal consistency reliability (α = .87). The internal consistency reliabilities were also calculated for each of the domains measured (α = .81, .45, .73, and .87, respectively) reliabilities were acceptable for the scales measuring each do- main, excluding the scale measuring escape from aversive situ- a tions. School Attitude/Behavior Questionnaire (SABQ). The SABQ was designed specifically for the purposes of this study (Ged- des, 2008). A review of current literature found no school atti- tude questionnaires for children as young as preschool and kindergarten. The SABQ was created to identify children’s attitudes toward school. Teachers were also asked to rate chil- dren’s current academic performance. Child, parent, and teacher forms were developed by identifying common themes ad- dressed in measures for older children and making them devel- opmentally appropriate, as well as practical for use by busy parents and teachers. The School Behavior Checklist, Behav- ioral Assessment Scale for Children, Child Behavior Checklist, and Teacher Rating of Academic Achievement Motivation Scale were reviewed (Achenbach, 1991; Miller, 1977; Rey- nolds & Kamphaus, 2004; Stinnett & Oehler-Stinnett, 1992), and similar items of relevance were included in the SABQ. The SABQ questionnaires were further reviewed and revised by a panel of experts. The child form asks the child how they feel about school. Children responded by saying “Yes” or “No” to 26 items ad- dressing feelings about school. Parent and teacher forms of the questionnaires had the adults respond to the questions in terms of how they think that the child would have responded. The questions on the parent and teacher forms are the same as the questions on the child questionnaire and are answered in the same format. However, the teacher report form has 15 addi- 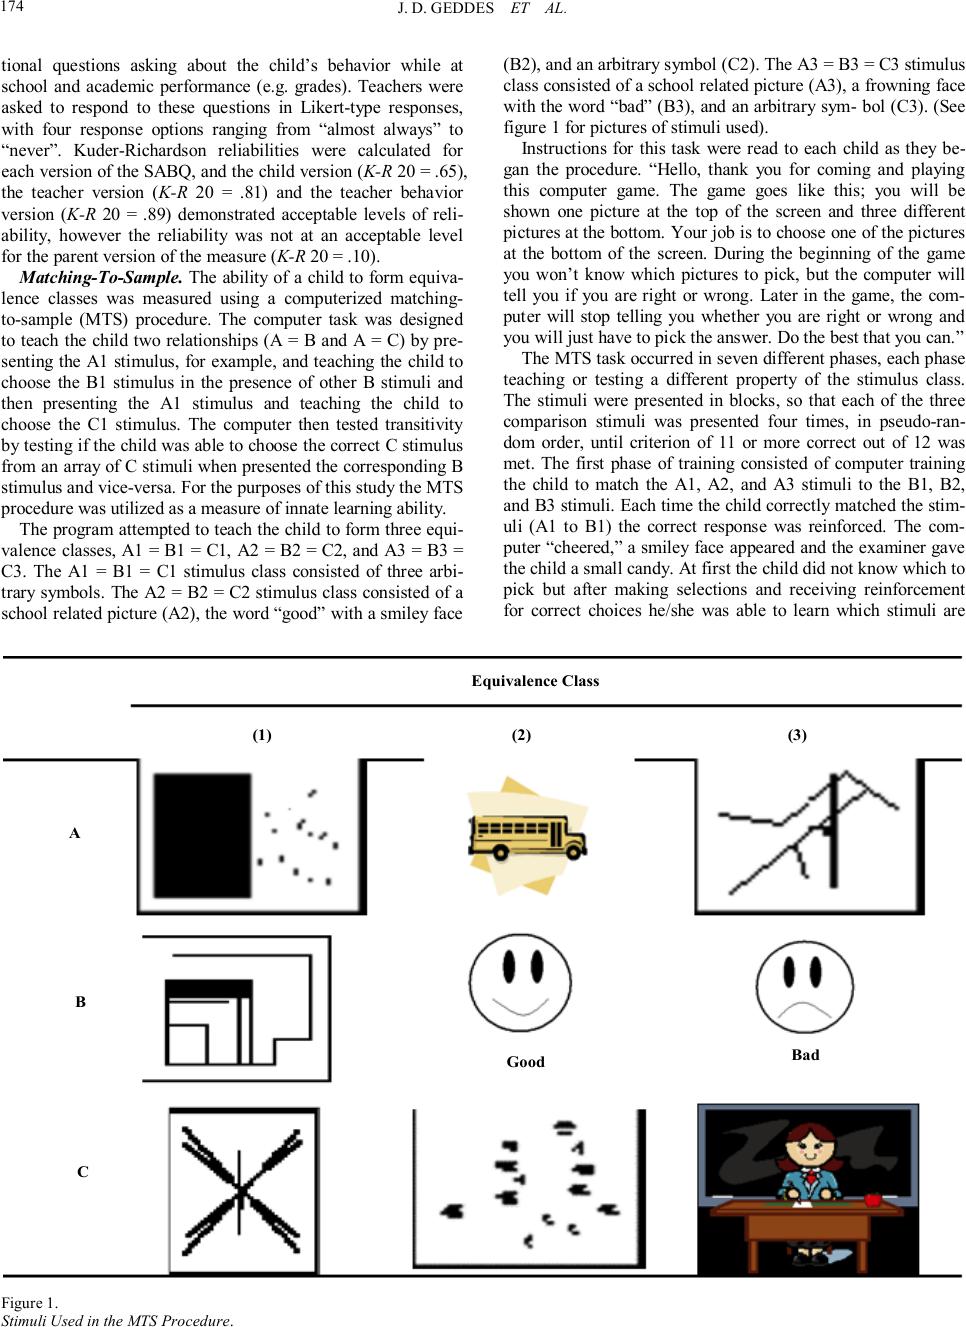 J. D. G EDDE S ET AL . tional questions asking about the child’s behavior while at school and academic performance (e.g. grades). Teachers were asked to respond to these questions in Likert-type responses, with four response options ranging from “almost always” to “never”. Kuder-Richardson reliabilities were calculated for each version of the SABQ, and the child version (K-R 20 = .65), the teacher version (K-R 20 = .81) and the teacher behavior version (K-R 20 = .89) demonstrated acceptable levels of reli- ability, however the reliability was not at an acceptable level for the parent version of the measure (K-R 20 = .10). M atching-To-Sample. The ability of a child to form equiva- lence classes was measured using a computerized matching- to-sample (MTS) procedure. The computer task was designed to teach the child two relationships (A = B and A = C) by pre- senting the A1 stimulus, for example, and teaching the child to choose the B1 stimulus in the presence of other B stimuli and then presenting the A1 stimulus and teaching the child to choose the C1 stimulus. The computer then tested transitivity by testing if the child was able to choose the correct C stimulus from an array of C stimuli when presented the corresponding B stimulus and vice-versa. For the purposes of this study the MTS procedure was utilized as a measure of innate learning ability. The program attempted to teach the child to form three equi- valence classes, A1 = B1 = C1, A2 = B2 = C2, and A3 = B3 = C3. The A1 = B1 = C1 stimulus class consisted of three arbi- trary symbols. The A2 = B2 = C2 stimulus class consisted of a school related picture (A2), the word “good” with a smiley face (B2), and an arbitrary symbol (C2). The A3 = B3 = C3 stimulus class consisted of a school related picture (A3), a frowning face with the word “bad” (B3), and an arbitrary sym- bol (C3). (See figure 1 for pictures of stimuli used). Instructions for this task were read to each child as they be- gan the procedure. “Hello, thank you for coming and playing this computer game. The game goes like this; you will be shown one picture at the top of the screen and three different pictures at the bottom. Your job is to choose one of the pictures at the bottom of the screen. During the beginning of the game you won’t know which pictures to pick, but the computer will tell you if you are right or wrong. Later in the game, the com- puter will stop telling you whether you are right or wrong and you will just have to pick the answer. Do the best that you can.” The MTS task occurred in seven different phases, each phase teaching or testing a different property of the stimulus class. The stimuli were presented in blocks, so that each of the three comparison stimuli was presented four times, in pseudo-ran- dom order, until criterion of 11 or more correct out of 12 was met. The first phase of training consisted of computer training the child to match the A1, A2, and A3 stimuli to the B1, B2, and B3 stimuli. Each time the child correctly matched the stim- uli (A1 to B1) the correct response was reinforced. The com- puter “cheered,” a smiley face appeared and the examiner gave the child a small candy. At first the child did not know which to pick but after making selections and receiving reinforcement for correct choices he/she was able to learn which stimuli are Figure 1. Stimuli Used in the MTS Procedure. 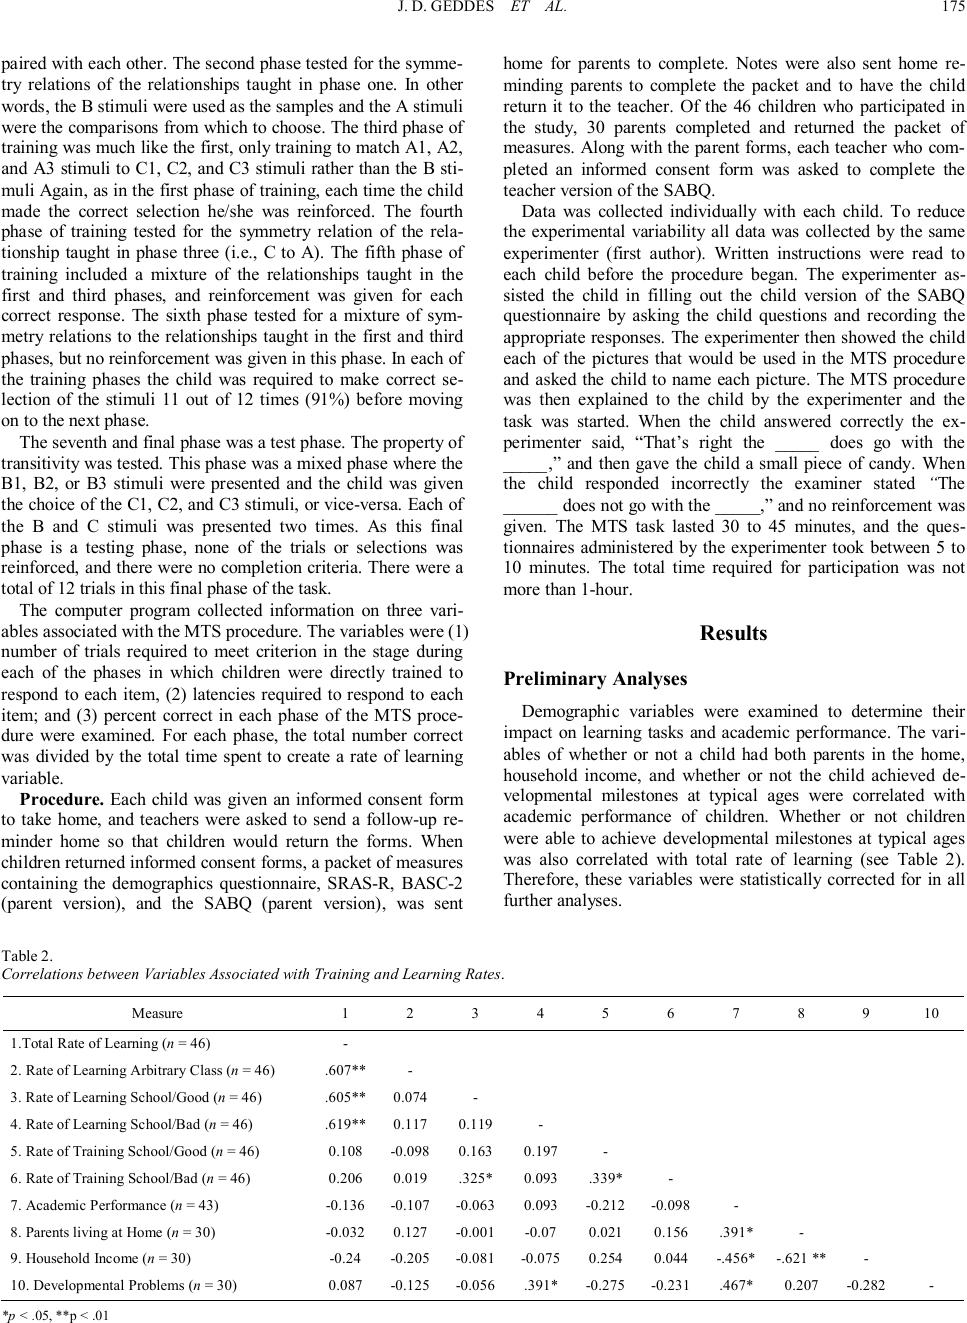 J. D. G EDDE S ET AL. paired with each other. The second phase tested for the symme- try relations of the relationships taught in phase one. In other words, the B stimuli were used as the samples and the A stimuli were the comparisons from which to choose. The third phase of training was much like the first, only training to match A1, A2, and A3 stimuli to C1, C2, and C3 stimuli rather than the B sti- muli Again, as in the first phase of training, each time the child made the correct selection he/she was reinforced. The fourth phase of training tested for the symmetry relation of the rela- tionship taught in phase three (i.e., C to A). The fifth phase of training included a mixture of the relationships taught in the first and third phases, and reinforcement was given for each correct response. The sixth phase tested for a mixture of sym- metry relations to the relationships taught in the first and third phases, but no reinforcement was given in this phase. In each of the training phases the child was required to make correct se- lection of the stimuli 11 out of 12 times (91%) before moving on to the next phase. The seventh and final phase was a test phase. The property of transitivity was tested. This phase was a mixed phase where the B1, B2, or B3 stimuli were presented and the child was given the choice of the C1, C2, and C3 stimuli, or vice-versa. Each of the B and C stimuli was presented two times. As this final phase is a testing phase, none of the trials or selections was reinforced, and there were no completion criteria. There were a total of 12 trials in this final phase of the task. The computer program collected information on three vari- ables associated with the MTS procedure. The variables were (1) number of trials required to meet criterion in the stage during each of the phases in which children were directly trained to respond to each item, (2) latencies required to respond to each item; and (3) percent correct in each phase of the MTS proce- dure were examined. For each phase, the total number correct was divided by the total time spent to create a rate of learning va r iable. Procedure. Each child was given an informed consent form to take home, and teachers were asked to send a follow -up re- minder home so that children would return the forms. When children returned informed consent forms, a packet of measures containing the demographics questionnaire, SRAS-R, BASC-2 (parent version), and the SABQ (parent version), was sent home for parents to complete. Notes were also sent home re- minding parents to complete the packet and to have the child return it to the teacher. Of the 46 children who participated in the study, 30 parents completed and returned the packet of measures. Along with the parent forms, each teacher who com- pleted an informed consent form was asked to complete the teacher version of the SABQ. Data was collected individually with each child. To reduce the experimental variability all data was collected by the same experimenter (first author). Written instructions were read to each child before the procedure began. The experimenter as- sisted the child in filling out the child version of the SABQ questionnaire by asking the child questions and recording the appropriate responses. The experimenter then showed the child each of the pictures that would be used in the MTS procedure and asked the child to name each picture. The MTS procedure was then explained to the child by the experimenter and the task was started. When the child answered correctly the ex- perimenter said, “That’s right the _____ does go with the _____,” and then gave the child a small piece of candy. When the child responded incorrectly the examiner stated “The ______ does not go with the _____,” and no reinforcement was given. The MTS task lasted 30 to 45 minutes, and the ques- tionnaires administered by the experimenter took between 5 to 10 minutes. The total time required for participation was not more than 1-hour. Results Preliminary Analyses De m ogra phic variables were examined to determine their impact on learning tasks and academic performance. The vari- ables of whether or not a child had both parents in the home, household income, and whether or not the child achieved de- velopmental milestones at typical ages were correlated with academic performance of children. Whether or not children were able to achieve developmental milestones at typical ages was also correlated with total rate of learning (see Table 2). Therefore, these variables were statistically corrected for in all further analyses. Table 2. Correlations between Variables Associated with Training and Learning Rates. Measu re 1 2 3 4 5 6 7 8 9 10 1.Total Rate of Learning (n = 46) - 2. Rate of Learning Arbitrary Class (n = 46) .607** - 3. Rate of Learning School/Good (n = 46) .605** 0.074 - 4. Rate of Learning School/Bad (n = 46) .619** 0.117 0.119 - 5. Rate of Training School/Good (n = 46) 0.108 -0.098 0.163 0.197 - 6. Rate of Training School/Bad (n = 46) 0.206 0.019 .325* 0.093 .339* - 7. Academic Performance (n = 43) -0.136 -0.107 -0.063 0.093 -0.212 -0.098 - 8. Parents living at Home (n = 30) -0.032 0.127 -0.001 -0.07 0.021 0.156 .391* - 9. Household Income (n = 30) -0.24 -0.205 -0.081 -0.075 0.254 0.044 -.456* -.621 ** - 10. Developmental Problems (n = 30) 0.087 -0.125 -0.056 .391* -0.275 -0.231 .467* 0.207 -0.282 - *p < .05, **p < .01 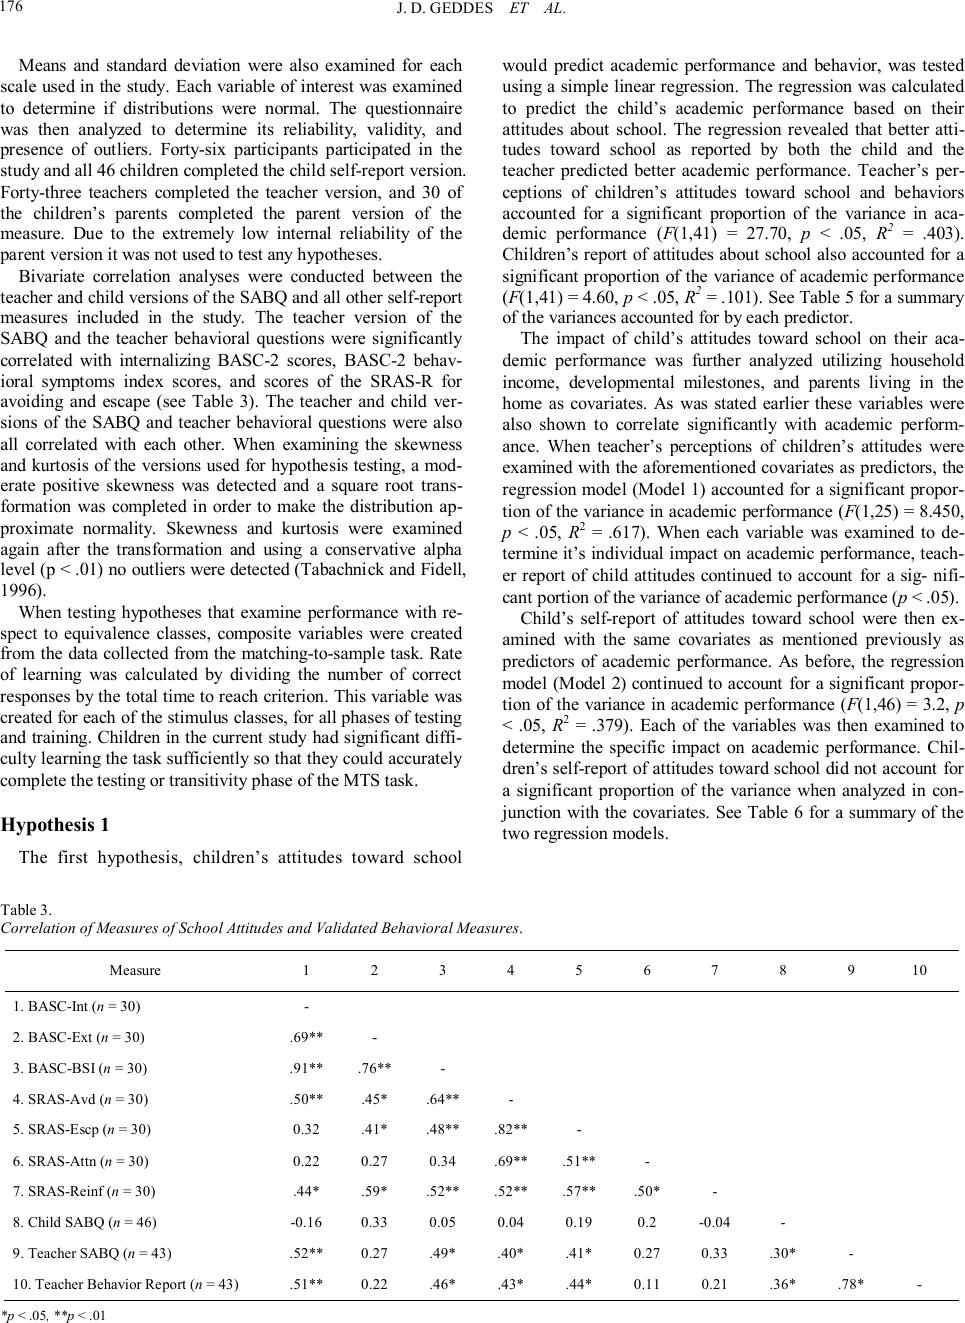 J. D. G EDDE S ET AL . Means and standard deviation were also examined for each scale used in the study. Each variable of interest was examined to determine if distributions were normal. The questionnaire was then analyzed to determine its reliability, validity, and presence of outliers. Forty-six participants participated in the study and all 46 children completed the child sel f-report version. Forty-three teachers completed the teacher version, and 30 of the children’s parents completed the parent version of the measure. Due to the extremely low internal reliability of the parent version it was not used to test any hypotheses. Bivariate correlation analyses were conducted between the teacher and child versions of the SABQ and all other self-report measures included in the study. The teacher version of the SABQ and the teacher behavioral questions were significantly correlated with internalizing BASC-2 scores, BASC-2 behav- ioral symptoms index scores, and scores of the SRAS-R for avoiding and escape (see Table 3). The teacher and child ver- sions of the SABQ and teacher behavioral questions were also all correlated with each other. When examining the skewness and kurtosis of the versions used for hypothesis testing, a mod- erate positive skewness was detected and a square root trans- formation was completed in order to make the distribution ap- proximate normality. Skewness and kurtosis were examined again after the transformation and using a conservative alpha level (p < .01) no outliers were detected (Tabachnick and Fidell, 1996). When testing hypotheses that examine performance with re- spect to equivalence classes, composite variables were created from the data collected from the matching-to-sample task. Rate of learning was calculated by dividing the number of correct responses by the total time to reach criterion. This variable was created for each of the stimulus classes, for all phases of testing and training. Children in the current study had significant diffi- culty learning the task sufficiently so that they could accurately complete the testing or transitivity phase of the MTS task. Hypothesis 1 The first hypothesis, children’s attitudes toward school would predict academic performance and behavior, was tested using a simple linear regression. The regression was calculated to predict the child’s academic performance based on their attitudes about school. The regression revealed that better atti- tudes toward school as reported by both the child and the teacher predicted better academic performance. Teacher’s per- ceptions of children’s attitudes toward school and behaviors accounted for a significant proportion of the variance in aca- demic performance (F(1,41 ) = 27.70, p < .05, R2 = .403). Children’s report of attitudes about school also accounted for a significant proportion of the variance of academic performance (F(1,41) = 4.60, p < .05, R2 = .101). See Table 5 for a summary of the variances accounted for by each predictor. The impact of child’s attitudes toward school on their aca- demic performance was further analyzed utilizing household income, developmental milestones, and parents living in the home as covariates. As was stated earlier these variables were also shown to correlate significantly with academic perfor m - ance. When teacher’s perceptions of children’s attitudes were examined with the aforementioned covariates as predictors, the regression model (Model 1) accounted for a significant propor- tion of the variance in academic performance (F( 1,25 ) = 8.450, p < .05, R2 = .617). When each variable was examined to de- termine it’s individual impact on academic performance, teach- er report of child attitudes continued to account for a sig- nifi- cant portion of the variance of academic performance (p < .05). Child’s self-report of attitudes toward school were then ex- amined with the same covariates as mentioned previously as predictors of academic performance. As before, the regression model (Model 2) continued to account for a significant propor - tion of the variance in academic performance (F(1,46) = 3.2, p < .05, R2 = .379). Each of the variables was then examined to determine the specific impact on academic performance. Chil- dren’s self-report of attitudes toward school did not account for a significant proportion of the variance when analyzed in con- junction with the covariates. See Table 6 for a summary of the two regression models. Table 3. Correlation of Measures of School Attitudes and Validated Behavioral Measures. Measu re 1 2 3 4 5 6 7 8 9 10 1. BASC-Int (n = 30) - 2. BASC-Ext (n = 30) .69** - 3. BASC-BSI (n = 30) .91** .76** - 4. SRAS-Avd (n = 30) .50** .45* .64** - 5. SRAS-Escp (n = 30) 0.32 .41* .48** .82** - 6. SRAS-Attn (n = 30) 0.22 0.27 0.34 .69** .51** - 7. SRAS-Reinf (n = 30) .44* .59* .52** .52** .57** .50* - 8. Child SABQ (n = 46) -0.16 0.33 0.05 0.04 0.19 0.2 -0.04 - 9. Teacher SABQ (n = 43) .52** 0.27 .49* .40* .41* 0.27 0.33 .30* - 10. Teacher Behavior Report (n = 43) .51** 0.22 .46* .43* .44* 0.11 0.21 .36* .78* - *p < .05, **p < .01  J. D. G EDDE S ET AL. Hypothesis 2 The second hypothesis stated that a child’s attitudes about school (as measured by the SABQ) would mediate the rela- tionship between their ability to learn (as measured by the overall latency and number of correct responses on the MTS in the final testing/transitivity phase) and academic performance as measured by teacher report such that a child with positive attitudes toward school would demonstrate a better academic performance when ability is equal. As per Baron and Kenny’s (1986) suggested approach to test for mediation effects, the first analysis conducted was a linear regression predicting a child’s academic performance based on his/her rate of learning. Results indicated that a child’s rate of learning did not predict his/her academic performance (R2 = .019, F (1,36) = .682, p > .05). A child’s academic performance was not significantly predicted by their rate of learning and therefore violated the first condi- tion necessary to establish a mediation effect (Baron & Kenny, 1986). However, when further analysis was conducted (linear re- gression predicting child attitudes from rate of learning) it was discovered that the rate of learning predicted a child’s attitudes toward school as reported by the teacher (R2 = .209, F (1, 36) = 9.54, p < .05). However the rate of learning did not signi f y- cantly predict the child self-report of attitudes toward school (AdjR 2 = .014, F (1, 39) = 1.588, p = .215). A third linear re- gression was conducted utilizing only SABQ-T scores to pre- dict academic performance. Results indicated that a child’s attitudes, as reported by the teacher, contributed significantly to the variance in academic performance (F (1,41) = 27.70, p < .05, R2 = .403). Correlations between all variables used in the ana lyses can be found in Table 4. Dis cussio n The purpose of this study was to examine the factors that af- fect learning and academic performance in early school-aged children, specifically, looking at children’s attitudes toward school, demographic variables, and behavior. The results of hypothesis testing, clinical implications, limitations of the cur- rent study and future directions of this area of research will be discussed. Table 4. Summary of Mediation Analysis (n = 42). Regression R F Β P 1- Rate of learning predicting academic performance. .019 .682 -.136 .414 2- Rate of Learning Predicting Attitudes (SABQ-T) .209 9.54 -.458 .004 3- Rate of Learning Predicting Attitudes (SABQ-C) .014 1.59 -.198 .215 4- Attitudes (SABQ-T) Predicting Academic Performance .403 27.70 .635 .000 Table 5. Summary of Simple Regression Analyses for Variables Predicting Aca- demic Achievement (n = 42). Variable R F β P SABQ-T .403 27.70 .635 .000 Table 6. Summary of Simple Multiple Regression Analysis with Covariates for Variables Predicting Academic Achievement (N = 25). Model 1 Model 2 SABQ-C -.128 .111 -.264 Parents @ home .459* .118* .586* .191 .169 .197 F 8.45* 3.2* *p < .05 Conclusion Ability, Attitudes, and Academic Performance. It was hy- pothesized that a child's attitudes about school would mediate the relationship between their learning ability and academic performance, such that positive attitudes toward school would result in better academic performance. The outcomes did not support the meditational hypothesis, however results indicated that a child’s learning ability was predictive of his/her attitudes toward school (as reported by the teacher), but not his/her per- formance. This predictive pathway was supported by previous research that demonstrates a child’s learning history can have an impact and direct correlation with their academic perfor m- ance (Hauser-Cram, Durand, & Warfield, 2007). A child who demonstrated an increased learning ability also demonstrated more positive attitudes toward school (as attitudes were re- ported by the teacher). These results however, did not indicate that a child’s learning ability was predictive of their academic perf or mance. Previous literature stated that children who learn more quickly and with greater ease also do better academically (Ca rroll, 1985). Children in the current study had significant difficulty learn- ing the task sufficiently so that they could accurately complete the testing or transitivity phase of the task. In previous literature children received training in equivalence relations over a period of days and numerous sessions, while in the current study only one training session was completed. If children had been trained sufficiently so that a higher percentage were able to make the transitive connections of the equivalence relations, there would have likely been some difference in academic per- formance for children who had a lower rate of learning. There was also little variability in children’s academic performance as reported by the teachers. The results of the current study sug- gest that a child’s attitudes about school do not mediate the relationship between learning ability and academic performance. However, further research with additional training sessions could yield differential results. The more pronounced learning differences potentially demonstrated by further training would provide better information for the analysis of impact on aca- demic performance and attitudes. Academic Performance and School Behavior. It was hy- pothesized that children’s attitudes about school would predict academic performance and behavior. Results supported the hypothesis and indicated that children’s attitudes toward school, as measured by the SABQ, predicted their academic perfor m - ance, in that children with more positive attitudes toward school  J. D. G EDDE S ET AL . performed better academically. This finding was consistent with previous research, which demonstrated that children’s attitudes toward school positively correlated with academic performance (Ak & Sayil, 2006; Elliott et al., 1999; Hauser- Cram et al., 2007; Marjoribanks, 1992; Price, 2000). Hauser- Cram et al. 2007 conducted a study with children in kindergar- ten and first grade which revealed that beginning school with a positive attitude about school will place children at an advan- tage over children who enter school with negative attit ud es. Children who have positive feeling toward school will likely have a greater motivation to learn and to succeed. On the other hand, children who have negative attitudes toward school may be singled out or ignored by teachers and, therefore, further lose interest in school (Hauser-Cram et al., 2007). A child’s attitudes can have a significant impact on the learning process (Price, 2000). A child’s negative attitudes toward school may be the result of a variety of events. Previous failure can lead to nega- tive attitudes about school and academics, which may lead to less motivation and perpetuate the academic failure in the fu- ture (Demirbas & Yagbasan, 2006). General Implications. The current study has several implica- tions for educators working with young children and for parents of young children during early school years. A child’s expe ri- ences in early school years will shape his/her attitudes about school and subsequently be a significant influence on future academic performance. The way that children feel about school will affect their motivation and willingness to work toward attaining good grades and positive academic outcomes. If chil- dren’s negative attitudes about school and the source of those attitudes are ascertained early educators and parents can address those causes of negative attitudes and attitudes. Children may be able to change their outlook on school and increase their probability of positive academic outcomes. Children who have difficulty learning and who learn at a slower rate display poorer attitudes about school, additionally those children who have poorer attitudes about school also demonstrate worse academic performance. On the other hand, there is no significant direct prediction of academic perform - ance based on learning ability. While it cannot be said that learning ability directly predicts academic performance, by influencing a child’s attitudes about school may i ndirectly in- fluence academic performance. While many believe that inher- ent learning ability (or intelligence) is an innate and immutable biological factor, others believe that it can be influenced and changed depending upon the child’s context (Ak & Sayil, 2006; Carroll, 1985; Stevenson, 1972). If an early measure of learning ability or learning ability were to be devised, using a type of MTS, parents and teachers may be able to target and remediate learning deficiencies that could be contributing to children’s poor attitudes about school. If learning ability can be increased and learning deficiencies remediated, attitude toward school may become more positive; and, again, academic outcomes would likely increase. Children’s ability to associate school with positive stimuli or with negative stimuli does not seem to be affected by their attitudes about school or by their academic performance. This data suggests that young children’s attitudes toward school may be easily influenced or changed if they have had previously negative attitudes about school. Limitations. The current study offered valid findings that may have a significant impact and considerable implications for future childhood education. However there were numerous limitations of this project. First, the children who participated in the study were very young and many of them, in pre-kinder- garten and kindergarten class, were in their first year of school. As stated earlier, Zill and West (2001) found that children who are just starting school have mostly positive attitudes toward school. This resulted in little variability in student reports of their attitudes. Research has also shown that young children typically show a “yes-bias,” often answering “yes” to questions that are phrased in a yes-no choice manner (Moriguchi, Okanda, & Itakura, 2008). The measure that was used to determine child attitudes was constructed in a yes-no format, with most of the questions being positively worded. Teacher and child reports of child attitudes had acceptable internal consistency reliability; however, parental reports showed extremely low internal consistency reliability. Perhaps this can be explained by the fact that most student attitudinal measures are based on a single component, and may not accurately pre- dict the construct (Subramaniam & Silverman, 2007). Hist ori- cally parents have proven to be poor reporters of their chil- dren’s behavior and attitudes. It should also be noted that a teacher’s previous feelings about a student may have biased their ratings of the child’s attitudes and behavior, as well a re- ports of academic performance. Future studies should observe children and code their behavior, and obtain school records or administer specific academic measures in order to reduce this bias. Further limitations of the SABQ as a measure of school atti- tudes exist. A review of literature revealed that there was no current validated measure of school attitudes for young children. The SABQ demonstrated reliability and validity problems, particularly with different versions of the measure. Further validation of the SABQ with child, parent, and teacher popula- tions would be beneficial. Additionally, teacher’s reports on the current SABQ could have been problematic based on a teacher’s previous experience with the child and current biases that they held toward each individual child. The MTS procedure was conducted on a laptop computer. Most previous studies that utilized MTS with young children were conducted using cards. Children initially had considerable difficulty with the MTS procedure on the computer. There may have been variables associated with technology and completing the MTS task on a computer that influenced the child’s meas- ured learning ability. A computer that used a touch screen al- lowing children to physically touch and identify the stimuli would likely avoid the limitations present due to the computer. Additionally, the amount of time per session that the children were required to participate may have resulted in some fatigue and caused increased difficulties with the MTS task. Children have demonstrated some previous difficulty recognizing faces in prior MTS tasks (Mondloch & Thomson, 2008). Children may have had the same type of difficulty in recognizing differ- ences in the stimuli that were used in this study. When exami n- ing variables related to school, the stimuli that were used to represent school may not have been relevant to school for some children. Additionally, no studies to date were found that estab- lished a baseline criteria for stimulus class acquisition. Future studies should allow children to choose the stimuli that repre- sent school or the phenomena being studied as well as seek to establish baseline acquisition criteria.  J. D. G EDDE S ET AL. The sample size for the current study was small and data was gathered from participants at four different schools: two public schools with 14 and 22 participants at each school and two private schools, with 8 and 2 participants. In addition there was a somewhat large age range (4-7 years-old), which may have resulted in differential performances in the cognitive task. The small number of participants in each group in the study also limited the power, of some of the statistical analyses used, to detect an effect. Results may not be generalizable to the popu- lation based on the small samples gathered from individual schools and the extremely small samples from private schools. Particularly given the potential that children who attend public vs. private schools may be different. However, it may have been difficult to detect this difference given the small sample size. Children who experienced some developmental delays dis- played correlations with child attitudes, learning ability, and academic achievement. Again there was a very small number (n = 4) of parents who reported some developmental “problems” in their children. Further investigation into learning disabilities and developmental delays with larger populations of children with these problems, may yield more information as to their true effects on learning ability and school attitudes. Future Directions. As with most psychological research, reproduction of the current study should be undertaken with a larger and more diverse population to increase the external validity and generalizability of findings. Research could be conducted with older children to determine if the phenomena found in young children are the same with older children. Older children would also likely display greater variability in their attitudes about school. Longitudinal research in this area would be especially beneficial in that researchers could follow chil- dren, examine how attitudes toward school develop and change, and the effects that has on children’s educational outcomes and learning ability in school. When conducting further research on more diverse populations, researchers should take nested mod- els into consideration, in that students with teachers who are in different schools, in different districts, in different states, may perform differently and that students in the same group may share some variance. Researchers should obtain as wide a vari- ety of samples from schools, teachers, districts and states to obtain the most generalizable results possible. Additionally, recruiting more children to participate, as well as more children who have been diagnosed with learning disorders would pro- vide additional useful information as to the effect of learning difficulties on attitudes toward school and academic outcomes. Lastly, the current study suggests future directions for inter- vention in the early education of students. Children who have poor attitudes toward school early may have difficulties aca- demically. If poor attitudes could be identified early, teacher and parents could then intervene and seek the reason for the negative attitudes about school. If parents and teachers could find the reasons behind children’s poor attitudes about school, these issues could then be addressed, and this would likely decrease the probability of poor outcomes. Ac know le dg ements The authors would like to thank the North Texas Contextual Psychology Group for research support, edits and revisions s ug ge stions. References Ak, L., & Sayil, M. (2006). Three different types of elementary school students’ school achievements, perceived social support, school atti- tudes and behavior-adjustment problems. Educational Sciences: Theory & Practice, 6, 293-300. Achenbach, T. M. (1991). Manual for the Child Behavior Check- list/4-18 and 1991 profile. Burlington, VT: University of Vermont, Department of Psychiatry. Baron, R., & Kenny, D. (1986). The moderator-mediator variable dis- tinction in social psychological research: Conceptual, strategic, and statistical considerations. Journal of Personality and Social Psy- chology, 51, 1173-1182. doi:10.1037/0022-3514.51.6.1173 Berndt, T., & Mekos, D. (1995). Adolescents' perceptions of the stress- ful and desirable aspects of the transition to junior high school. Jour- nal of Research on Adolescence, 5, 123-142. doi:10.1207/ s15327795jra0501_6 Bryant, A., Schulenberg, J., Bachman, P., O’Malley, P., & Johnston, L. (2000). Understanding the links among school misbehavior, acdemic achievement, and cigarette use: A national panel study of adolescents. Prevention Science, 1, 71-87. doi:10.1023/A:1010038130788 Brophy, J. (1983). Conceptualizing student motivation. Educational Psychologist, 18, 200-215. Carroll, J. B. (L.W. Anderson, Ed.). (1985). Perspectives on school learning. Hillsdale, NJ: Lawrence Earlbaum Associates. Catania, C. (1984). Learning (2nd ed.). Englewood Cliffs, NJ: Pren- tice-Hall. Cunningham, A. E., & Stanovich, K. E. (1997). Reading acquisition and its relation to reading experience and ability 10 years later. Deve- lopmental Psychology, 33, 934-945. doi:10.1037/0012-1649.33.6. 934 De Rose, J., De Souza, D., & Hanna, E. (1996). Teaching reading and spelling: Exclusion and stimulus equivalence. Journal of Applied Behavior Analysis, 29, 451-469. doi:10.1901/jaba.1996.29-451 Demirbas, M., & Yagbasan, R. (2006). An evaluative study of social learning theory based scientific attitudes on academic success, gen- der and socio-emotional level. Educational Sciences: Theory & Pra- ctice, 6, 363-371. Devaney, J. M., Hayes, S.C., & Nelson, R.O. (1986). Equivalence class formatin in language-able and language-disabled children. Journal of the Experimental Analysis of Behavior, 46, 243-257. doi:10.1901/ jeab.1986.46-243 Dougher, M., Augustson, E., Markham, M., Greenway, D., & Wulfert, E. (1994). The transfer of respondent eliciting and extinction func- tions through stimulus equivalence classes. Journal of Experimental Analysis of Behavior, 62, 331-351. doi:10.1901/jeab.1994.62-331 Elliott, J. G., Hufton, N., Anderman, E., & Illushin, L. (2000) The Psychology of Motivation and Its Relevance to Educational Practice. Educational and Child Psychology, 17, 121-137. Geddes, J. D. (2008). The school attitude and behavior questionnaire. Unpublished measure. Measure can be obtained by contacting cor- responding author. Guay, F., Marsh, H. W., & Boivin, M. (2003). Academic self-concept and academic achievement: Developmental perspectives and their causal ordering. Journal of Educational Psychology, 95, 124-136. doi:10.1037/0022-0663.95.1.124 Hauser-Cram, P., Durand, T., & Warfield, M. (2007). Early feelings about school and later academic outcomes of children with special needs living in poverty. Early Childhood Research Quarterly, 22, 161-172. doi:10.1016/j.ecresq.2007.02.001 Hayes, S., Gifford, E., & Townsend, R. (2001). In: S.C. Hayes, D. Barne s-Holmes, & B. Roche (Eds.), Relational frame theory: A post-Skinnerian account of human language and cognition (pp. 87-101). New York, NY, Kluwer Academic/Plenum Publishers. Kearney, C. A. (2002). Identifying the function of school refusal be- havior: A revision of the school refusal assessment scale. Journal of Psychopathology and Behavioral Assessment, 24, 235-245. doi:10.1023/A:1020774932043  J. D. G EDDE S ET AL . Macmillan, D., Widaman, K., Balow, I., Hemsley, R., & Little, T. (19- 92). Differences in adolescent school attitudes as a function of aca- demic level, ethnicity, and gender. Learning Disability Quarterly, 15, 39-50. doi:10.2307/1510564 Marjoribanks, K. (1987). Ability and attitude correlates of academic achievement: Family-group differences. Journal of Educational Psychology, 79, 171-178. doi:10.1037/0022-0663.79.2.171 Marjoribanks, K. (1992). Family capital, children's individual attributes, and academic achievement. Journal of Psychology, 126, 529-538. Marjoribanks, K. (2001). Factors affecting the learning environments and school-related outcomes of Australian adolescents. Journal of Social Psychology, 135, 89-95. doi:10.1080/00224545.1995.9711406 Melchiori, L., De Souza, D., & De Rose, J. (2000). Reading, equiva- lence, and recombination of units: A replication with students with different learning histories. Journal of Applied Behavior Analysis, 33, 97-100. doi:10.1901/jaba.2000.33-97 Miller, L. C. (1977). School Behavior Checklist manual. Los Angeles, CA: WPS/Western Psychological Services. Mondloch, C., & Thomson, K. (2008). Limitation in 4-year-old chil- dren’s sensitivity to the spacing among facial features. Child Devel- opment, 79, 1512-1523. doi:10.1023/A:1020774932043 Morrison, F., Griffiths, E., & Alberts, D. (1997). Nature-nurture in the classroom: Entrance age, school readiness, and learning in children. Developmental Psychology, 33, 254-262. doi:10.1037/0012-1649. 33.2.254 Moriguchi, Y., Okanda, M., & Itakura, S. (2008). Young children’s yes bias; How does it relate to verbal ability, inhibitory control and the- ory of mind? First Language, 28, 431-442. doi:10.1177/ 0142723708092413 Novak, G., & Pelaez, M. (2004). Child and adolescent development: A behavioral systems approach. Thousand Oaks, California: Sage Pub- lications. Strand, P., Barnes-Holmes, Y., & Barnes-Holmes, D. (2003). Educating the whole child: Implications of behaviorism as a science of meaning. Journal of Behavioral Education, 12, 105-117. doi:10.1023/ A:1023833619332 Okagaki, L., & Frensch, P. A. (1998). Parenting and children’s school achievement: A multiethnic perspective. American Educational Re- search Journal, 35, 123-144. Price, H. (2000). Being happy is what matters most: A look at two high-achieving girls’ learning experiences in the classroom. Psycho - analytic Studies, 2, 51-64. doi:10.1080/146089500114083 Price, H. (2002). The emotional context of classroom learning: A psy- choanalytic perspective. European Journal of Psychotherapy, Coun- seling & Health, 5, 305-320. Peoples, M., Tierney, K., Bracken, M., & Mackay, C. (1998). Prior le- arning and equivalence class formation. Psychological Record, 48(1), 111-120. Pintrich, P. R. (2003). A motivational science perspective on the role of student motivation in learning and teaching contexts. Journal of Edu- cational Psychology, 95, 667-686. doi:10.1037/0022-0663.95.4.667 Plaud, J. J. (1995). The formation of stimulus equivalence classes: Fear-relevant and fear-irrelevant stimulus classes. Psychological Re- cord, 45, 207-222. Reynolds, C., & Kamphaus, R. (2004). Behavioral assessment system for children, second edition. Pearson Assessments, Bloomington, MN. Sarasson, S. (2004). And what do you mean by learning?. Portsmouth, NH: Heinemann. Sidman, M. (1971). Reading and auditory-visual equivalences. Journal of Speech and Hearing Research, 14, 5-13. Sidman, M. (1977). Teaching some basic prerequisites for reading. In P. Mittler (Ed.), Research to practice in mental retardation: 2. Educa- tion and training (pp. 353-360). Baltimore, MD: University Park Press. Sidman, M. (1994). Equivalence relations and behavior: A research story. Boston: Authors Cooperative. Sternberg, R.J., Torff, B., & Grigorenko, E.L. (1998).Teaching triar- chically improves school achievement. Journal of Educational Psy- chology, 90, 1-11. Stevenson, H. W. (1972). Children’s learning. New York: Appleton- Century-Crofts. Stinnett, T. A., & Oehler-Stinnett, J. (1992). Validation of the teacher rating of academic achievement motivation. Journal of Psychoedu- cational Assessment, 10, 276-290. doi:10.1177/07342829920100 0307 Subramaniam, P., & Silverman, S. (2007). Middle school students’ atti- tudes toward physical education. Teaching and Teacher Education, 23, 602-611. doi:10.1016/j.tate.2007.02.003 Tabachnick, B. G., & Fidell, L. S. (1996). Using multivariate statistics (3rd ed.). New York: Harper Collins. Wang, M. C., Haertel, G. D., & Walberg, H. J. (1990). What influences learning? A content analysis of review literature. Journal of Educa- tional Research, 84, 30-43. Watt, A., Keenan, M., Barnes, D., & Cairns, E. (1991). Social catego- rization and stimulus equivalence. The Psychological Record, 41, 33-50. Weiner, B. (1992). Human motivation: Metaphors, theories, and re- search. Thousand Oaks, CA: Sage Publications. Zill, N., West, J. (2001). Entering kindergarten: A portrait of American children when they begin school. Findings from the condition of education, 2000. Wa s hington, D.C.: National Center for Education Stati st ics,  J. D. G EDDE S ET AL. Appe nd i x Child School Attitude Questionnaire Circle the answer that 1. Do you like school? Y N 2. Do you like homewor k? Y N 3. Would you rather be at home than school? Y N 4. Do you think that you are good at schoolwork? Y N 5. Do you like your teacher? Y N 6. Do you like being at school? Y N 7. Do you have friends at school? Y N 8. Do you think school is boring? Y N 9. Do you pretend to be sick to stay home from school? Y N 10. Do you like your classroom? Y N 11. Does school make you happy? Y N 12. Do you like to learn new things at school? Y N 13. Do you follow the rules at school? Y N 14. Do you get in trouble at school? Y N 15. Do you get along with other kids in your class? Y N 16. Are you scared of going to school? Y N 17. Is it hard to talk to other kids at school? Y N 18. Do you fight with your parents about going to school? Y N 19. Do you have fun at school? Y N 20. Do you get upset at school? Y N 21. Are you getting good grades in your class? Y N 22. Do you like rece ss ? Y N 23. Are other kids mean to you at school? Y N 24. Do you like the principal? Y N 25. Do you ever say no when your parents ask you to get ready for school? Y N 26. Do you want to make good grades in school? Y N 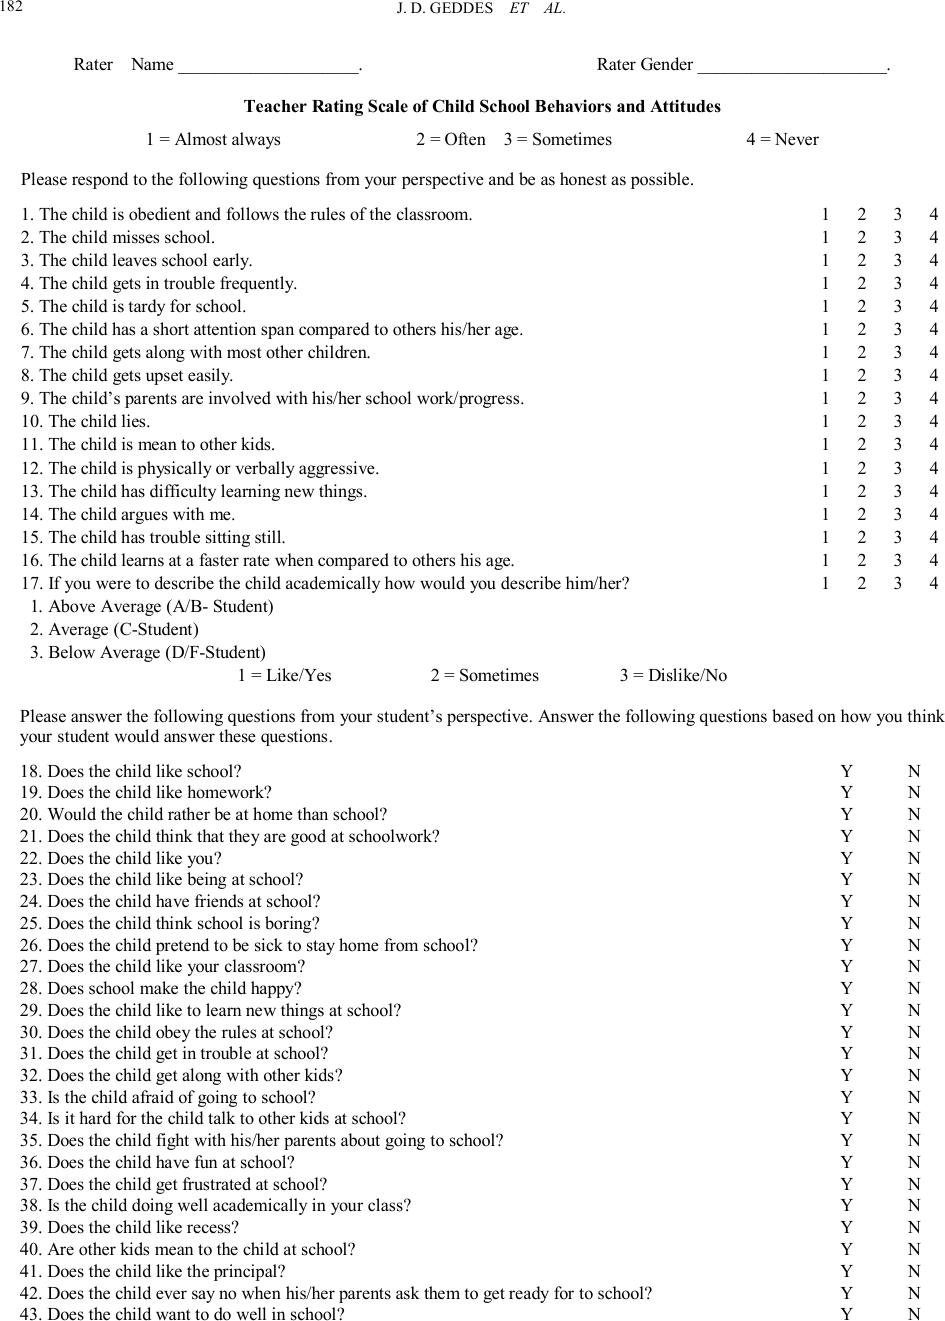 J. D. G EDDE S ET AL . Rater Name ____________________. Rater Gender _____________________. Teacher Rating Scale of Child School Behaviors and Attitudes 1 = Almost always 2 = Often 3 = Sometimes 4 = Never Please respond to the following questions from your perspective and be as honest as possible. 1. The child is obedient and follows the rules of the classroom. 2. The child misses school. 1 2 3 4 3. The child leaves school early. 4. The child gets in trouble frequently. 1 2 3 4 5. The child is tardy for school. 6. The child has a short attention span compared to others his/her age. 1 2 3 4 7. The child gets along with most other children. 8. The child gets upset easily. 1 2 3 4 9. The child’s parents are involved with his/her school work/progress. 10. The child lies. 1 2 3 4 11. The child is mean to other kids. 1 2 3 4 12. The child is physically or verbally aggressive. 13. The child has difficulty learning new things. 1 2 3 4 14. The child argues with me. 15. The child has trouble sitting still. 1 2 3 4 16. The child learns at a faster rate when compared to others his age. 17. If you were to describe the child academically how would you describe him/her? 1 2 3 4 1. Above Average (A/B- Student) 2. Average (C-S tude nt) 3. Below Average (D/F-Student) 1 = Like/Yes 2 = Sometimes 3 = Dislike/No Please answer the following questions from your student’s perspective. Answer the following questions based on how you think your student would answer these questions. 18. Does the child like school? 19. Does the child like homework? 20. Would the child rather be at home than school? Y N 21. Does the child think that they are good at schoolw ork? 22. Does the child like you? 23. Does the child like being at school? 24. Does the child have friends at school? 25. Does the child think school is boring? 26. Does the child pretend to be sick to stay home from school? 27. Does the child like your classroom? 28. Does school make the child happy? 29. Does the child like to learn new things at school? 30. Does the child obey the rules at school? 31. Does the child get in trouble at school? 32. Does the child get along with other kids? 33. Is the child afraid of going to school? 34. Is it hard for the child talk to other kids at school? 35. Does the child fight with his/her parents about going to school? 36. Does the child have fun at school? Y N 37. Does the child get frustrated at school? 38. Is the child doing well academically in your class? 39. Does the child like recess? 40. Are other kids mean to the child at school? 41. Does the child like the principal? 42. Does the child ever say no when his/her parents ask them to get ready for to school? 43. Does the child want to do well in school ? 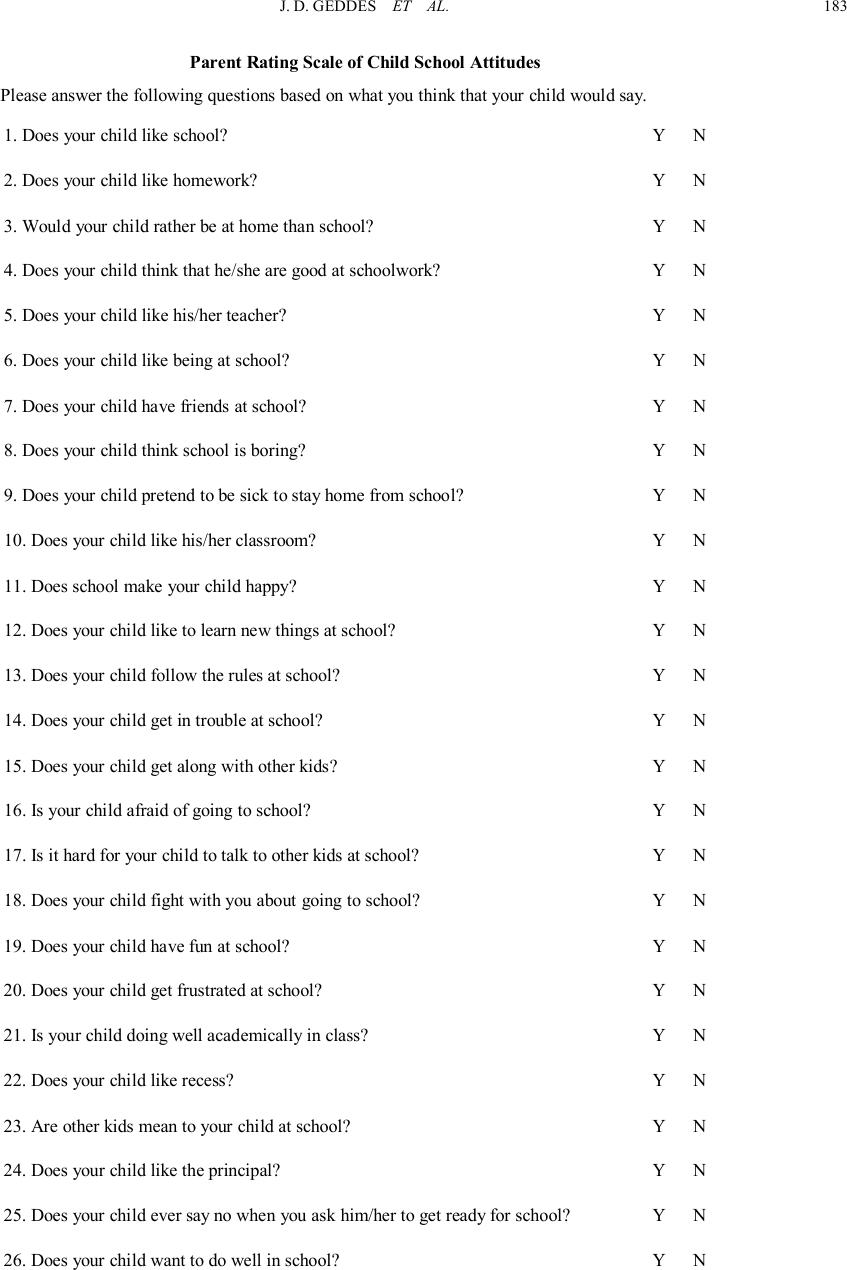 J. D. G EDDE S ET AL. Parent Rating Scale of Child School Attitudes Please answer the following questions based on what you think that your child would say. 1. Does your child like school? Y N 2. Does your child like homework? Y N 3. Would your child rather be at home than school? Y N 4. Does your child think that he/she are good at schoolwork? Y N 5. Does your child like his/her teacher? Y N 6. Does your child like being at school? Y N 7. Does your child have friends at school? Y N 8. Does your child think school is boring? Y N 9. Does your child pretend to be sick to stay home from school? Y N 10. Does your child like his/her classroom? Y N 11. Does school make your child happy? Y N 12. Does your child like to learn new things at school? Y N 13. Does your child follow the rules at school? Y N 14. Does your child get in trouble at school? Y N 15. Does your child get along with other kids? Y N 16. Is your child afraid of going to school? Y N 17. Is it hard for your child to talk to other kids at school? Y N 18. Does your child fight with you about going to school? Y N 19. Does your child have fun at school? Y N 20. Does your child get frustrated at school? Y N 21. Is your child doing well academically in class? Y N 22. Does your child like recess? Y N 23. Are other kids mean to your child at school? Y N 24. Does your child like the principal? Y N 25. Does your child ever say no when you ask him/her to get ready for school? Y N 26. Does your child want to do well in school? Y N
|