 Food and Nutrition Sciences, 2013, 4, 31-38 http://dx.doi.org/10.4236/fns.2013.47A005 Published Online July 2013 (http://www.scirp.org/journal/fns) Electrochemical Detection of Zeranol and Zearalenone Metabolic Analogs in Meats and Grains by Screen-Plated Carbon-Plated Disposable Electrodes Ming-Kun Hsieh1, Huiru Chen2, Jen-Lin Chang3, Wei-Shao She2, Chi-Chung Chou2* 1Graduate Institute of Microbiology and Public Health, College of Veterinary Medicine, National Chung-Hsing University, Taichung, Chinese Taipei, 2Department of Veterinary Medicine, College of Veterinary Medicine, National Chung-Hsing University, Taichung, Chinese Taipei, 3Department of Chemistry, College of Science, National Chung-Hsing University, Taichung, Chinese Taipei. Email: *ccchou@nchu.edu.tw Received March 28th, 2013; revised April 30th, 2013; accepted May 9th, 2013 Copyright © 2013 Ming-Kun Hsieh et al. This is an open access article distributed under the Creative Commons Attribution License, which permits unrestricted use, distribution, and reproduction in any medium, provided the original work is properly cited. ABSTRACT Zeranol (Z) is an estrogenic growth-promoting agent synthesized from mycotoxin zearalenone (Zen). Inadvertent con- sumption of Z and its structural analogs from meat or grain products remain a food safety concern. An economic and rapid high performance liquid chromatography method with electrochemical detection using disposable screen-printed carbon electrode is developed for determination of Z, Zen and 3 major metabolic analogs α-zearalenol (α-Ze), β- zearalenol (β-Ze), and β-zearalanol (β-Za). The electrochemical method was validated for application in food matrices including beef, pork, feed and cereal after optimized liquid and/or solid-phase extraction procedures. All 5 Z analogs were separated in 10 minutes with the limits of detection ranging from 15 ng/ml for α-Ze and 25 ng/ml for Z and Zen; the limit of quantitation ranged from 40 - 50 ng/ml. The recoveries were all above 75% regardless of matrix types and extraction procedures. The intra and inter day variations were both less than 6% at the nominal concentration of 1 μg/ml and less than 13% at 100 ng/ml level. Chromatographically time-matched peaks of Z, α-Ze and β-Za were observed in moldy feed, cereal and rice with high productivity, indicating possible grain-specific Zs exposure for animals and hu- man. Proper exercise of preservative procedures for grain and grain products to prevent it from mold production is im- perative. The simplicity and reproducibility of this method affords quick and reliable quantitation of multiple types of Z analogs in food products and can offer semi-confirmative information comparable to UV detection and supplementary to ELISA screening. Keywords: Zeranol; Moldy; Grain; Electrochemical; Carbon Electrode 1. Introduction Zearalenone (Zen) is one of the few fungal resorcylic acid lactones characterized with estrogenic activity back in 1979 [1]. Known as a myctoxin, Zen is produced by several species of Fusarium spp. that grows on grains including maize, oat, barley, wheat, and sorghum [2-4]. The major metabolites of Zen are α-zearalenol (α-Ze), β- zearalanol (β-Za), β-zearalenol (β-Ze) and zeranol (Z) [3-5]. These compounds exhibit distinct estrogenic and anabolic properties, resulting in diverse endocrine dis- ruptions effects to human and animals [6-8]. Among the metabolic analogs, Z is semi-synthesized by chemical re- duction of Zen to be used for improvement of feed con- version efficiency and promotion of growth rates in live- stock production. It has been widely used in the cattle industry in the United States and believed to also possess endocrine disruptive effects in human consumers [9-11] as well as in rats, dogs, and monkeys effecting predomi- nantly changes in mammary glands and organs of the reproductive system [1,7,10,12]. The mutagenic, terato- genic, and carcinogenic properties of Z were also sug- gested [8,10,13], therefore, application of Z was banned in the European Union (EU) since 1985 [14] and was monitored for imported meat derived from countries where cattle was given this synthetic hormone. Therefore, not only Zen and its metabolic analogs (Zs) may con- taminate food commodities from moldy grains, animals consuming contaminated feeds [15] or veterinary use of Z-implantation could also result in residual Zs in meat *Corresponding author. Copyright © 2013 SciRes. FNS 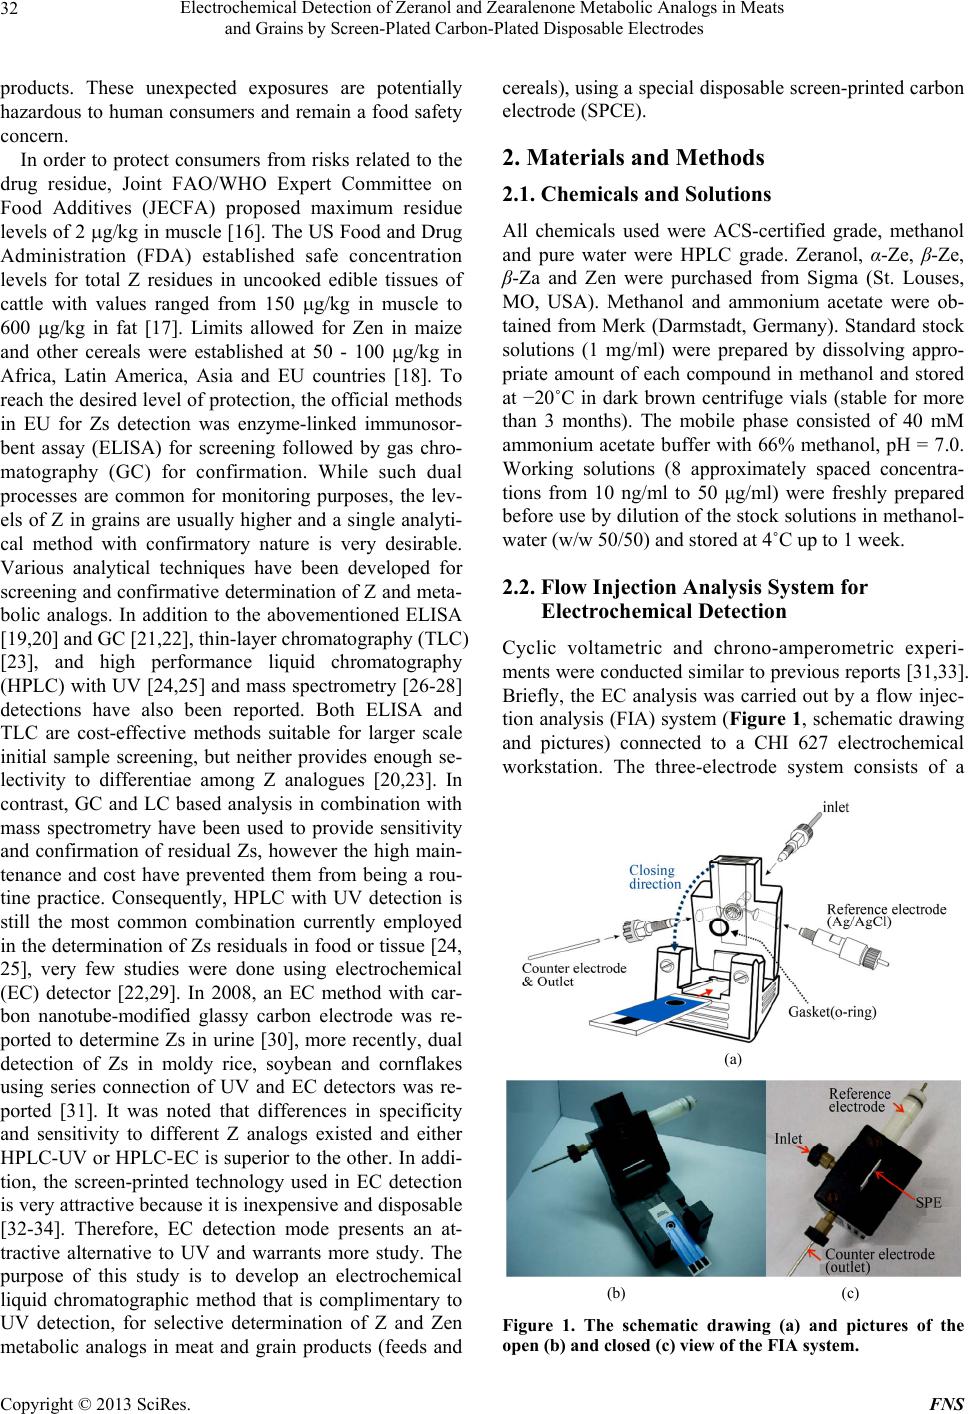 Electrochemical Detection of Zeranol and Zearalenone Metabolic Analogs in Meats and Grains by Screen-Plated Carbon-Plated Disposable Electrodes 32 products. These unexpected exposures are potentially hazardous to human consumers and remain a food safety concern. In order to protect consumers from risks related to the drug residue, Joint FAO/WHO Expert Committee on Food Additives (JECFA) proposed maximum residue levels of 2 g/kg in muscle [16]. The US Food and Drug Administration (FDA) established safe concentration levels for total Z residues in uncooked edible tissues of cattle with values ranged from 150 g/kg in muscle to 600 g/kg in fat [17]. Limits allowed for Zen in maize and other cereals were established at 50 - 100 g/kg in Africa, Latin America, Asia and EU countries [18]. To reach the desired level of protection, the official methods in EU for Zs detection was enzyme-linked immunosor- bent assay (ELISA) for screening followed by gas chro- matography (GC) for confirmation. While such dual processes are common for monitoring purposes, the lev- els of Z in grains are usually higher and a single analyti- cal method with confirmatory nature is very desirable. Various analytical techniques have been developed for screening and confirmative determination of Z and meta- bolic analogs. In addition to the abovementioned ELISA [19,20] and GC [21,22], thin-layer chromatography (TLC) [23], and high performance liquid chromatography (HPLC) with UV [24,25] and mass spectrometry [26-28] detections have also been reported. Both ELISA and TLC are cost-effective methods suitable for larger scale initial sample screening, but neither provides enough se- lectivity to differentiae among Z analogues [20,23]. In contrast, GC and LC based analysis in combination with mass spectrometry have been used to provide sensitivity and confirmation of residual Zs, however the high main- tenance and cost have prevented them from being a rou- tine practice. Consequently, HPLC with UV detection is still the most common combination currently employed in the determination of Zs residuals in food or tissue [24, 25], very few studies were done using electrochemical (EC) detector [22,29]. In 2008, an EC method with car- bon nanotube-modified glassy carbon electrode was re- ported to determine Zs in urine [30], more recently, dual detection of Zs in moldy rice, soybean and cornflakes using series connection of UV and EC detectors was re- ported [31]. It was noted that differences in specificity and sensitivity to different Z analogs existed and either HPLC-UV or HPLC-EC is superior to the other. In addi- tion, the screen-printed technology used in EC detection is very attractive because it is inexpensive and disposable [32-34]. Therefore, EC detection mode presents an at- tractive alternative to UV and warrants more study. The purpose of this study is to develop an electrochemical liquid chromatographic method that is complimentary to UV detection, for selective determination of Z and Zen metabolic analogs in meat and grain products (feeds and cereals), using a special disposable screen-printed carbon electrode (SPCE). 2. Materials and Methods 2.1. Chemicals and Solutions All chemicals used were ACS-certified grade, methanol and pure water were HPLC grade. Zeranol, α-Ze, β-Ze, β-Za and Zen were purchased from Sigma (St. Louses, MO, USA). Methanol and ammonium acetate were ob- tained from Merk (Darmstadt, Germany). Standard stock solutions (1 mg/ml) were prepared by dissolving appro- priate amount of each compound in methanol and stored at −20˚C in dark brown centrifuge vials (stable for more than 3 months). The mobile phase consisted of 40 mM ammonium acetate buffer with 66% methanol, pH = 7.0. Working solutions (8 approximately spaced concentra- tions from 10 ng/ml to 50 μg/ml) were freshly prepared before use by dilution of the stock solutions in methanol- water (w/w 50/50) and stored at 4˚C up to 1 week. 2.2. Flow Injection Analysis System for Electrochemical Detection Cyclic voltametric and chrono-amperometric experi- ments were conducted similar to previous reports [31,33]. Briefly, the EC analysis was carried out by a flow injec- tion analysis (FIA) system (Figure 1, schematic drawing and pictures) connected to a CHI 627 electrochemical workstation. The three-electrode system consists of a (a) (b) (c) Figure 1. The schematic drawing (a) and pictures of the open (b) and closed (c) view of the FIA system. Copyright © 2013 SciRes. FNS  Electrochemical Detection of Zeranol and Zearalenone Metabolic Analogs in Meats and Grains by Screen-Plated Carbon-Plated Disposable Electrodes 33 working electrode (SPCE, screen-printed carbon elec- trode, geometric area = 0.2 cm2), an Ag/AgCl reference electrode and a platinum auxiliary electrode (geometric area = 0.07 cm2). The HPLC system consists of a Hitachi L-6200 intelligent pump drive, a Rheodyne model 7125 sample injector (20 μl sample loop) with an inter-con- necting Teflon tube and the flow cell. The disposable SPCE electrode (Zensor R & D, Taichung, Taiwan) was placed in the center of the specially designed electro- chemical flow cell, first washed by deionized water and followed by pre-anodization with a potential of 20 V for 20 sec. The electrode was then equilibrated in mobile phase at 1 V until the current become constant. Chroma- tographic separations were performed using a Cosmosil C18 AR-II column (150 mm × 4.6 mm i.d., Nacalai tes- que, Inc., Japan). Various potentials (from −800 mV to 1200 mV) and flow rates (400 to 1000 μl/ml) were tested for optimal conditions. Chromatographic data were ana- lyzed with CHI system software (CH Instruments, Inc., USA). 2.3. Assay Validation Accuracy and precision of the method were accessed for each analog at 3 spiked concentrations (100 ng/ml, 1 and 100 μg/ml) in water/methanol (w/w 50/50). The valida- tion was assessed by carrying out 4 replicate analyses daily for at least 3 different days. Recoveries of liquid and solid-phase extraction (SPE) procedures at 4 differ- ent matrices were carried out in triplicate at 2 nominal concentration levels (1 and 10 μg/ml). Precision was ex- pressed as the relative standard deviation (RSD) of the mean from the quadruplicated runs. The limit of detec- tion (LOD) was set as 3-times the averaged baseline noise level (S/N > 3) while the limit of quantitation (LOQ) was set as 10 times the averaged baseline noise level (S/N > 10). 2.4. Sample Preparation and Extraction Procedure A total of 112 meat samples including beef (45 imported, 20 domestic samples), pork (34 samples) and chicken (13 samples) were purchased from the supermarkets in the north, middle, south and east regions of Taiwan (cover- ing more than 10 counties). 10 feed samples were col- lected from collaborating pig farms. Cereals were pur- chased from local food chain stores. For analysis of meat, feeds and cereals, samples were first grounded before homogenization with 5 volumes (2 g/10ml) of methanol for 90 sec. The mixture was then placed on a reciprocal shaker for 3 min before it was centrifuged at 3000 rpm for 10 min. The supernatant was aspirated and 20 μl was used for HPLC-EC injection. Solid phase extraction was carried out using 3 ml of the supernatant obtained from the abovementioned extraction procedure and diluted 5 folds in pH 4.0 acetic acid water as starting solution. Bond-Elute SPE cartridges (500 mg, 3 ml, Varian Inc.) were first conditioned with 2 ml of methanol followed by 2 ml of acetic acid water (pH 4.0) before sample applica- tion. After washing by 10 ml of distilled water, the target compounds were eluted by 1 ml of methanol and 20 μl was injected into HPLC-EC system. Meat samples were first screened for immunoreactive Z activity by a com- mercial EIA (Euro-Diagnostica, Spain); samples exhibit- ing Z concentration greater than 1 ng/ml by EIA were further subjected to the developed HPLC-EC confirma- tion. To prepare moldy samples, 5 g of feed, rice and ce- reals were moistened with 5 ml tap water and incubated at 37˚C for 2 weeks. The moldy sample was then ex- tractedand chromato graphically analyzed as stated above. 3. Results 3.1. Electrode Response and Linearity Representative cyclic voltammograms (CV) for Zs in 40 mM ammonium acetate buffer with 66% methanol, pH = 7.0 using SPCE is shown in Figure 2 (left panel). In comparison to mobile phase alone, the addition of Zs induced an increase in anodic current at the potential of 0.7 to 1.2 V. Accordingly, the optimal detection potential was set at 1 V to maximize the increase of target signal without significantly increase the background current. Four different flow rates (400, 600, 800 and 1000 μl/min) was tested and 1000 μl/min was selected in view of better peak resolution and shorter retention time (data not shown). The amperometric current responses were linear from 50 ng/ml to 25 μg/ml for all 5 Zs (Figure 2, right panel). The optimum analytical conditions were deter- mined to be: detection potential 1 V, flow rate 1 ml/min, injection volume 20 μl. Separations were carried out on a Cosmosil C18 AR-II column with a mobile phase con- sisted of 40 mM ammonium acetate buffer with 66% methanol, pH = 7.0. The quantification of all samples was achieved by measuring the oxidation current from chronoamperometric signals. 3.2. Validation of HPLC-EC Method The quantitative responses of Zs, including retention time, limit of detection (LOD), limit of quantitation (LOQ) and linear working range, are summarized in Ta- ble 1. All of the Zs peaks were resolved within 10 min- utes as shown in the typical HPLC-EC chromatograms (Figure 3, lower panel). The retention times in the order of appearance were - Za, -Ze, Z, -Ze, and Zen. The LOD of Zs ranged from 5 ng/ml for -Ze to 25 ng/ml for Z and Zen, while the 1 Copyright © 2013 SciRes. FNS  Electrochemical Detection of Zeranol and Zearalenone Metabolic Analogs in Meats and Grains by Screen-Plated Carbon-Plated Disposable Electrodes Copyright © 2013 SciRes. FNS 34 Table 1. The quantitative responses of Z and its metabolites by HPLC-EC method (n = 6). RT LOD LOQ Linear range Linear Equation R2 Zeranol 461 25 50 0.05 - 25 f(x) = −3.066e−8x + 3.384e−7 0.999 α-zearalenol 531 15 40 0.05 - 25 f(x) = 1.779e−8x + 2.810e−7 0.999 β-zearalanol 301 20 45 0.05 - 25 f(x) = 2.937e−8x + 2.880e−7 0.996 β-zearalenol 351 20 45 0.05 - 25 f(x) = −7.956e−9x + 2.896e−7 0.997 zearalenone 593 25 45 0.05 - 25 f(x) = −9.194e−9x + 3.048e−7 0.999 Note: RT = retention time (sec); LOD = limit of detection (ng/ml); LOQ = limit of quantitation (ng/ml); Linear range (μg/ml). Figure 3. Standard chromotogram of Z and its metabolites using the SPCE. Mobile phase: 40 mM ammonium acetate with 67% methanol, pH = 7.0. Detection potential was set at 1 V. Representative chromatograms of moldy rice extracts by HPLC-EC detection using SPCE. (a) (b) Figure 2. Cyclic voltammogram (a) and linearity (b) of Z and its metabolites. Solid-line indicating background and short dash-lines representing Zs at 10 g/ml and 20 g/ml. SPCE electrode, potential window −0.8 to 1.2 V, scan rate, 10 mV/s. shown in Table 3. All metabolic analogs had good per- cent recoveries (above 75%) with methanol extractions in general showed slightly higher percentage than the SPE. Differential recoveries across Z and analogs or among different matrices were observed. At 1 µg/ml level, while -Ze, and Zen tended to have higher recovery than the other analogs, the recovery of Zs in pork was also higher than in beef and cereal (Table 3). LOQ ranged from 40 ng/ml for -Ze to 50 ng/ml for Z. The working linear range covers 500 folds of concentra- tion difference (50 ng/ml to 25 μg/ml) and the correlation coefficients of at least 0.99 were obtained for each Zs. The intra and inter day variations of the developed EC detection of Zs at three nominal concentrations are listed in Table 2. The average inter and intra day variations were all below 13% at 100 ng/ml level and less than 6% at 1 µg/ml level. The recoveries of 5 Zs standards from various food matrices at 2 nominal concentrations (1 and 10 g/ml) after liquid and solid-phase extractions were 3.3. Applications to Meat, Feed, Cereal and Rice Samples One hundred and twelve meat samples were first screened  Electrochemical Detection of Zeranol and Zearalenone Metabolic Analogs in Meats and Grains by Screen-Plated Carbon-Plated Disposable Electrodes 35 Table 2. Intra-day and inter-day variations of EC method. Intra-day (RSD%) Inter-day (RSD%) 100 ng/ml 1 μg/ml 100 μg/ml 100 ng/ml 1 μg/ml 100 μg/ml Zeranol 12.45 4.88 3.80 10.26 4.202.78 α-zearalenol 12.40 5.98 4.29 11.08 5.042.96 β-zearalenol 9.63 5.28 4.84 10.76 4.863.11 β-zearalanol 9.67 4.08 5.22 10.56 4.053.05 zearalenone 8.58 5.50 4.65 7.12 3.55 2.59 for immunoreactive Z activity by a commercial EIA. The results indicated that only 6 of 112 meat samples (5.3%) exhibited Z immunoreactivity greater than 1 ng/ml but below 2 ng/ml. Since all samples contain total Zs well below the LOD of each Z analog, the HPLC-EC quanti- tation/confirmation was not performed in these samples. Similar to meat samples, freshly obtained feed and cereal samples did not yield any peaks chromatographically coincide with Z standards in retention time. However, chromatographically time-matched peaks of Z and -Za in moldy rice and Z and α-Ze in moldy feed and cereal (Figures 3 and 4) were detected and preliminarily con- firmed with co-injection of suspected Z standards. These moldy grain samples exhibited high yields of Z and cer- tain analogs, namely up to 80 µg/ml of α-Ze and 500 µg/ml of Z were detected in moldy cereal, while about 2 µg/ml α-Ze and 80 µg/ml of Z was detected in moldy feed. 4. Discussions A reverse-phase HPLC method with EC detection using a disposable screen-printed carbon electrode was devel- oped for the determination and confirmation of Z and Zen analogs in food commodities, namely meat, cereal and rice. Feeds from swine farms are also investigated in view of the fact that animals consuming Fusarium-in- fected feed could also leave metabolic Zs residues in the meat, Quick analysis was achieved by resolving 5 Zs peaks within 10 minutes. The LOD and LOQ are compa- rable to those of the UV detection and the method showed good linearity range and precision. The devel- opment of EC method using carbon electrode is advan- tageous due to its low cost in comparison to other elec- trodes (boron-doped diamond, multi-wall carbon nano- tube modified glassy carbon, copper, and gold) [30] such that a single-use purpose disposable designed is possible. In this study, a disposable electrochemical sensor, pre- anodized screen-printed carbon electrode (SPCE), is de- veloped with low cost, good stability and satisfactory sensitivity as semi-confirmative analytical tools. By em- ploying a reverse-phase separation, compound with a higher polarity eluted first and lower polarity the latter, this is demonstrated in the elution order such that β-Za has the shortest retention time while Zen the longest. Interestingly, the rank order of amperometric current strength (β-Za > β-Ze > Z > α-Ze = Zen) correlated well with the rank order of elution time, i.e., the rank order of amperometric responses coincided with the order of po- Table 3. Recovery of zeranol and metabolic analogs in different matrices by liquid (methanol) or solid phase extractions (SPE) n = 3. 1 μg/ml (%) 10 μg/ml (%) Beef Pork Feed Cereal Beef Pork Feed Cereal Zeranol Methanol 75.4 ± 2.6 113.4 ± 13.4 86.4 ± 14.3 85.0 ± 9.4 77.3 ± 6.0 109.2 ± 6.1 84.4 ± 3.0 77.1 ± 2.2 SPE 86.8 ± 12.5 96.6 ± 7.8 50.4 ± 3.3 74.5 ± 17.8103.9 ± 4.5 123.1 ± 8.3 74.5 ± 8.9 73.4 ± 3.1 α-zearalenol Methanol 100.7 ± 8.7 115.1 ± 10.3 105.3 ± 19.592.9 ± 1.0 82.2 ± 5.1 110.7 ± 5.2 87.8 ± 5.0 75.8 ± 3.4 SPE 76.9 ± 7.8 99.8 ± 10.5 78.4 ± 15.1 65.8 ± 10.0100.1 ± 3.4 124.7 ± 7.6 87.6 ± 11.2 70.8 ± 3.1 β-zearalenol Methanol 81.7 ± 1.9 103.0 ± 2.3 109.3 ± 9.8 72.1 ± 1.1 80.3 ± 6.8 107.7 ± 6.6 81.1 ± 3.9 78.5 ± 3.5 SPE 103.3 ± 7.8 97.5 ± 5.8 60.9 ± 3.5 75.6 ± 11.8101.1 ± 3.0 121.1 ± 8.1 88.3 ± 9.2 70.1 ± 3.1 β-zearalanol Methanol 88.4 ± 7.9 104.2 ± 8.5 92.8 ± 6.4 71.2 ± 4.3 77.8 ± 7.5 105.7 ± 4.2 75.0 ± 5.3 78.6 ± 4.5 SPE 90.5 ± 7.1 101.8 ± 5.2 30.4 ± 11.7 85.5 ± 6.7 97.3 ± 3.2 117.9 ± 8.0 68.9 ± 6.4 69.5 ± 3.0 Zearalenone Methanol 89.7 ± 13.7 115.6 ± 8.9 107.2 ± 18.097.1 ± 2.8 74.8 ± 6.7 107.9 ± 4.3 76.9 ± 2.0 78.3 ± 4.6 SPE 100.8 ± 13.0 85.1 ± 7.9 52.8 ± 7.4 71.6 ± 11.1102.1 ± 4.7 118.5 ± 7.9 71.9 ± 6.0 72.0 ± 4.0 Copyright © 2013 SciRes. FNS  Electrochemical Detection of Zeranol and Zearalenone Metabolic Analogs in Meats and Grains by Screen-Plated Carbon-Plated Disposable Electrodes 36 Figure 4. Representative chromatograms of blank and moldy feed and cereal extracts by HPLC-EC detection using SPCE. Co-injection of Z standard was performed to confirm the presence of suspected Z peak. Analytical conditions refer to the materials and methods. larity, suggesting that the electrical current of each Zs is associated with its hydrophilicity. The stronger oxidative currents of β-Za and β-Ze than α-Ze and Zen might be related with the stereo-structural differences in the es- terial group. Feasible explanations of differential signal strength may also include the closer association of the hydroxyl group on carbon 6 to the surface electron of SPCE, resulting in higher affinities and oxidative cur- rents for β-Za and β-Ze. The polarity of these Z analogs may also influence their recovery efficiencies in metha- nol extraction. Higher percentage recoveries were ob- served in α-Ze and Zen, which are less hydrophilic among the 5 Zs. The recovery of Zs is generally higher in liquid extraction, with the exception that the recovery for meat samples are higher after further SPE, this is likely resulting from the better cleaning effect of more compli- cated meat matrix. Putting together, the efficiency in the EC detection of Zs is different from that observed for UV detection [21,31], suggesting the complementary nature of these 2 detection modes and underlines the importance of this method development. Past studies have suggested that long-term consump- tion of low, but biologically active levels of Zs post po- tential health risk to human [10,11,35], therefore, it is important to understand if such levels of Zs contained in our daily food. The rice products have been investigated in a previous study [31], since beef from Z-implanted cattle is regularly imported to Taiwan, a total of 112 meat samples (including 45 import beef and some domestic beef, pork and chicken samples) were under investigation in the current study. The samples were first screened for immunoreactive Z activity by a commercial EIA and the results indicated that only 6 of the 112 meat samples (5.3%) exhibited Z immunoreactivity greater than 1 ng/ml and all 6 Z-positive samples were below 2 ng/ml, suggesting that the residual levels of Zs in meat in Tai- wan is very low. In fact, all Zs levels detected were be- low the 50 - 1000 ng/ml FAO-established regulatory lev- el, indicating the consumption of these meat products are likely with guarded safety. On the contrary, the natu- rally molded feeds (which contain various grain ingredi- ents), cereal and rice samples presented high levels of suspected Zs and/or analogues. Among the tested sam- ples, similar distribution of Zs in moldy feed and cereal were discovered. The results indicated that while both Z and α-Ze were found in these 2 moldy matrices, β-Za and Z was found in moldy rice (Figures 3 and 4). However, the percentage to which specific Zs metabolites were produced in feed and cereal was different, further com- parison suggested that cereal had higher yield of Z than the feed and moldy rice produced the least level of Z. These observations suggest that different metabolite pat- tern might be presented in different grain matrices, it is also possible that feed contains less percentage of grain matrices that could be utilized by the fungi for Z produc- tion. These data was consistent with a previous study in which corn flakes and rice had the highest and lowest yield of Z, respectively [31]. The estimated production of Z and α-Ze in moldy cereal and feed was very high, which were more than 1000-folds higher than the total Z allowed in EU regulations for edible grains. Although the high productivity were found in raw materials and pro- duced under experimental conditions, exposure to any kind of moldy grains should be carefully avoided and it is imperative to exercise proper preservative procedures for grain and grain products to prevent it from mold pro- duction. In the current natural molding experiment, 3 Z me- tabolites were detected with the exception of Zen, which is distinct from the general recognition that Zen is the major mycotoxin produced after Fusarium contamination. Since Candida tropicalis, and Saccharomyces also have the ability to metabolize Zen to become other Zs [36,37], it is likely that the growth of not only one Fusarium spp. but also other fungi in the environment also contributed to the metabolism of Zen to Z. The variation in fungi species in Taiwan may also partly explain why rice had the lowest ability of producing Zs. Nevertheless, multiple Z analogs could be detected in a natural occurring moldy feed, cereal and rice culture in Taiwan, and it is impor- tant to utilize the developed method to routinely survey the prevalence of each Z analogs in grain and meat prod- ucts in Taiwan. In conclusion, the developed method is very useful for Copyright © 2013 SciRes. FNS  Electrochemical Detection of Zeranol and Zearalenone Metabolic Analogs in Meats and Grains by Screen-Plated Carbon-Plated Disposable Electrodes 37 a direct and fast routine analysis of Z and Zen metabolic analogs in various food matrices. Spiked liquid matrices such as beer and pig urine samples were also tested for direct injection to the developed EC system, suggesting that this method can also be applied to the surveillance of beer samples contaminated with Zs and to detect urinary metabolites of Z and analogs. In addition, with a single liquid extraction (methanol) procedure, or in combination with a SPE procedure, satisfactory chromatographic se- paration of commonly seen Z analogs can be achieved in 10 min. The sensitivity of this EC method was well be- low the regulatory levels set by international regulatory agencies and the LOD can be further lowered with sam- ple pre-concentration after SPE. Therefore, the devel- oped HPLC-EC method should be a desirable semi-con- firmative tool capable of differentiating individual Zs to complement the most commonly used ELISA screening which does not differentiate Zs among themselves. 5. Acknowledgements This study was supported by National Science Council, Taiwan (NSC94-2313-B-005-025 and NSC96-2313-B- 005-022). REFERENCES [1] B. S. Katzenellenbogen, J. A. Katzenellenbogen and D. Z. Mordecai, “Characterization of the Estrogenic Potencies and Receptor Interactions of a Series of Fungal Beta-Re- sorcylic Acid Lactones,” Endocrinology, Vol. 105, No. 1, 1979, pp. 33-40. doi:10.1210/endo-105-1-33 [2] W. M. Hagler, C. J. Mirocha, S. V. Pathre and J. C. Behrens, “Identification of the Naturally Occurring Iso- mer of Zearalenol Produced by Fusarium Roseum ‘Gib- bosum’ in Rice Culture,” Applied and Environmental Mi- crobiology, Vol. 37, No. 5, 1979, pp. 849-853. [3] P. Golinski, R. F. Vesonder, D. Latus-Zietkiewicz and J. Perkowski, “Formation of Fusarenone X, Nivalenol, Zea- ralenone, Alpha-Trans-Zearalenol, Beta-Trans-Zearalenol, and Fusarin C by Fusarium Crookwellense,” Applied and Environmental Microbiology, Vol. 54, No. 8, 1988, pp. 2147-2148. [4] D. G. Kennedy, S. A. Hewitt, J. D. McEvoy, J. W. Currie, A. Cannavan, W. J. Blanchflower and C. T. Elliot, “Zera- nol Is Formed from Fusarium spp. Toxins in Cattle in Vivo,” Food Additives and Contaminants, Vol. 15, No. 4, 1998, pp. 393-400. doi:10.1080/02652039809374658 [5] M. Kleinova, P. Zöllner, H. Kahlbacher, W. Hochsteiner and W. Lindner, “Metabolic Profiles of the Mycotoxin Zearalenone and of the Growth Promoter Zeranol in Urine, Liver, and Muscle of Heifers,” Journal of Agricul- tural and Food Chemistry, Vol. 50, No. 17, 2002, pp. 4769-4776. doi:10.1021/jf020160p [6] H. Leffers, M. Naesby, B. Vendelbo, E. N. Skakkebaek and M. Jorgensen, “Oestrogenic Potencies of Zeranol, Oestradiol, Diethylstilboestrol, Bisphenol-A and Gen- istein: Implications for Exposure Assessment of Potential Endocrine Disrupters,” Human Reproduction, Vol. 16, No. 5, 2001, pp. 1037-1045. doi:10.1093/humrep/16.5.1037 [7] H. Takemura, J. Y. Shim, K. Sayama, A. Tsubura, B. T. Zhu and K. Shimoi, “Characterization of the Estrogenic Activities of Zearalenone and Zeranol in Vivo and in Vi- tro,” The Journal of Steroid Biochemistry and Molecular Biology, Vol. 103, No. 2, 2007, pp. 170-177. doi:10.1016/j.jsbmb.2006.08.008 [8] M. S. Updike, J. C. Sawdy, L. S. Wang, S. Liu, Y. W. Huang, W. Ye, W. B. Farrar, Y. C. Lin and M. Wick, “Primary Cultured Human Breast Epithelial Cells Up- Regulate Protein Disulfide Isomerase in Response to Zeranol,” Anticancer Research, Vol. 27, No. 1A, 2007, pp. 407-410. [9] J. E. Williams, S. J. Ireland, T. A. Mollett, D. L. Hancock, E. E. Beaver and S. Hannah, “Influence of Zeranol and Breed on Growth, Composition of Gain, and Plasma Hor- mone Concentrations,” Journal of Animal Science, Vol. 69, No. 4, 1991, pp. 1688-1696. [10] T. Yuri, Y. Nikaido, N. Shimano, N. Uehara, N. Shikata and A. Tsubura, “Effects of Prepubertal Zeranol Exposure on Estrogen Target Organs and N-Methyl-N-Nitrosourea- Induced Mammary Tumorigenesis in Female Sprague- Dawley Rats,” In Vivo, Vol. 18, No. 6, 2004, pp. 755-761. [11] F. Minervini, A. Giannoccaro, A. Cavallini and A. Vis- conti, “Investigations on Cellular Proliferation Induced by Zearalenone and Its Derivatives in Relation to The Estro- genic Parameters,” Toxicology Letters, Vol. 159, No. 3, 2005, pp. 272-283. doi:10.1016/j.toxlet.2005.05.017 [12] M. Metzler, “Metabolism of Some Anabolic Agent: Toxi- cological and Analytical Aspects,” Journal of Chroma- tography, Vol. 489, No. 1, 1989, pp. 11-21. [13] Y. C. Lin, S. K. Kulp, Y. Sugimoto and R. W. Bruegge- meier, “Potential Risk of Growth Promoter in Beef for Breast Cancer Growth,” US Department of Defense Breast Cancer Research Program Meeting Proceedings II, 2000. [14] “Prohibiting the Use in Livestock Farming of Certain Substances Having a Hormonal Action,” 1988. http://eur-lex.europa.eu/LexUriServ/LexUriServ.do?uri= CELEX:31988L0146:en:NOT [15] C. J. Mirocha, S. V. Pathre, B. Schauerhamer and C. M. Christensen, “Natural Occurrence of Fusarium Toxins in Feedstuff,” Applied and Environmental Microbiology, Vol. 32, No. 4, 1976, pp. 553-556. [16] “Residues of Some Veterinary Drugs in Animals and Foods 32nd Report,” WHO Food Additives Series, Rome, 1987. [17] “U.S. Food and Durg Administration Code of Federal Regulations Title 21,” 2012. http://www.accessdata.fda.gov/scripts/cdrh/cfdocs/cfCFR /CFRSearch.cfm?fr=556.760 [18] “Worldwide Regulations for Mycotoxins in Food and Feed in 2003,” Food and Agriculture Organization of the United Nations, Rome, 2004. [19] S. N. Dixon and K. L. Russell, “Radioimmunoassay of the Anabolic Agent Zeranol. IV. The Determination of Copyright © 2013 SciRes. FNS  Electrochemical Detection of Zeranol and Zearalenone Metabolic Analogs in Meats and Grains by Screen-Plated Carbon-Plated Disposable Electrodes Copyright © 2013 SciRes. FNS 38 Zeranol Concentrations in The Edible Tissues of Cattle Implanted with Zeranol (Ragro),” Journal of Veterinary Pharmacology and Therapeutics, Vol. 9, No. 1, 1986, pp. 94-100. doi:10.1111/j.1365-2885.1986.tb00017.x [20] Y. Liu, C. Z. Zhang, X. Y. Yu, Z. Y. Zhang, X. Zhang, R. R. Liu, X. J. Liu and Z. M. Gong, “Development and Evaluation of Immunoassay for Zeranol in Bovine Urine,” Journal of Zhejiang University-Science B, Vol. 8, No. 12, 2007, pp. 900-905. doi:10.1631/jzus.2007.B0900 [21] W. Zhang, H. Wang, J. Wang, X. Li, H. Jiang and J. Shen, “Multiresidue Determination of Zeranol and Related Com- pounds in Bovine Muscle by Gas Chromatography/Mass Spectrometry with Immunoaffinity Cleanup,” Journal of AOAC International, Vol. 89, No. 6, 2006, pp. 1677- 1681. [22] J. E. Roybal, R. K. Munns, W. J. Morris, J. A. Hurlbut and W. Shimoda, “Determination of Zeranol/Zearalenone and Their Metabolites in Edible Animal Tissue by Liquid Chromatography with Electrochemical Detection and Con- firmation by Gas Chromatography/Mass Spectrometry,” Association of Official Analytical Chemists, Vol. 71, No. 2, 1988, pp. 263-271. [23] M. B. Medina and N. Nagdy, “Improved Thin-layer Chromatographic Detection of Diethylstilbestrol and Ze- ranol in Plasma and Tissues Isolated with Alumina and Ion-Exchange Membrane Columns in Tandem,” Journal of Chromatography, Vol. 614, No. 2, 1993, pp. 315-323. [24] M. B. Medina and J. T. Sherman, “High Performance Liquid Chromatographic Separation of Anabolic Oestro- gens and Ultraviolet Detection of 17 Beta-Oestradiol, Zeranol, Diethylstilboestrol or Zearalenone in Avian Mu- scle Tissue Extracts,” Food Additives and Contaminats, Vol. 3, No. 3, 1986, pp. 263-272. doi:10.1080/02652038609373590 [25] L. You, X. Li, C. Xi, B. Tang, G. Wang, L. Zhang, Z. Yuan and H. Zhao, “Simultaneous Determination of Resi- dues of Six Zeranols in Eggs by High Performance Liquid Chromatography with Immunoaffinity Cleanup Column,” Se Pu/Chinese Journal of Chromatography, Vol. 30, No, 10, 2012, pp. 1021-1025. [26] J. Jodlbauer, P. Zöllner and W. Lindner, “Determination of Zeranol, Taleranol, Zearalenone, α- and β-Zearalenol in Urine and Tissue by High-Performance Liquid Chro- matography-Tandem Mass Spectrometry,” Chromatogra- phia, Vol. 51, No. 11-12, 2000, pp. 681-687. doi:10.1007/BF02505405 [27] K. Schmidt, C. Stachel and P. Gowik, “Development and In-House Validation of an LC-MS/MS Method for the Determination of Stilbenes and Resorcylic Acid Lactones in Bovine Urine,” Anaytial and Bioanalytical Chemistry, Vol. 391, No. 4, 2008, pp. 1199-1210. doi:10.1007/s00216-008-1943-x [28] G. Dusi, E. Bozzoni, W. Assini, N. Tognoli, M. Gasparini and E. Ferretti, “Confirmatory Method for the Determina- tion of Resorcylic Acid Lactones in Urine Sample Using Immunoaffinity Cleanup and Liquid Chromatography- Tandem Mass Spectrometry,” Analytica Chimica Acta, Vol. 637, No. 1-2, 2009, pp. 47-54. doi:10.1016/j.aca.2008.11.047 [29] S. Taguchi, S. Yoshida, Y. Tanaka and S. Hori, “Simple and Rapid Analysis of Trenbolone and Zeranol Residues in Cattle Muscle and Liver by Stack-Cartridge Solid- Phase Extraction and HPLC Using On-Line Clean-Up with EC and UV Detection,” Shokuhin Eiseigaku Zasshi (Journal of the Food Hygienic Society of Japan), Vol. 42, No. 4, 2001, pp. 226-230. doi:10.3358/shokueishi.42.226 [30] F. de Andrés, M. Zougagh, G. Castañeda and A. Ríos, “Determination of Zearalenone and Its Metabolites in Urine Samples by Liquid Chromatography with Electro- chemical Detection Using a Carbon Nanotube-Modified Electrode,” Journal of Chromatography A, Vol. 1221, No. 1-2, 2008, pp. 54-60. doi:10.1016/j.chroma.2008.09.112 [31] H. Y. Hsieh, C. L. Shyu, C. W. Liao, R. J. Lee, M. R. Lee, T. W. Vickroy and C. C. Chou, “Liquid Chromatography Incorporating Ultraviolet and Electrochemical Analyses for Dual Detection of Zeranol and Zearalenone Metabo- lites in Moldy Grains,” Journal of the Science and Food Agriculture, Vol. 92, No. 6, 2012, pp. 1230-1237. doi:10.1002/jsfa.4687 [32] C. C. Yang, A. S. Kumar and J. M. Zen, “Precise Blood Lead Analysis Using a Combined Internal Standard and Standard Addition Approach with Disposable Screen- Printed Electrodes,” Analytical Biochemistry, Vol. 338, No. 2, 2005, pp. 278-283. doi:10.1016/j.ab.2004.12.015 [33] C. C. Chou, S. P. Lin, K. M. Lee, C. T. Hsu, T. W. Vick- roy and J. M. Zen, “Fast Differentiation of Meats from Fifteen Animal Species by Liquid Chromatography with Electrochemical Detection Using Copper Nanoparticle Plated Electrodes,” Journal of Chromatography B, Vol. 846, No. 1-2, 2007, pp. 230-239. doi:10.1016/j.jchromb.2006.09.006 [34] C. W. Yang, J. M. Zen, Y. L. Kao, C. T. Hsu, T. C. Chung, C. C. Chang and C. C. Chou, “Multiple Screening of Urolithic Organic Acids with Copper Nanoparticle- Plated Electrode: Potential Assessment of Urolithic Risks,” Analytical Biochemistry, Vol. 395, No. 2, 2009, pp. 224- 230. doi:10.1016/j.ab.2009.08.020 [35] T. Kuiper-Goodman, P. M. Scott and H. Watanabe, “Risk Assessment of the Mycotoxin Zearalenone,” Regulatory Toxicology and Pharmacology, Vol. 7, No. 3, 1987, pp. 253-306. doi:10.1016/0273-2300(87)90037-7 [36] C. Böswald, G. Engelhardt, H. Vogel and P. R. Wallnöfer, “Metabolism of the Fusarium Mycotoxins Zearalenone and Deoxynivalenol by Yeast Strains of Technological Relevance,” Natural Toxins, Vol. 3, No. 3, 1995, pp. 138- 144. doi:10.1002/nt.2620030304 [37] M. Palyusik, W. M. Hagler, L. Horváth and C. J. Mirocha, “Biotransformation of Zearalenone to Zearalenol by Can- dida tropicalis,” Acta veterinaria Academiae Scientiarum Hungaricae, Vol. 28, No. 2, 1980, pp. 159-166.
|