Paper Menu >>
Journal Menu >>
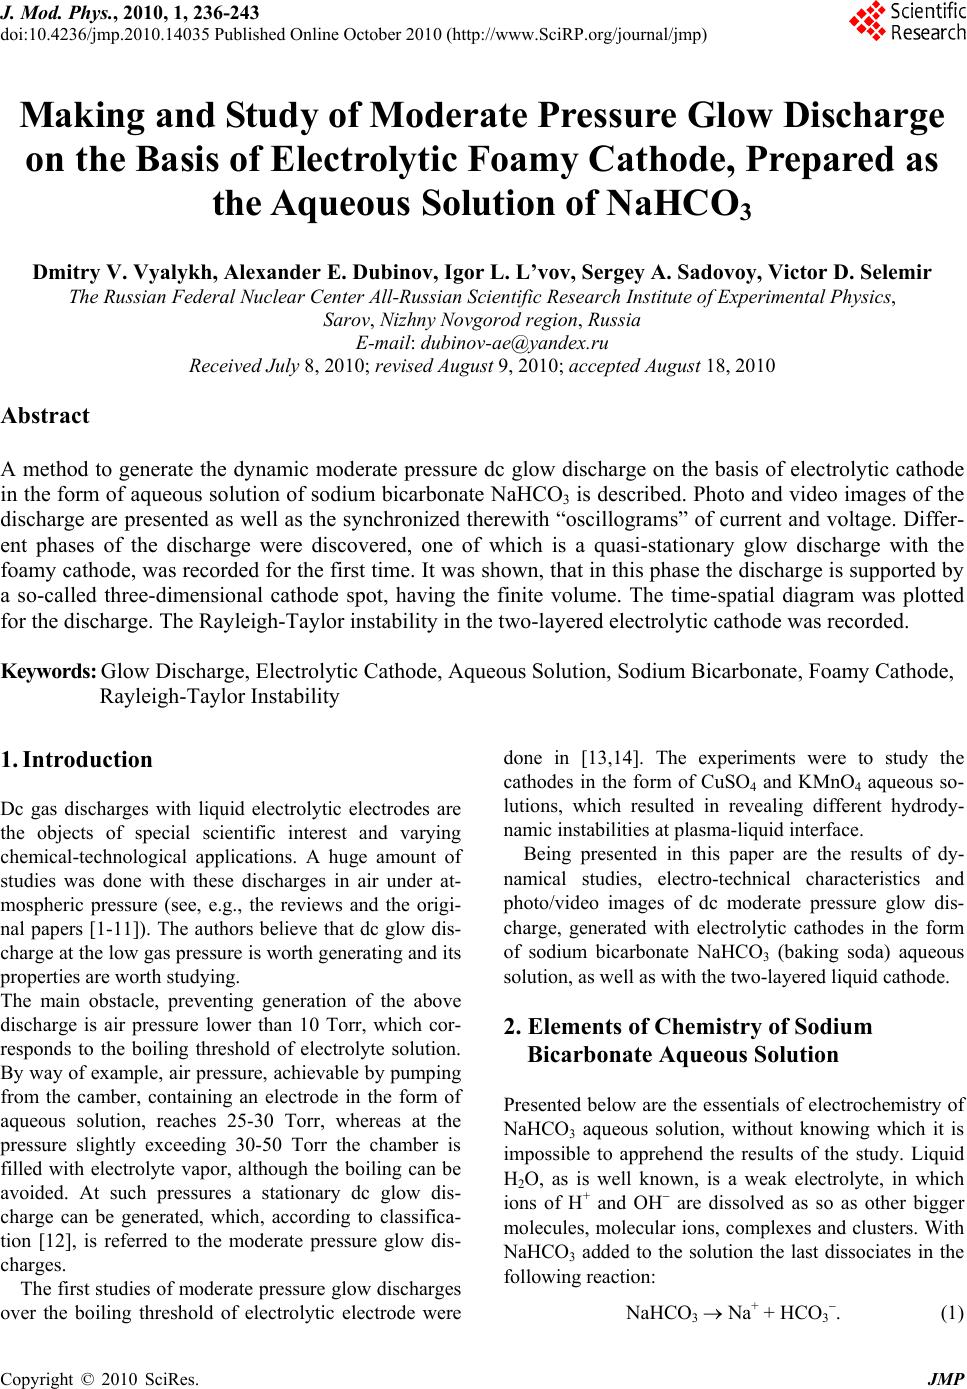 J. Mod. Phys., 2010, 1, 236-243 doi:10.4236/jmp.2010.14035 Published Online October 2010 (http://www.SciRP.org/journal/jmp) Copyright © 2010 SciRes. JMP Making and Study of Moderate Pressure Glow Discharge on the Basis of Electrolytic Foamy Cathode, Prep ared as the Aqueous Solution of NaHCO 3 Dmitry V. Vyalykh, Alexander E. Dubinov, Igor L. L’vov, Sergey A. Sadovoy, Victor D. Selemir The Russian Federal Nuclear Center All-Russian Scientific Research Institute of Experimental Physics, Sarov, Nizhny Novgorod region, Russia E-mail: dubinov-ae@yandex.ru Received July 8, 2010; revised August 9, 2010; acce pted August 18, 2010 Abstract A method to generate the dynamic moderate pressure dc glow discharge on the basis of electrolytic cathode in the form of aqueous solution of sodium bicarbonate NaHCO3 is described. Photo and video images of the discharge are presented as well as the synchronized therewith “oscillograms” of current and voltage. Differ- ent phases of the discharge were discovered, one of which is a quasi-stationary glow discharge with the foamy cathode, was recorded for the first time. It was shown, that in this phase the discharge is supported by a so-called three-dimensional cathode spot, having the finite volume. The time-spatial diagram was plotted for the discharge. The Rayleigh-Taylor instability in the two-layered electrolytic cathode was recorded. Keywords: Glow Discharge, Electrolytic Cathode, Aqueous Solution, Sodium Bicarbonate, Foamy Cathode, Rayleigh-Taylor Instability 1. Introduction Dc gas discharges with liquid electrolytic electrodes are the objects of special scientific interest and varying chemical-technological applications. A huge amount of studies was done with these discharges in air under at- mospheric pressure (see, e.g., the reviews and the origi- nal papers [1-11]). The authors believe that dc glow dis- charge at the low gas pressure is worth generating and its properties are worth studying. The main obstacle, preventing generation of the above discharge is air pressure lower than 10 Torr, which cor- responds to the boiling threshold of electrolyte solution. By way of example, air pressure, achievable by pumping from the camber, containing an electrode in the form of aqueous solution, reaches 25-30 Torr, whereas at the pressure slightly exceeding 30-50 Torr the chamber is filled with electrolyte vapor, although the boiling can be avoided. At such pressures a stationary dc glow dis- charge can be generated, which, according to classifica- tion [12], is referred to the moderate pressure glow dis- charges. The first studies of moderate pressure glow discharges over the boiling threshold of electrolytic electrode were done in [13,14]. The experiments were to study the cathodes in the form of CuSO4 and KMnO4 aqueous so- lutions, which resulted in revealing different hydrody- namic instabilities at plasma-liquid interface. Being presented in this paper are the results of dy- namical studies, electro-technical characteristics and photo/video images of dc moderate pressure glow dis- charge, generated with electrolytic cathodes in the form of sodium bicarbonate NaHCO3 (baking soda) aqueous solution, as well as with the two-layered liquid cathode. 2. Elements of Chemistry of Sodium Bicarbonate Aqueous Solution Presented below are the essentials of electrochemistry of NaHCO3 aqueous solution, without knowing which it is impossible to apprehend the results of the study. Liquid H2O, as is well known, is a weak electrolyte, in which ions of H+ and OH are dissolved as so as other bigger molecules, molecular ions, complexes and clusters. With NaHCO3 added to the solution the last dissociates in the following reaction: NaHCO3 Na+ + HCO3 . (1) 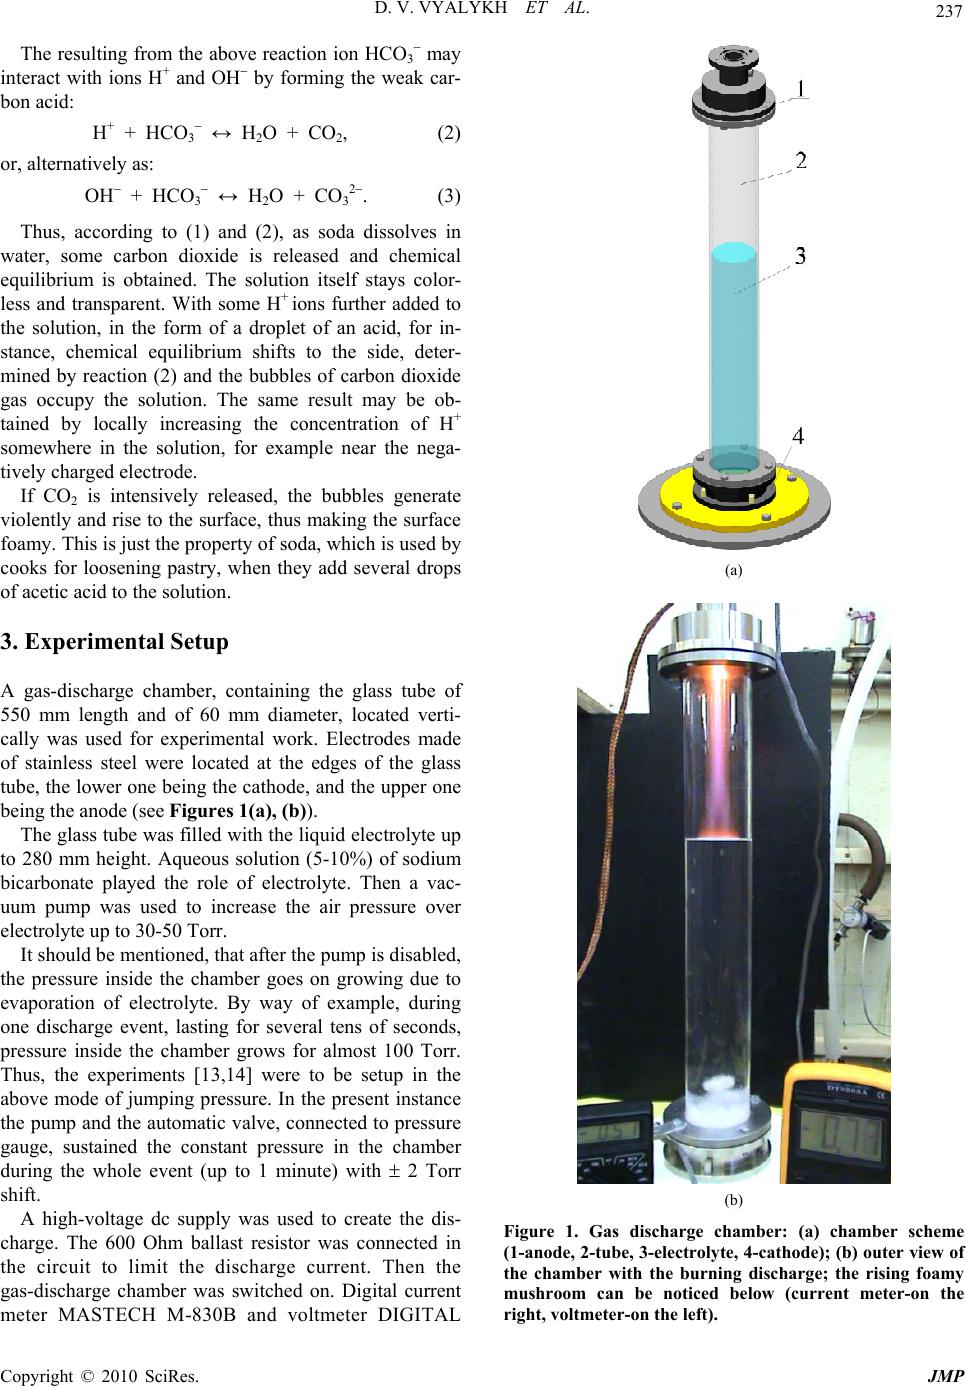 D. V. VYALYKH ET AL. Copyright © 2010 SciRes. JMP 237 The resulting from the above reaction ion HCO3 may interact with ions H+ and OH by forming the weak car- bon acid: H+ + HCO3 ↔ H 2O + CO2, (2) or, alternatively as: OH + HCO3 ↔ H 2O + CO3 2. (3) Thus, according to (1) and (2), as soda dissolves in water, some carbon dioxide is released and chemical equilibrium is obtained. The solution itself stays color- less and transparent. With some H+ ions further added to the solution, in the form of a droplet of an acid, for in- stance, chemical equilibrium shifts to the side, deter- mined by reaction (2) and the bubbles of carbon dioxide gas occupy the solution. The same result may be ob- tained by locally increasing the concentration of H+ somewhere in the solution, for example near the nega- tively charged electrode. If CO2 is intensively released, the bubbles generate violently and rise to the surface, thus making the surface foamy. This is just the property of soda, which is used by cooks for loosening pastry, when they add several drops of acetic acid to the solution. 3. Experimental Setup A gas-discharge chamber, containing the glass tube of 550 mm length and of 60 mm diameter, located verti- cally was used for experimental work. Electrodes made of stainless steel were located at the edges of the glass tube, the lower one being the cathode, and the upper one being the anode (see Figures 1(a), (b)). The glass tube was filled with the liquid electrolyte up to 280 mm height. Aqueous solution (5-10%) of sodium bicarbonate played the role of electrolyte. Then a vac- uum pump was used to increase the air pressure over electrolyte up to 30-50 Torr. It should be mentioned, that after the pump is disabled, the pressure inside the chamber goes on growing due to evaporation of electrolyte. By way of example, during one discharge event, lasting for several tens of seconds, pressure inside the chamber grows for almost 100 Torr. Thus, the experiments [13,14] were to be setup in the above mode of jumping pressure. In the present instance the pump and the automatic valve, connected to pressure gauge, sustained the constant pressure in the chamber during the whole event (up to 1 minute) with 2 Torr shift. A high-voltage dc supply was used to create the dis- charge. The 600 Ohm ballast resistor was connected in the circuit to limit the discharge current. Then the gas-discharge chamber was switched on. Digital current meter MASTECH M-830B and voltmeter DIGITAL (a) (b) Figure 1. Gas discharge chamber: (a) chamber scheme (1-anode, 2-tube, 3-electrolyte, 4-cathode); (b) outer view of the chamber with the burning discharge; the rising foamy mushroom can be noticed below (current meter-on the right, voltmeter-on the left). 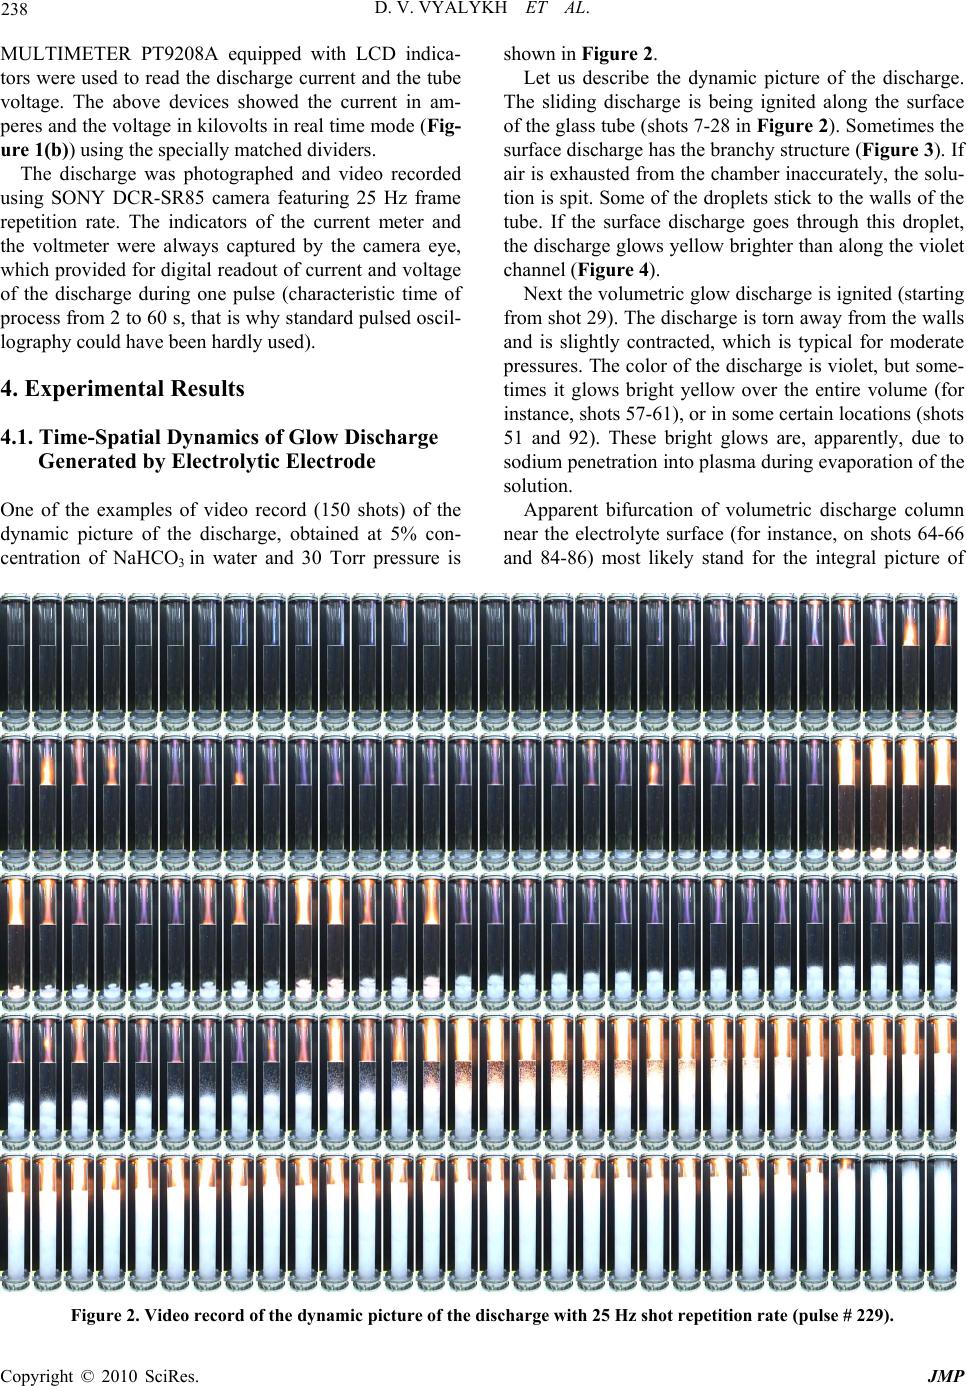 D. V. VYALYKH ET AL. Copyright © 2010 SciRes. JMP 238 MULTIMETER PT9208A equipped with LCD indica- tors were used to read the discharge current and the tube voltage. The above devices showed the current in am- peres and the voltage in kilovolts in real time mode (Fig- ure 1(b)) using the specially matched dividers. The discharge was photographed and video recorded using SONY DCR-SR85 camera featuring 25 Hz frame repetition rate. The indicators of the current meter and the voltmeter were always captured by the camera eye, which provided for digital readout of current and voltage of the discharge during one pulse (characteristic time of process from 2 to 60 s, that is why standard pulsed oscil- lography could have been hardly used). 4. Experimental Results 4.1. Time-Spatial Dynamics of Glow Discharge Generated by Electrolytic Electrode One of the examples of video record (150 shots) of the dynamic picture of the discharge, obtained at 5% con- centration of NaHCO3 in water and 30 Torr pressure is shown in Figure 2. Let us describe the dynamic picture of the discharge. The sliding discharge is being ignited along the surface of the glass tube (shots 7-28 in Figure 2). Sometimes the surface discharge has the branchy structure (Figure 3 ). If air is exhausted from the chamber inaccurately, the solu- tion is spit. Some of the droplets stick to the walls of the tube. If the surface discharge goes through this droplet, the discharge glows yellow brighter than along the violet channel (Figure 4). Next the volumetric glow discharge is ignited (starting from shot 29). The discharge is torn away from the walls and is slightly contracted, which is typical for moderate pressures. The color of the discharge is violet, but some- times it glows bright yellow over the entire volume (for instance, shots 57-61), or in some certain locations (shots 51 and 92). These bright glows are, apparently, due to sodium penetration into plasma during evaporation of the solution. Apparent bifurcation of volumetric discharge column near the electrolyte surface (for instance, on shots 64-66 and 84-86) most likely stand for the integral picture of Figure 2. Video record of the dynamic picture of the discharge with 25 Hz shot repetition rate (pulse # 229).  D. V. VYALYKH ET AL. Copyright © 2010 SciRes. JMP 239 Figure 3. Video record of the branched surface discharge (pulse # 182). Figure 4. Video record of the surface discharge going th r ou g h the droplets of electrolyte solution (pulse # 182). circular motion of the cathode spot of unbranched col- umn over liquid surface, similar to the picture, observed in [7]. Such the motion can be resolved in time only us- ing high-speed camera (for instance, in [7] the camera featuring 1 kHz frame frequency rate was used). The behavior of electrolyte attracts attention as well. It is easy to understand, that under the effect of the applied voltage some equilibrium quantity of H+ ions drifts to the cathode, whereas OH ions move to the plasma-liquid interface. Such an electric separation of ions urges the chemical equilibrium of the solution to shift, thus result- ing in reaction (3) to take place near the plasma-liquid interface and reaction (2) to take place near the cathode, accompanied with intensive carbon dioxide release. This becomes evident starting, approximately, with shot 37. It can be seen, that during the entire discharge event the bubbles of carbon dioxide are intensively generated near the cathode and go up under the effect of Archimedian force. Behind the front of the uplifting bubbles a specific medium is formed. It is foam, represented by the hetero- geneous mixture of electrolytic aqueous solution of Na- HCO3 and CO2 bubbles. Under the effect of hydrodynamic instability the rising front of the bubbles is subject to the growing perturba- tions (shot 50), one of which takes the form of a mush- room (shots 51-90). In the course of time the bubbles become so numerous, that they augment the summarized volume of electrolytic cathode: it can be seen, that start- ing from shot 100 the level of the plasma-liquid interface rises. Having inspected the shots of rows 2 and 3 in fig- ure 2 as a whole, one can see, that the front of bubbles, and, consequently, the level of plasma-liquid interface, rises almost uniformly at first, accelerating further on significantly. The instantaneous CO2 release during chemical reactions in electrolyte can be judged by the level, the interface rises to (basically over channel (2)). Gradually the level of the foam (in practice, the upper surface of the mushroom) overtakes the plasma-liquid interface (shot 115). From this moment on we have the brand new form of glow discharge: stationary dc moder- ate pressure discharge with foamy electrolytic cathode, in which CO2 bubbles are densely packed. The glow dis- charge with foamy electrolytic cathode of this type had never been observed earlier. It has to be mentioned occasionally, that another type of discharge with foamy cathode—the arc discharge at atmospheric pressure—was described recently in paper [15]. There they used pouring beer with a foamy cap as a cathode (remember, that the beer foam in its essence is the carbonic acid). In this particular paper it is reported that carbon multi-walled nanotubes, nanocapsules and lamellar nanoparticles, reminding of cabbage head are formed in the arc, which can be of interest for studies related to nanoelectronics. Above all, intensive CO2 bubbles release was observed as well in the barrier dis- charge, generated in soda solution [16,17]. Why the discharges involving foamy electrodes are interesting? Specialists used to think, that dc discharges are supported by the area of cathode surface, named cathode spot. From this point of view the cathode spot is a two-dimensional object. Dramatically different situa- tion is with the discharge involving foamy cathode: the cathode spot here is a three-dimensional object, having the finite volume (Figure 5). It is important, that just this type of the cathode spot—the three-dimensional one—is often observed in natural discharges: lightening coming from rainy clouds, dust clouds, releases from volcanoes, releases of soil associated with explosive works, etc. However, the volumetric cathode spots had never been studied; Moreover, they had never been referred to any- where. It may also be added, that the discharges in such a 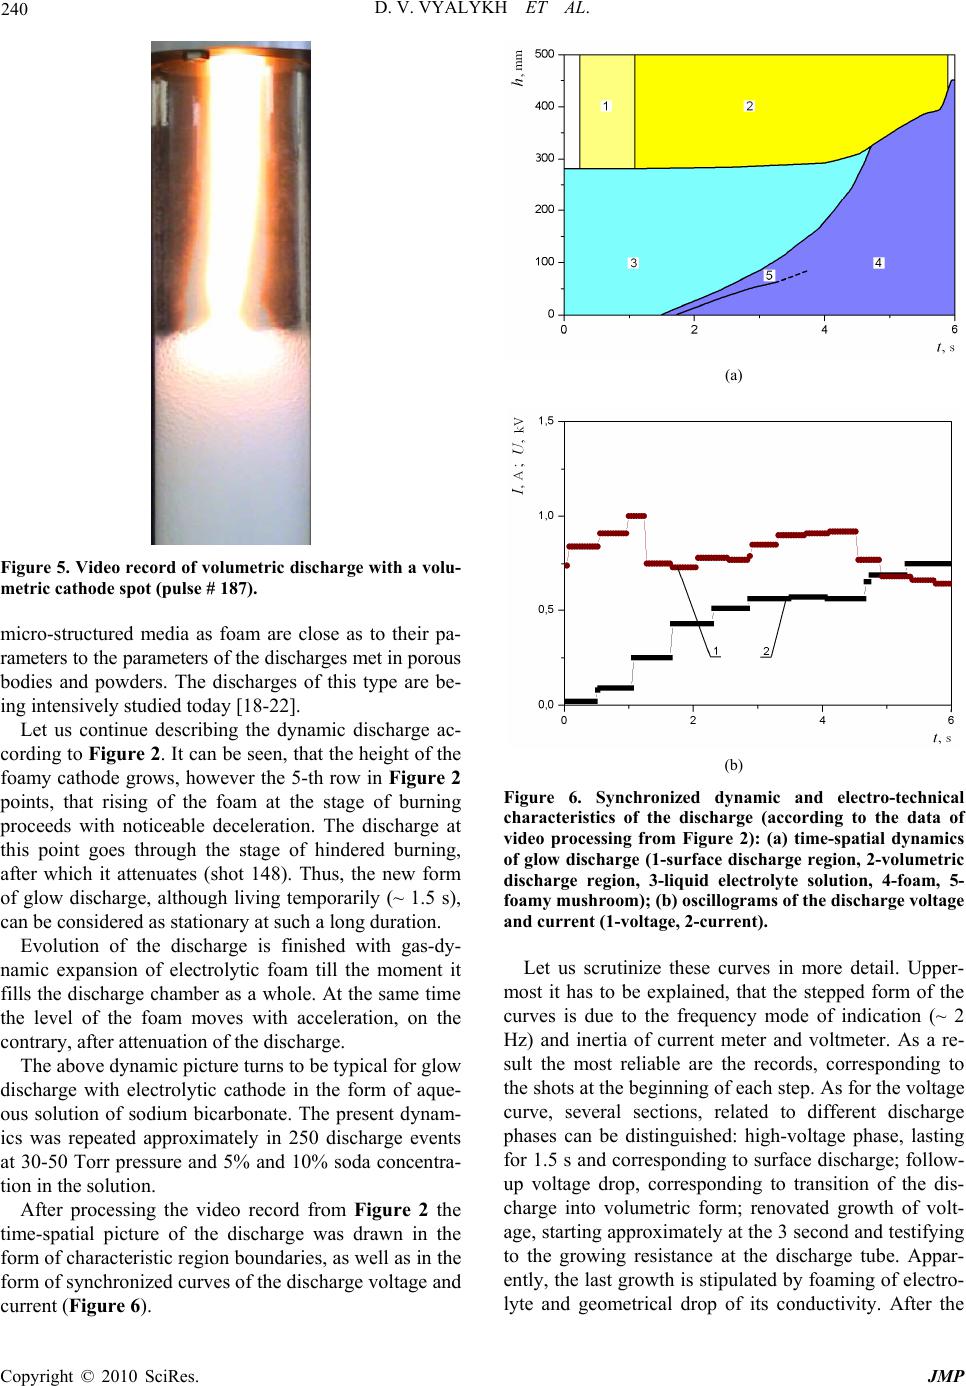 D. V. VYALYKH ET AL. Copyright © 2010 SciRes. JMP 240 Figure 5. Video record of volumetric discharge with a volu- metric cathode spot (pulse # 187). micro-structured media as foam are close as to their pa- rameters to the parameters of the discharges met in porous bodies and powders. The discharges of this type are be- ing intensively studied today [18-22]. Let us continue describing the dynamic discharge ac- cording to Figure 2. It can be seen, that the height of the foamy cathode grows, however the 5-th row in Figure 2 points, that rising of the foam at the stage of burning proceeds with noticeable deceleration. The discharge at this point goes through the stage of hindered burning, after which it attenuates (shot 148). Thus, the new form of glow discharge, although living temporarily (~ 1.5 s), can be considered as stationary at such a long duration. Evolution of the discharge is finished with gas-dy- namic expansion of electrolytic foam till the moment it fills the discharge chamber as a whole. At the same time the level of the foam moves with acceleration, on the contrary, after attenuation of the discharge. The above dynamic picture turns to be typical for glow discharge with electrolytic cathode in the form of aque- ous solution of sodium bicarbonate. The present dynam- ics was repeated approximately in 250 discharge events at 30-50 Torr pressure and 5% and 10% soda concentra- tion in the solution. After processing the video record from Figure 2 the time-spatial picture of the discharge was drawn in the form of characteristic region boundaries, as well as in the form of synchronized curves of the discharge voltage and current (Figure 6). (a) (b) Figure 6. Synchronized dynamic and electro-technical characteristics of the discharge (according to the data of video processing from Figure 2): (a) time-spatial dynamics of glow discharge (1-surface discharge region, 2-volumetric discharge region, 3-liquid electrolyte solution, 4-foam, 5- foamy mushroom); (b) oscillograms of the discharge voltage and current (1-voltage, 2-current). Let us scrutinize these curves in more detail. Upper- most it has to be explained, that the stepped form of the curves is due to the frequency mode of indication (~ 2 Hz) and inertia of current meter and voltmeter. As a re- sult the most reliable are the records, corresponding to the shots at the beginning of each step. As for the voltage curve, several sections, related to different discharge phases can be distinguished: high-voltage phase, lasting for 1.5 s and corresponding to surface discharge; follow- up voltage drop, corresponding to transition of the dis- charge into volumetric form; renovated growth of volt- age, starting approximately at the 3 second and testifying to the growing resistance at the discharge tube. Appar- ently, the last growth is stipulated by foaming of electro- lyte and geometrical drop of its conductivity. After the  D. V. VYALYKH ET AL. Copyright © 2010 SciRes. JMP 241 foam reaches the surface of the liquid the discharge voltage drops again. As a whole, the current curve shows the noticeable growth of the discharge current at the phases of voltage drop. Another peculiarity of the above discharge was re- vealed by video recording featuring lower exposure time in each shot (in practice it means the lower light flux, going through the camera lens). Bright spots of two types were discovered in the discharge plasma: the immovable ones and the ones, flying towards the anode. The im- movable bright spots could be located both inside and outside the discharge region at the video record (Figure 7). They were identified as plasma in the vicinity of evaporating droplets of electrolyte inside the inner sur- face of the discharge tube. The movable spots were iden- tified also as the evaporating liquid droplets, flying to- wards the anode. Using two adjacent shots (Figure 8) one can estimate their speed, which was recorded in the range of 0.1-2 m/s depending on the discharge event, which points to cumulative character of their nucleation. 4.2. Peculiarities of the Dynamics of Two-Layered Liquid Cathode The afore described method, developed and tested to generate the average pressure glow discharge using the cathode in the form of electrolyte solution was further used to study hydrodynamic processes in a two-layered cathode. Presented below are the results of the experiment, where the cathode was prepared as a 5% solution of so- dium bicarbonate, on the surface of which a layer of di- electric oil BM-6 of 10 mm thickness was poured. As is well known, the oil itself is a good insulator, and the layer serves as a peculiar liquid barrier. The goal of the experiment was to demonstrate, how the electric discharge mode can be used to manipulate hydrodynamics of the oil layer, in particular, to cripple its surface. Crippling could have been caused both by uplifting CO2 bubbles and by breakdown in the discharge channel. The process can be useful as applied in optional environmental technologies (remember the ecologic damage incident in Mexican gulf). However, in case of sodium bicarbonate solution, the unexpected effect was revealed: oil jets were released and dispersed inside the solution for about 100 mm depth. In Figure 9 the fragments of video record of the above effect are shown, taken in the mode, when the discharge was activated for some short time (a few seconds) only to initiate the intensive generation of CO2 bubbles. In this mode the bubble front went to the surface, forming the extensive foam at the absence of the discharge. Obviously, the foamy layer possesses the significantly lower mass density, than the continuous electrolyte and can be considerably lighter than oil. As a result, the heavier liquid goes up and the conditions for the Rayleigh-Taylor instability development are formed, Figure 7. Two adjacent shots from pulse # 247; arrows show immovable spot. Figure 8. Two adjacent shots from pulse # 249; arrows show movable spot.  D. V. VYALYKH ET AL. Copyright © 2010 SciRes. JMP 242 Figure 9. Detached shots from video record of pulse # 289 with oil layer at 40 Torr: A–initial picture; B–discharge stage; C–lifting of bubbles; D–phase of the Rayleigh-Taylor instability (25 Hz); E–oil jet is spitted into droplets. which urges the oil jet to go down and be split into drop- lets. After the long (over 10 min) relaxation gas release process is stopped, the oil goes up and uniformity of the layer is recovered. It is interesting, that the similar process can be ob- served in the nature, for instance when the intensive gas release may occur near the ocean bed due to volcanic activity or another reasons. A vessel or a swimmer, find- ing itself in such a foam, may lose buoyancy and sink. The analogous reason for mysterious disappearance of ships is described in [23-25]. The popular on-line encyclopedia “Wikipedia” pre- sents this process as follows*: “It has been hypothesized that periodic methane eruptions (sometimes called “mud volcanoes”) may produce regions of frothy water that are no longer capable of providing adequate buoyancy for ships. If this were the case, such an area forming around a ship could cause it to sink very rapidly and without warning.” Now, what we may add to these words is that if another buoyant liquid enters the foamy region, it does not sink, moreover, it is split into jets and droplets as a result of the Rayleigh-Taylor instability. 5. Conclusions The paper presents the results of experimental studies of the dc glow discharge of moderate pressure based on electrolytic cathode, prepared in the form of aqueous solution of sodium bicarbonate NaHCO3. The example of video record of the discharge is also presented. Dif- ferent phases of the discharge were discovered, one of which is the discharge generated by the foamy cathode, was recorded for the first time. Time-spatial diagram of the discharge was developed and its electro-technical characteristics were measured. Small glowing spots in the discharge plasma were discovered, which may be explained by ionization around the evaporating droplets of electrolyte. Study of the two-layered electrolytic cathodes was performed and development of the Rayleigh-Taylor in- stability in the volume of electrolytic cathode was re- corded, when the lighter liquid—foamed electrolyte —finds itself under the heavier layer made up of oil. 6. References [1] C. T. Phelps, R. F. Griffiths and B. Vonnegut, “Corona Produced by Splashing of Water Drops on a Water Sur- face in a Strong Electric Field,” Journal of Applied Phys- ics, Vol. 44, No. 7, 1973, pp. 3082-3086. [2] V. A. Titov, V. V. Rybkin, A. I. Maximov and H.-S. Choi, “Characteristics of Atmospheric Pressure Air Glow Dis- charge with Aqueous Electrolyte Cathode,” Plasma Chemis- try & Plasma Processing, Vol. 25, No. 5, 2005, pp. 503 -518. [3] A. F. Gaisin, “A Multichannel Discharge between a Stream Electrolytic Cathode and a Metal Anode at At- mospheric Pressure,” High Temperature, Vol. 44, No. 3, 2006, pp. 336-341. [4] P. Mezei and T. Cserfalvi, “The Investigation of an Ab- normal Electrolyte Cathode Atmospheric Glow Discharge (ELCAD),” Journal of Physics D: Applied Physics, Vol. 39, No. 12, 2006, p. 2534-2539. [5] P. Gupta, G. Tenhundfeld, E. O. Daigle and D. Ryabkov, “Electrolytic Plasma Technology: Science and Engineer- ing—An Overview,” Surface & Coatings Technology, Vol. 201, No. 21, 2007, pp. 8746-8760. [6] I. M. Piskarev, G. M. Spirov, V. D. Selemir, V. I. Karelin and Shlepkin, “Temperature Dependence of the Rate of Formation of Active Species in Nanosecond Streamer Corona Discharge between a Solid Electrode and Water Surface,” High Energy Chemistry, 2007, Vol. 41, No. 4, pp. 288-290. [7] A. Wilson, D. Staack, T. Farouk, A. Gutsol, A. Fridman and B. Farouk, “Self-Rotating Dc Atmospheric-Pressure Discharge over a Water-Surface Electrode: Regimes of Operation,” Plasma Sources Sciences and Technology, Vol. 17, No. 4, 2008, p. 45001-1-12. [8] Q. Chen, K. Saito, Y.-i. Takemura and H. Shirai, “Phys- icochemistry of the Plasma-Electrolyte Solution Interface,” Thin Solid Films, Vol. 516, No. 14, 2008, pp. 6688-6693. [9] D. Okano, “DC Self-Discharge Path between Metal Rod- to-Water Electrodes in Atmospheric Air,” IEEE Transac- tions on Plasma Science, Vol. 36, No. 4, 2008, pp. 1152 -1153. [10] P. Bruggeman and C. Leys, “Non-Thermal Plasmas in *http://en.wikipedia.org/wiki/Bermuda_Triangle  D. V. VYALYKH ET AL. Copyright © 2010 SciRes. JMP 243 and in Contact with Liquids,” Journal of Physics D: Ap- plied Physics, Vol. 42, No. 5, 2009, p.53001-1-28. [11] T. Kaneko, K. Baba and R. Hatakeyama, “Gas–Liquid Interfacial Plasmas: Basic Properties and Applications to Nanomaterial Synthesis,” Plasma Physics and Controlled Fusion, Vol. 51, No. 12, 2009, p. 124011-1-8. [12] V. S. Golubev and S. V. Pashkin, “The Glow Discharge under Elevated Gas Pressure” Nauka, Moscow, 1990. [in Russian] [13] D. V. Vyalykh, A. E. Dubinov, K. E. Mikheev, I. L. L’vov, S. A. Sadovoy and V. D. Selemir, “Stability of Boundary ‘Liquid Electrlyte—Glow Discharge Plasma’,” Chemical Physics, Vol. 24, No. 8, 2005, pp. 103-105. [in Russian] [14] D. V. Vyalykh, A. E. Dubinov, K. E. Mikheev, Yu N. Lashmanov, I. L. L’vov, S. A. Sadovoĭ and V. D. Selemir, “Experimental Study of the Stability of the Interface be- tween a Liquid Electrolyte and the Glow Discharge Plas- ma,” Technical Physics, Vol. 50, No. 10, 2005, pp. 1374 -1375. [15] Y.-I. Kim, E. Nishikawa and T. Kioka, “Carbon Nano Materials Produced by Using Arc Discharge in Foam,” Journal of Korean Physical Society, Vol. 54, No. 3, 2009, p. 1032. [16] O. Sakai, M. Kimura, T. Shirafuji and K. Tachibana, “Underwater Microdischarge in Arranged Microbubbles Produced by Electrolysis in Electrolyte Solution Using Fabric-Type electrode,” Applied Physics Letter, Vol. 93, No. 23, 2008, p. 231501-1-3. [17] O. Sakai, T. Morita, N. Sano, T. Shirafuji, T. Nozaki and K. Tachibana, “Reduction of CO2 Solute by Hydrogen Microplasmas in an Electrolyte,” Journal of Physics D: Applied Physics, Vol. 42, No. 20, 2009, p. 202004-1-4. [18] A. B. Murphy and R. Morrow, “Glass Sphere Discharges for Ozone Production,” IEEE Transactions on Plasma Science, Vol. 30, No. 1, 2002, pp. 180-181. [19] K. Hensel, Sh. Katsura and A. Mizuno, “DC Microdis- charges inside Porous Ceramics,” IEEE Transactions on Plasma Science, Vol. 33, No. 2, 2005, pp. 574-575. [20] G. M. Batanov, N. K. Berezhetskaya, V. A. Kop’ev, I. A. Kossyi and A. N. Magunov, “Parameters of Microwave Discharge Plasmas in Powder Mixtures,” Plasma Physics Reports, Vol. 34, No. 4, 2008, pp. 325-330. [21] P. Lukes, M. Clupek, V. Babicky and P. Sunka, “Pulsed Electrical Discharge in Water Generated Using Porous- Ceramic-Coated Electrodes,” IEEE Transactions on P l as m a Science, Vol. 36, No. 4, 2008, pp. 1146-1147. [22] K. Hensel, “Microdischarges in Ceramic Foams and Honeycombs,” European Physical Journal D, Vol. 54, No. 2, 2009, pp. 141-148. [23] B. Denardo, L. Pringle, C. DeGrace and M. McGuire, “When do Bubbles Cause a Floating Body to Sink?” American Journal of Physics, Vol. 69, No. 10, 2001, pp. 1064-1072. [24] D. A. May and J. J. Monaghan, “Can a Single Bubble Sink a Ship?” American Journal of Physics, Vol. 71, No. 9, 2003, pp. 842-849. [25] M. A. Hueschen, “Can Bubbles Sink Ships?” American Journal of Physics, Vol. 78, No. 2, 2010, pp. 139-141. |