Paper Menu >>
Journal Menu >>
 J. Mod. Phys., 2010, 1, 206-210 doi:10.4236/jmp.2010.14031 Published Online October 2010 (http://www.SciRP.org/journal/jmp) Copyright © 2010 SciRes. JMP Fourier Transform Infrared Spectroscopic Characterization of Kaolinite from Assam and Meghalaya, Northeastern India Bhaskar J. Saikia1, Gopalakrishnarao Parthasarathy2 1Department of Physics, Dibrugarh University, Dibrugarh, I ndia & G B Pant Institute of Himalayan Environment & Development, Almora, India 2National Geophysical Research Institute, (Council of Scientific and Industrial Research) Hyderabad, India E-mail: vaskar_r@rediffmail.com Received June 10, 2010; revised July 27, 2010; accepted August 9, 2010 Abstract This study demonstrates the Fourier transform infrared (FTIR) spectroscopic characterization of natural kao- linite from north-eastern India. The compositional and structural studies were carried out at room tempera- ture by using X-ray fluorescence (XRF), electron microprobe (EPMA) analyses and Fourier transform infra- red (FTIR) spectroscopic techniques. The main peaks in the infrared spectra reflected Al-OH, Al-O and Si-O functional groups in the high frequency stretching and low frequency bending modes. Few peaks of infrared spectra inferred to the interference peaks for quartz as associated minerals. The present study demonstrates usefulness of the spectroscopic techniques in determining quality and crystalline nature of kaolinite from the Assam and Meghalaya, northeastern India. Keywords: Kaolinite, Spectroscopic Characterization, FTIR 1. Introduction Kaolinite is an economically important clay mineral that is common in the weathering, diagentic, hydrothermal, and very low grade metamorphic environments. Kaolin- ite is one of the most abundant aluminosilicate minerals, occurring primarily as a clay sized particles with high surface-area to volume ratios. Hence kaolinite weather- ing may play an important role in controlling the chemi- cal characteristics such as degree of crystallinity, con- centration of impurities, particles size distribution. De- spite its economic and geological importance, the spec- troscopic characterization is not well documented. Clay is widely utilized for different industrial applications, and as such any of its occurrences is worth proper chemical, mineralogical and technological investigations. Its current market price (about US $0.04–0.12/kg) is considered to be 20 times cheaper than that of activated carbon [1]. In recent years, there has been an increasing interest in utilizing kaolin for its capacity to adsorb not only inorganic but also organic molecules. It showed that kaolinite and some other naturally occurring clay mineral (such as bentonite, smecttite ,diatomite and fullers earth) could use as a substitute for activated carbon as an ad- sorbent due to its availability and low cost, and its good sorption properties [2]. Clays are layered aluminosilicate minerals forming important components of soils and sedimentary rocks. Their layers consist of TO4 tetrahedra (T = Si4+, Al3+, etc.) and MO6 octahedra (M = Al3+, Fe3+, etc.). Layers in 1:1 family of clay minerals hold together by hydrogen bonds formed between hydroxyl groups attached to coordinately unsaturated oxygen sites of the MO6 side of each layer and oxygen atoms terminating the opposite SiO4 side of the next layer [3]. A natural clay consists of one or different type of clay minerals together with some impurities. The most common impu- rities in natural clay are quartz, calcite, feldspar, mica and organic matter while hydrated iron oxide, ferrous carbonate and pyrite are being the minor impurities. The factors that affect most of the physical properties of clay are particle size, shape, cation exchange capacity and the type of impurities present. Clay particle sizes are in the micrometer to nanometer range length scale. The basic structural units in clays consist of the silica sheet formed  B. J. SAIKIA ET AL. Copyright © 2010 SciRes. JMP 207 of silica tetrahedra and the octahedral units formed of octahedrally coordinated cations with oxygens or hy- droxyls octahedra [3]. A number of works has been carried out on the quan- titative clay mineral analysis using infrared spectroscopy. Vibrational spectroscopic investigations yield useful in- formation about hydration characteristics, interlayer cations and moisture content in clays. The structural dif- ferences of kaolin can be detected by spectroscopic method. The FTIR spectroscopy applied to clay miner- alogy lies in its ability to characterize the functional group and fingerprint region of very small quantities of samples [4]. The studied samples are collected from six clay occurrence locations of Assam and Meghalaya, viz. Sheelveta, Silanijan and Deopani area of Assam and Khasi Hills, Jaintia Hills and East Garo Hills of Megha- laya. This study demonstrates the complementary role of both FTIR and XRF spectroscopy in characterizing the kaolin of Assam and Meghalaya. 2. Experimental The composition of the clays was determined by using Philips X-ray fluorescence (XRF) machine. The samples were powdered in dry conditions using agate mortar and pestle. The chemical composition of the calumetite was also determined by electron probe micro-analyzer (EPMA). Energy Dispersive X-ray (EDAX) measure- ments were carried out by using scanning electron mi- croscope (JEOL JSM-840 A) in EDAX mode with a filament current of 100 μA and an accelerating voltage of 20 kV. Five independent measurements were carried out and the average composition of the calumetite sample is presented here. The chemical constituents and LOI at 800˚C were determined by the Indian standard method [5] and differential thermal analyses. Differential thermal analysis (DTA) and thermo gravimetric studies were performed on powder samples using a Mettler Toledo star System apparatus. The temperature was measured with platinum sensors. Temperature precision and accu- racy are ± 0.1˚C. Thermo gravimetric method is used to quantify the percentage of hydroxyl/water content in the sample. The calibration and reproducibility of this appa- ratus is discussed elsewhere [6]. In X-ray fluorescence method, typical uncertainty involved in oxide analyses was about 0.01 wt %. The clay samples were crushed into fine powder for analysis. The powdered sample was homogenized in spectroscopic grade KBr (1:20) in an agate mortar and pressed into 3 mm pellets with a hand press. We tried to minimize the grinding time to avoid the deformation of the crystal structure, the ion exchange and the water absorption from atmosphere as suggested by [4]. The infrared spectra was acquired using Perkin- Elmer system 2000 FTIR spectrophotometer, with He-Ne as the reference, at a resolution of 4 cm–1. The spectra were taken in the region 400-4000 cm–1. The room tem- perature was 28˚C during the experiment. 3. Results and Discussion The compositional analysis of the clay samples are per- formed by XRF analysis (Table 1). It is obvious from Table 1, that improvement on the chemical composition of kaolin as result of beneficiation was marginal. The XRF result shows the major constituents of the samples are silica, alumina, which confirms the chemical analysis of clay. The infrared and compositional analyses indicate that the clay samples belong to kaolin. The loss on ignition (LOI) was determined at 800˚C. The kaolin sample dehroxylate at about 600˚C, with an intense endothermic peak on the DTA trace. The resul- tant anhydrous phase transforms into mullite and gamma alumina at about 980˚C, with an exothermic peak in the DTA trace. The relatively large difference in the LOI values between the sample-1 (10.32 wt %) and sample-3 (4.10 wt %) indicates that greater loss on ignition took place during the calcination step. This is largely due to the giving off of structural hydroxyl water and volatile organic components. Figure 1 is the IR spectrum of six kaolin samples. The Table 1. Compositions of the studied kaolin samples (in Weight (%)). Sample SiO2 Al2O3 Fe2O3 TiO2 CaO MgO K2O Na2O LOI Sample 1 44.71 36.34 2.03 1.01 0.37 -- 0.07 0.01 10.32 Sample 2 46.81 32.59 4.18 -- 3.04 0.71 -- -- 9.47 Sample 3 43.79 37.37 1.94 0.38 0.77 0.89 1.11 0.02 4.10 Sample 4 44.66 34.04 0.95 1.23 1.56 -- -- -- 6.51 Sample 5 42.96 33.71 1.17 1.45 1.25 0.36 -- -- 4.54 Sample 6 45.58 36.33 1.97 0.18 0.49 -- 0.02 -- 7.11 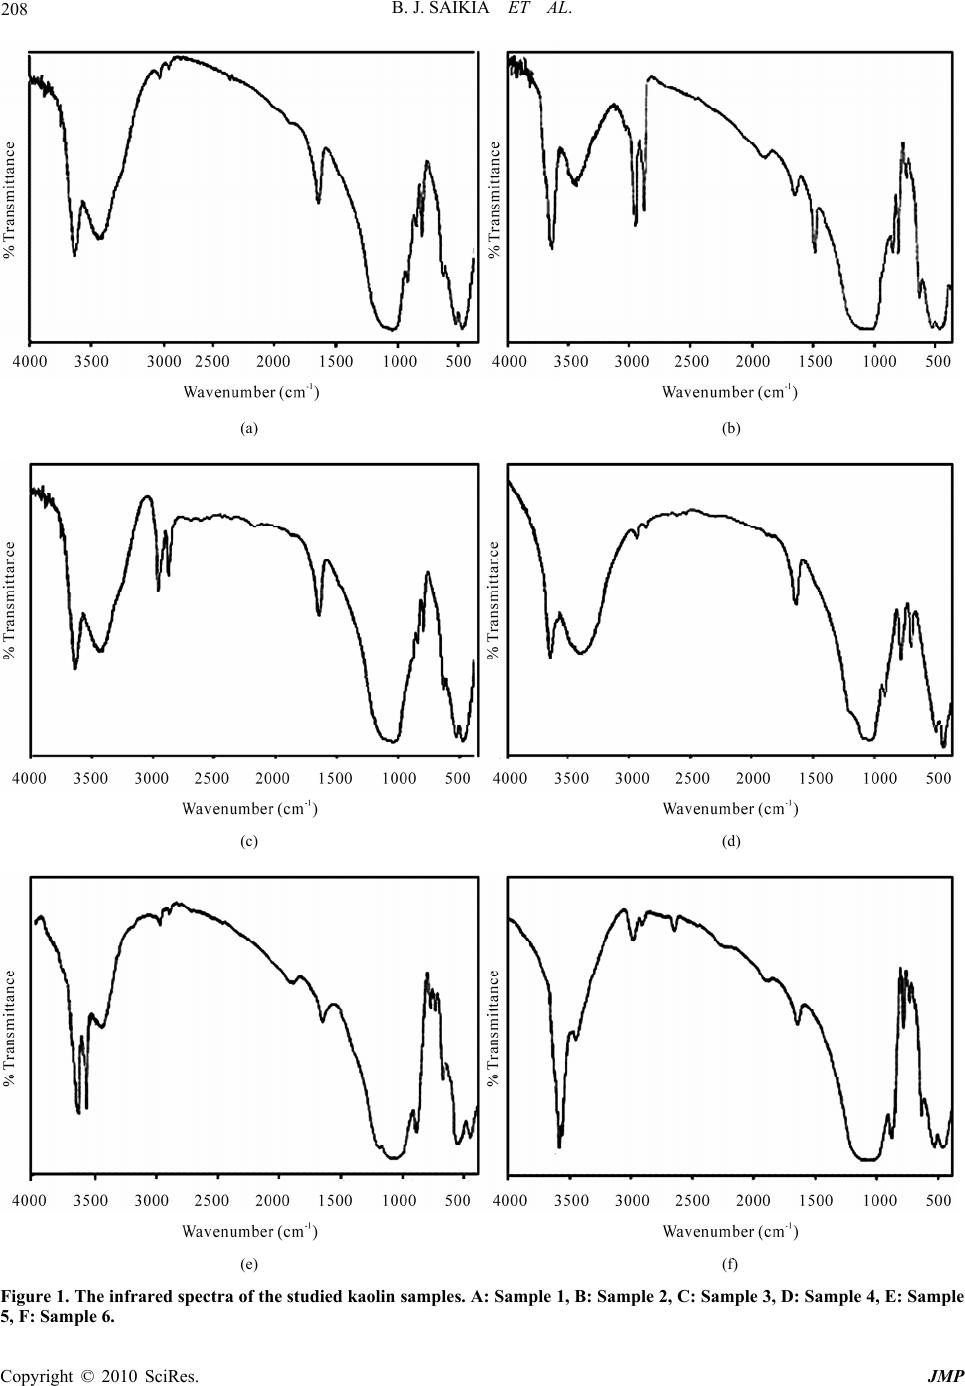 B. J. SAIKIA ET AL. Copyright © 2010 SciRes. JMP 208 (a) (b) (c) (d) (e) (f) Figure 1. The infrared spectra of the studied kaolin samples. A: Sample 1, B: Sample 2, C: Sample 3, D: Sample 4, E: Sample 5, F: Sample 6. 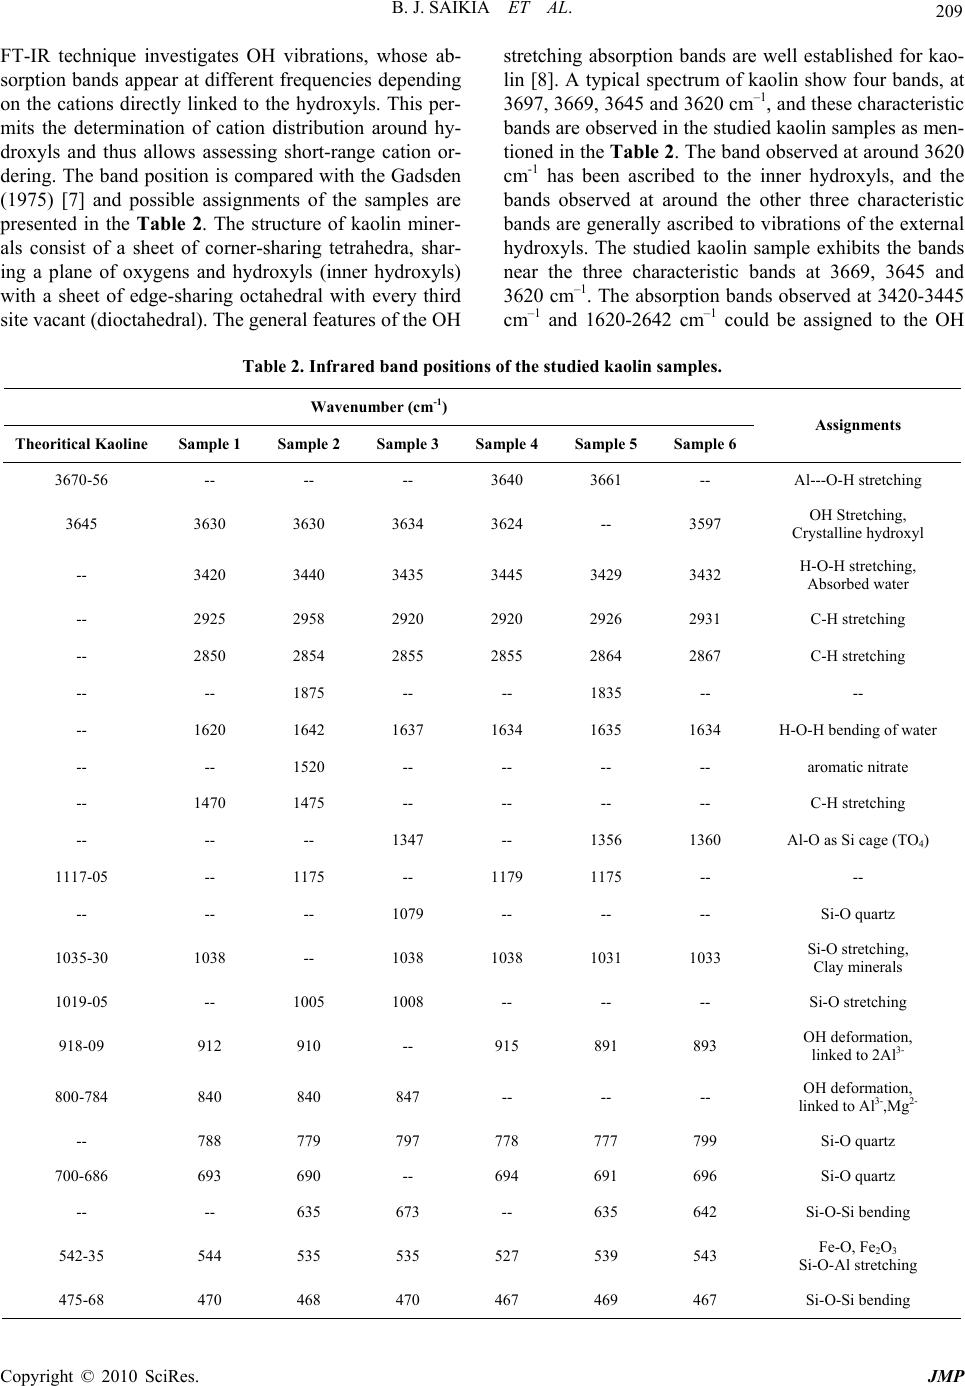 B. J. SAIKIA ET AL. Copyright © 2010 SciRes. JMP 209 FT-IR technique investigates OH vibrations, whose ab- sorption bands appear at different frequencies depending on the cations directly linked to the hydroxyls. This per- mits the determination of cation distribution around hy- droxyls and thus allows assessing short-range cation or- dering. The band position is compared with the Gadsden (1975) [7] and possible assignments of the samples are presented in the Table 2. The structure of kaolin miner- als consist of a sheet of corner-sharing tetrahedra, shar- ing a plane of oxygens and hydroxyls (inner hydroxyls) with a sheet of edge-sharing octahedral with every third site vacant (dioctahedral). The general features of the OH stretching absorption bands are well established for kao- lin [8]. A typical spectrum of kaolin show four bands, at 3697, 3669, 3645 and 3620 cm–1, and these characteristic bands are observed in the studied kaolin samples as men- tioned in the Ta ble 2. The band observed at around 3620 cm-1 has been ascribed to the inner hydroxyls, and the bands observed at around the other three characteristic bands are generally ascribed to vibrations of the external hydroxyls. The studied kaolin sample exhibits the bands near the three characteristic bands at 3669, 3645 and 3620 cm–1. The absorption bands observed at 3420-3445 cm–1 and 1620-2642 cm–1 could be assigned to the OH Table 2. Infrared band positions of the studied kaolin samples. Wavenumber (cm-1) Theoritical Kaoline Sample 1 Sample 2 Sample 3 Sample 4 Sample 5 Sample 6 Assignments 3670-56 -- -- -- 3640 3661 -- Al---O-H stretching 3645 3630 3630 3634 3624 -- 3597 OH Stretching, Crystalline hydroxyl -- 3420 3440 3435 3445 3429 3432 H-O-H stretching, Absorbed water -- 2925 2958 2920 2920 2926 2931 C-H stretching -- 2850 2854 2855 2855 2864 2867 C-H stretching -- -- 1875 -- -- 1835 -- -- -- 1620 1642 1637 1634 1635 1634 H-O-H bending of water -- -- 1520 -- -- -- -- aromatic nitrate -- 1470 1475 -- -- -- -- C-H stretching -- -- -- 1347 -- 1356 1360 Al-O as Si cage (TO4) 1117-05 -- 1175 -- 1179 1175 -- -- -- -- -- 1079 -- -- -- Si-O quartz 1035-30 1038 -- 1038 1038 1031 1033 Si-O stretching, Clay minerals 1019-05 -- 1005 1008 -- -- -- Si-O stretching 918-09 912 910 -- 915 891 893 OH deformation, linked to 2Al3- 800-784 840 840 847 -- -- -- OH deformation, linked to Al3-,Mg2- -- 788 779 797 778 777 799 Si-O quartz 700-686 693 690 -- 694 691 696 Si-O quartz -- -- 635 673 -- 635 642 Si-O-Si bending 542-35 544 535 535 527 539 543 Fe-O, Fe2O3 Si-O-Al stretching 475-68 470 468 470 467 469 467 Si-O-Si bending  B. J. SAIKIA ET AL. Copyright © 2010 SciRes. JMP 210 vibrational mode of the hydroxyl molecule, which is ob- served in almost all the natural hydrous silicates. The bands between 3450 and 3670 cm–1 are attributed to the OH stretching mode. In ferric saponite hydroxyl peaks at 3610 and 3400 cm–1 are characteristic [6,9]. The H-O-H bending of water is observed at 1620-1642 cm-1. In the 1000cm-1(10 μm) and 500 cm-1(20 μm) re- gion, main functional groups were Si-O and Al-OH. Muscovite and possibly quartz interference could be ob- served at 1031-1038 cm-1 for the studied kaolin. The Al-OH absorption peak was identified at 891-915 cm-1 for the studied sample. The band at 914-936 cm-1 cor- responding to Al-OH bending vibrations of kaolinite, the doublet at 780-798 cm-1 is due to Si-O-Si inter tetrahe- dral bridging bonds in SiO2 and OH deformation band of gibbsite at 1000 cm-1 are finger-prints of the typical vi- brational modes which are recognized easily. In the car- bonate and C-H bending vibration region, the kaolin samples exhibit some weak peaks (Table 2).The band found at 1347-1360 cm-1 arises due to 2vs, overtone of Al-O as Si cage (TO4). The carbonate structure contains isolated CO32– group with a doubly degenerate symmet- ric stretch (ν3) at the region 1508-1560 cm–1 [10]. This band is observed in the studied kaolin at 1520cm-1. An- other band found at 1470-1475 cm-1 is arising due to Na+….CO32- vibration [11]. The OH deformation of wa- ter is found in between 1620-2642 cm-1. The kaolin sam- ples exhibits the C-H stretching bands in between 2850–2958 cm-1 indicating polyatomic Cn-H-O entitles with C bonded to two or three H. The strongest CH band in between 2920-2931 cm-1 assigned to symmetrical stretch of C-H mode of –CH2-group. The bend between 2850-2867 cm–1 is assigned to anti symmetrical stretch of –CH2-group. Another peak is found at 2954cm-1 in one kaolin sample due to symmetric stretch of –CH3 group. 4. Conclusions The compositional analysis (XRF) exhibits that kaolin of the study area are constituted of alumina and silica in major quantities. The minor and trace oxide composi- tions are iron, calcium, magnesium and other elements. The presence of quartz and organic matter as minor phases were confirmed by FTIR analysis. The infrared spectra of the kaolin samples exhibits, the Si-O stretch- ing vibrations at around 778 cm–1, 695 cm–1 and 468 cm–1 which is indicative of the presence of quartz in the kaolin samples. 5. Acknowledgements We thank Directors, National Geophysical Research In- stitute (NGRI), Hyderabad, North East Institute of Sci- ence and Technology (NEIST), Jorhat and G. B. Pant Institute of Himalayan Environment and Development (GBPIHED), Almora, for their cooperation during this work. We also thank Dr. P. K. Baruah, Gauhati Univer- sity, Guwahati, for his assistance in the FTIR analysis. 6. References [1] S. Babel and T. A. Kurniawan, “Low Cost Adsorbents for Heavy Metals Uptake from Contaminated Water: A Re- view,” Journal of Hazardous Materials, Vol. 97, No. 1-3, 2003, pp. 219-243. [2] P. S. Nayak and B. K. Singh, “Instrumental Characteriza- tion of Clay by XRF, XRD and FTIR,” Bulletin of Mate- rials Science, Vol. 30, No. 3, 2007, pp. 235-240. [3] L. Benco, D. Tunega, J. Hafner and H. Lischka, “Ab initio Density Functional Theory Applied to the Structure and Proton Dynamics of Clays,” Chemistry Physics Let- ter, Vol. 333, No. 6, 2001, pp. 479-484. [4] K. H. Tan, “Principles of soil chemistry,” Mariel Dekker Inc., New York, USA, 1998. [5] Indian Standard Methods of Chemical Analysis of Fire- clay and Refractory Materials, 1960, IS: 1527. [6] G. Parthasarathy, “Effect of High-Pressures on the Elec- trical Resistivity of Natural Zeolites from the Deccan Trap, Mahrashtra, India,” Journal of Applied Geophysics Vol. 58, No. 4, pp. 321-329. [7] J. A. Gadsen, “Infrared Spectra of Minerals and Related Inorganiccompounds,” Butterworths, London, 1975. [8] V. C. Farmer, “The Infrared Spectra of Minerals,” Min- eralogical Society, Middlesex, UK, 1974. [9] G. Parthasarathy, A. C. Kunwar and R. Srinivasan, “Oc- currence of Moganite-Rich Chalcedony in Deccan Flood Basalts, Killari, Maharashtra, India,” European Journal of Mineral, Vol. 13, No. 1, 2001, pp. 127-134. [10] G. Parthasarathy, T. R. K. Chetty and S. E. Haggerty, “Thermal Stability and Spectroscopic Studies of Zem- korite: A Carbonate from the Venkatampalle Kimberlite of Southern India,” American Mineralogist, Vol. 87, No. 10, 2002, pp. 1384-1389. [11] P. F. McMillan, G. H. Wolf and B. T. e Poe, “Vibrational Properties of Silicate Liquids and Glasses,” Chemical Geology, Vol. 96, No. 3-4, 1992, pp. 351-356. |