Journal of Encapsulation and Adsorption Sciences, 2013, 3, 57-63
http://dx.doi.org/10.4236/jeas.2013.32007 Published Online June 2013 (http://www.scirp.org/journal/jeas)
Study on the Effect of Preparation Parameters of
K2CO3/Al2O3 Sorbent on CO2 Capture Capacity at Flue
Gas Operating Conditions
Javad Esmaili, Mohammad Reza Ehsani
Department of Chemical Engineering, Isfahan University of Technology, Isfahan, Iran
Email: javad esmaili@ce.iut.ac.ir, ehsanimr@cc.iut.ac.ir
Received February 6, 2013; revised March 6, 2013; accepted March 14, 2013
Copyright © 2013 Javad Esmaili, Mohammad Reza Ehsani. This is an open access article distributed under the Creative Commons
Attribution License, which permits unrestricted use, distribution, and reproduction in any medium, provided the original work is
properly cited.
ABSTRACT
In this paper, study on the effect of preparation conditions of K2CO3/Al2O3 sorbent was done. Box-Behnken design was
applied to study the influence of four parameters involve initial solution concentration, impregnation time and calcina-
tion step temperature and time. A quadratic model was used to correlate the sorbent capture capacity. The model was
used to calculate the optimum conditions for preparing sorbent. From the analysis of variance (ANOVA), the most in-
fluential factor on each experimental design response was identified. The potassium-based sorbents used in this study
were prepared by impregnating K2CO3 on Al2O3 support. The CO2 capture capacity was measured in the presence of
H2O in a fixed-bed reactor at CO2 capture temperature of 60˚C using breakthrough curves. The optimum sorbent pre-
pared by this method showed CO2 capture capacity of 77.21 mg CO2/g sorbent. It was observed that the experimental
values obtained were in good agreement with the values predicted by the model, with relatively small errors between
the predicted and the actual values. The results obtained in this study can be used as basic data for study on design and
operating condition optimization of CO2 capture process using these sorbents.
Keywords: CO2 Capture; K2CO3/Al2O3 Sorbent; Response Surface Method; Box-Behnken Design
1. Introduction
Global warming increasingly thought to be associated
with the atmospheric emission of greenhouse gases. Car-
bon Dioxide is a major greenhouse gas that is released
into the atmosphere due to the use of fossil fuels. It can
be removed from flue gas by various methods such as
membrane separation, amine scrubbing, and using mole-
cular sieves [1-3]. These methods however are costly and
energy intensive.
Solid sorbent processes for CO2 capture are also under
study. The use of solid sorbents can be a highly cost-effec-
tive and energy efficient way to remove CO2 [4-7]. Sor-
bents containing alkali and alkaline-earth metals like po-
tassium carbonate and calcium oxide are investigated for
this commercial feasibility [8].
Alkaline-earth method-based sorbents such as MgO
and CaO are applicable at much higher adsorption and
regeneration temperatures [7]. Alkali metal-based sor-
bents were employed in CO2 adsorption at low tempera-
tures (50˚C - 70˚C) with thermal regeneration easily oc-
curring at low temperatures (<200˚C). CO2 capture using
a dry sodium-based sorbent was also reported [9,10]. How-
ever, when CO2 reacted with Na2CO3, the global carbona-
tion reaction rate was rather slow [11]. The CO2 adsorp-
tion and regeneration of potassium-based sorbents with
several supports such as activated carbon [4,5,12], TiO2,
SiO2, MgO, ZrO2, CaO and Al2O3 were studied [6,9,13,
14]. Al2O3 is one of the most proper materials used as
sorbent support.
In most of the previous works, the sorbent prepara-
tion conditions were fixed and the effect of the different
conditions on the capture capacity which is an important
specification of the sorbent for commercial applications,
has not been studied yet. The objective of this work was
to study the influence of preparation condition on sorbent
capture capacity and finding optimum condition for pre-
paration of sorbent at larger scales. Therefore, the scope
of this research was to carry out a statistical optimization
to determine the optimum preparation conditions of K2CO3/
Al2O3 sorbent, in order to achieve high CO2 capture ca-
pacity using the response surface methodology approach
C
opyright © 2013 SciRes. JEAS
J. ESMAILI, M. R. EHSANI
58
(RSM). Response surface methodology (RSM) is an em-
pirical statistical technique employed for multiple regres-
sion analysis by using quantitative data. It solves multi-
variate data which is obtained from properly designed
experiments to solve multivariate equation simultaneous-
ly [15]. This method was applied by many of researcher
for study on various multi-variable phenomena [16,17].
2. Experimental
2.1. Preparation of Sorbent
The potassium-based sorbents used in this study were
prepared by impregnating K2CO3 on Al2O3 (Aluminum
Oxide, Merck) as support. Twenty (20.0) g of Al2O3 was
added to an aqueous solution of anhydrous potassium
carbonate (K2CO3, Merck) with particular concentration
in deionized water (Initial solution concentration). Then,
it was mixed with a magnetic stirrer at room temperature
(Impregnation time). After that, the mixture was dried in
a rotary vacuum evaporator at 60˚C. The dried samples
were calcined in a furnace under a N2 flow (100 cc/min)
for a particular time at selected temperature (Calcination
time and temperature).
2.2. Apparatus and Procedures
A fixed-bed Stainless-Steel reactor (diameter of 15 mm),
which was placed in an electric furnace under atmos-
pheric pressure was used for adsorption process. Two
(2.0) g of the sorbent was packed into the reactor. In or-
der to prevent condensation of water vapor injected into
the reactor and GC column the temperatures of the inlet
and outlet lines of the reactor were maintained above
100˚C. The column used in this analysis was a 1/8 in.
stainless tube packed with Porapak Q. When the CO2
concentration of the outlet gas reached the same level as
that of the inlet gas in the CO2 adsorption process, proc-
ess was stopped. The outlet gas from the reactor was au-
tomatically analyzed every 5 min by a thermal conduc-
tivity detector (TCD), which was equipped with an auto
sampler (Valco online valve). Schematic diagram of the
fixed-bed reactor is shown in Figure 1.
The feed stream comprises of Nitrogen, carbon diox-
ide and water. The liquid water flow rate was controlled
using a piston pump and the water was vaporized before
entering the column. Both CO2 and N2 flow rates were
controlled by independent mass flow controllers and
Figure 1. Schematic diagram of the fixed-bed reactor.
Copyright © 2013 SciRes. JEAS
J. ESMAILI, M. R. EHSANI 59
these gases were mixed with the vaporized water inside
the oven where experiments were done. All the CO2 sor-
ption tests were performed following the same proce-
dure.
The CO2 capture capacity of the sorbent was evaluated
by the breakthrough curve for CO2 adsorption. In this
study, the CO2 capture capacity of sorbent was calculated
from its breakthrough curve during CO2 adsorption in the
presence of 9.0 vol.% H2O and 1 vol.% CO2. The CO2
capture capacity describes the amount of CO2 absorbed
until the output concentration of CO2 reached 1 vol.%,
which was is the same value as that of the inlet.
2.3. Design of Experiments
The RSM has several classes of designs, with its own
properties and characteristics. Central composite design
(CCD), Box-Behnken design (BBD) and three-level fac-
torial design are the most popular designs applied by the
researchers. In this work, the Box-Behnken design was
used to study the effects of the variables towards their
responses and subsequently in the optimization studies.
This method is suitable for fitting a quadratic surface and
it helps to optimize the effective parameters with a mi-
nimum number of experiments, as well as to analyze the
interaction between the parameters. In order to determine
if there exist a relationship between the factors and the
response variables investigated, the data collected must
be analyzed in a statistically manner using regression. A
regression design is normally employed to model a re-
sponse as a mathematical function (either known or em-
pirical) of a few continuous factors and good model para-
meter estimates are desired [18].
Replicates of the test at the center are very important
as they provide an independent estimation of the experi-
mental error. Each variable is investigated at two levels.
Meanwhile, as the number of factors, n, increases, the
number of runs for a complete replicate of the design in-
creases rapidly. In this case, main effects and interactions
may be estimated by fractional factorial designs running
only a minimum number of experiments. Individual sec-
ond-order effects cannot be estimated separately by 2n
factorial designs. The responses and the corresponding
parameters are modeled and optimized using ANOVA to
estimate the statistical parameters by means of response
surface methods.
Basically this optimization process involves three ma-
jor steps, which are, performing the statistically designed
experiments, estimating the coefficients in a mathemati-
cal model and predicting the response and checking the
adequacy of the model.
It is assumed that the independent variables are con-
tinuous and controllable by experiments with negligible
errors. It is required to find a suitable approximation for
the true functional relationship between independent va-
riables and the response surface [19].
The experimental sequence was randomized in order
to minimize the effects of the uncontrolled factors. Re-
gression analysis was performed to determine the surface
response as function of second order polynomial equa-
tion:
0
1
2
1=1
=+ ++
kk k
i iii iiij ij
ii iij
Q
x
xx
 

 
x (1)
where Q is the predicted response (sorbent capture ca-
pacity), βi, βii, βij represent linear, quadratic and interac-
tion effects. β0 is the intercept term and xi, xj, …, xk are
the input variables which affect the Q value [20].
In this work the influence of four sorbent preparation
parameters involve initial solution concentration, impreg-
nation time and calcination step temperature and time on
sorbent CO2 capture capacity has been studied. The range
of these variables selected base on previous works of
other researchers [6,7,13,14] (Table 1).
3. Results and Discussion
3.1. Development of Regression Model Equation
The design of experiment is given in Table 2, together
with the experimental results. Eight replicate runs were
observed at the centre of the design to allow the estima-
tion pure error.
Using multiple regression analysis, the second order po-
lynomial model (Equation (1)), which characterizes the
relationship between sorbent capture capacity and studi-
ed variables, was obtained. The coefficients of polyno-
mial are shown in Table 3.
Response surface plots were described by the regres-
sion model for BBD which was developed using MINI-
TAB 14 software. The student’s t-test was performed to
determine the significance of the regression coefficients.
The results of statistical analysis including the regression
coefficient, t and p values for linear, quadratic and com-
bined effects of the variables are given in Table 3. The
statistical significance of the model was also determined
by F-test for analysis of variance (ANOVA) and re-
Table 1. Experimental range and le vels of indepe ndent var i-
ables for preparation of sorbents.
Code levels
Independent
variables SymbolsUnit 1 0 1
Initial solution
concentration ISC wt% 10 25 40
Impregnation time ITI hr 1 12 23
Calcination time CTI hr 3 4 5
Calcination
temperature CTE ˚C 300 400 500
Copyright © 2013 SciRes. JEAS
J. ESMAILI, M. R. EHSANI
60
Table 2. Box-Behnken design matrix, the experimental and
predicted values of sorption capture capacity.
Sorbent preparation variables
(
Code levels
)
Sorbent capture capacity (mg/g)
Run
ISC ITI CTI CTE Experimental Predicted
1 1 0 1 0 71.61 75.49
2 0 1 0 1 69.63 64.98
3 0 0 0 0 74.25 74.19
4 1 0 0 1 52.89 55.07
5 0 1 0 1 72.19 68.32
6 1 0 1 0 79.09 76.66
7 1 0 0 1 74.14 77.37
8 1 1 0 0 73.19 76.84
9 1 0 1 0 55.31 54.72
10 0 0 1 1 64.89 65.81
11 1 1 0 0 54.97 56.99
12 1 0 0 1 71.34 71.67
13 0 1 1 0 69.87 71.49
14 1 0 1 0 49.67 52.82
15 0 0 0 0 71.26 74.19
16 1 1 0 0 75.35 78.83
17 1 0 0 1 52.69 49.37
18 1 1 0 0 53.19 54.07
19 0 1 1 0 75.51 73.06
20 0 1 0 1 69.46 71.56
21 0 0 1 1 66.45 63.96
22 0 1 0 1 70.04 73.14
23 0 0 1 1 70.45 71.19
24 0 1 1 0 72.51 70.57
25 0 0 0 0 76.07 74.19
26 0 0 1 1 66.85 69.98
27 0 1 1 0 68.71 69.07
Table 3. Estimated regression coefficients of second order
polynomial model for optimization of sorbent preparation
(R2 = 0.971).
Coefficient Estimated
coefficient t-Value p-Value
β0 57.431 2.553 0.025
β1 (ISC) 2.3232 5.599 0.000
β2 (ITI) 0.1163 0.290 0.777
β3 (CTI) 20.014 2.717 0.019
β4 (CTE) 0.2803 3.757 0.003
β11 (ISC2) 0.0303 8.900 0.000
β22 (ITI2) 0.0057 0.566 0.582
β33 (CTI2) 2.4512 2.432 0.032
β44 (CTE2) 0.0004 3.781 0.003
β12 (ISC*ITI) 0.0014 0.090 0.930
β13 (ISC*CTI) 0.0120 0.434 0.672
β14 (ISC*CTE) 0.0000 0.613 0.551
β23 (ITI*CTI) 0.0018 0.434 0.672
β24 (ITI*CTE) 0.0004 0.467 0.649
β34 (CTI*CTE) 0.0016 1.217 0.247
siduals analysis was performed to validate the model at
97% of confidence level. The model fitted well with
amylase activity and the optimal values from the model
was justified (p = 0.000). The ANOVA given in Table 4
indicates that the linear, quadratic terms in second order
polynomial Model were highly significant (p < 0.001)
and adequate to represent the relationship between sor-
bent capture capacity (mg/g) and initial solution concen-
tration, impregnation time and calcination step temperature
and time.
Figures 2 and 3 show the three-dimensional response
surface which were constructed to show the interaction
effect of the sorbent preparation variables on the sorbent
capture capacity.
Table 4. Analysis of variance (ANOVA) of second order po-
lynomial model for optimization of sorbent capture capaci-
ty.
Source Degree of
freedom
Sum of
square
Mean of
square F-value P-value
Regression 14 1794.5 128.182 28.54<0.001
Linear 4 1387.6 43.678 9.73 <0.001
Square 4 395.87 98.967 22.04<0.001
Interaction 6 11.06 1.843 0.41 0.858
Residual error12 53.89 4.491
Lack-of-Fit 10 42.09 4.209 0.71 0.709
Pure error 2 11.80 5.898
Total 26 1848.4
Figure 2. The combined effect of initial solution concentra-
tion and impregnation time on sorbent capture capacity
(CTE = 400˚C, CTI = 4 hr).
Figure 3. The combined effect of calcination temperature
and calcination time on sorbent capture capacity (ISC =
25%, ITI = 12 hr).
Copyright © 2013 SciRes. JEAS
J. ESMAILI, M. R. EHSANI 61
As can be seen in Figure 2, the sorbent capacity gen-
erally increases with increase in initial solution concen-
tration and impregnation time. This trend is the result of
increase of potassium carbonate loading on sorbent with
the increase of these parameters; but the rate of increas-
ing is slow at higher values since the K2CO3 loading is
limited. The initial solution concentration is more effec-
tive than impregnation time; it shows that the rate of im-
pregnation of K2CO3 on alumina support is high.
As can be seen in Figure 3, the sorbent capacity has a
maximum point with increase in calcination temperature
and time and after this point it decreases. This trend is
the result of improvement of sorbent structure in calcina-
tion step that increases the sorbent capture capacity. At
calcination step, the higher temperature and longer time
damage some formed structures and decreases the sor-
bent capacity.
3.2. Process Optimization
In the production of commercial sorbent, relatively high
sorbent capture capacity are expected. Therefore, in order
to optimize preparation condition, Minitab 14 is used.
The sorbent was prepared under the experimental condi-
tions given in Table 5, together with the predicted and
experimental values for sorbent capture capacity. The
optimum sorbent prepared was obtained by using initial
solution concentration of 32.3 wt%, impregnation time of
13.4 hr, calcination temperature of 367˚C and calcination
time of 4.1 hr. The optimum sorbent showed capture ca-
pacity of 77.21 mg CO2/g sorbent. It was observed that
the experimental values obtained were in good agreement
with the values predicted from the model, with relatively
small errors between the predicted and the actual values
(Table 5).
Figure 4 shows the variation of sorbent capture capac-
ity with the parameters at the optimum conditions. For
the two parameters involve calcination time and tempe-
rature, the optimum point locate at the curve maximum
point. The overall trend of four curves represents that the
initial solution concentration is the most effective pa-
rameters on the final sorbent capture capacity.
Figure 5, shows the breakthrough curves of the sor-
bent prepared at the optimum conditions during CO2 ad-
sorption in the presence of 9.0 vol.% H2O and 1 vol.%
CO2 at 60˚C. It was observed that the breakthrough time
was 16 min. Further study is required to enhance the CO2
adsorption rate.
Table 5. Model validation.
Sorbent capture
capacity (mg/g)
Initial
solution
concentration
(wt%)
Impregnation
time (hr)
Calcinations
temperature
(˚C)
Calcination
time (hr) Predicte
d
Experimental
32.3 13.4 367.0 4.1 78.66 77.21
(a)
(b)
(c)
(d)
Figure 4. The effect of four parameters on sorbent capture
capacity at optimum conditions (× symbol shows optimum
point for each curve).
Copyright © 2013 SciRes. JEAS
J. ESMAILI, M. R. EHSANI
62
Figure 5. The breakthrough curves of the sorbent prepare
at optimum conditions during CO2 adsorption.
4. Conclusions
The sorbent capacity for carbon dioxide capture from a
gas stream is important for the industrial application of
solid sorbents. The present investigation was carried out
to study combined effects of the initial solution concen-
tration, impregnation time, calcination temperature, and
calcination time on the sorbent capture capacity using a
Box-Behnken design under the Response surface metho-
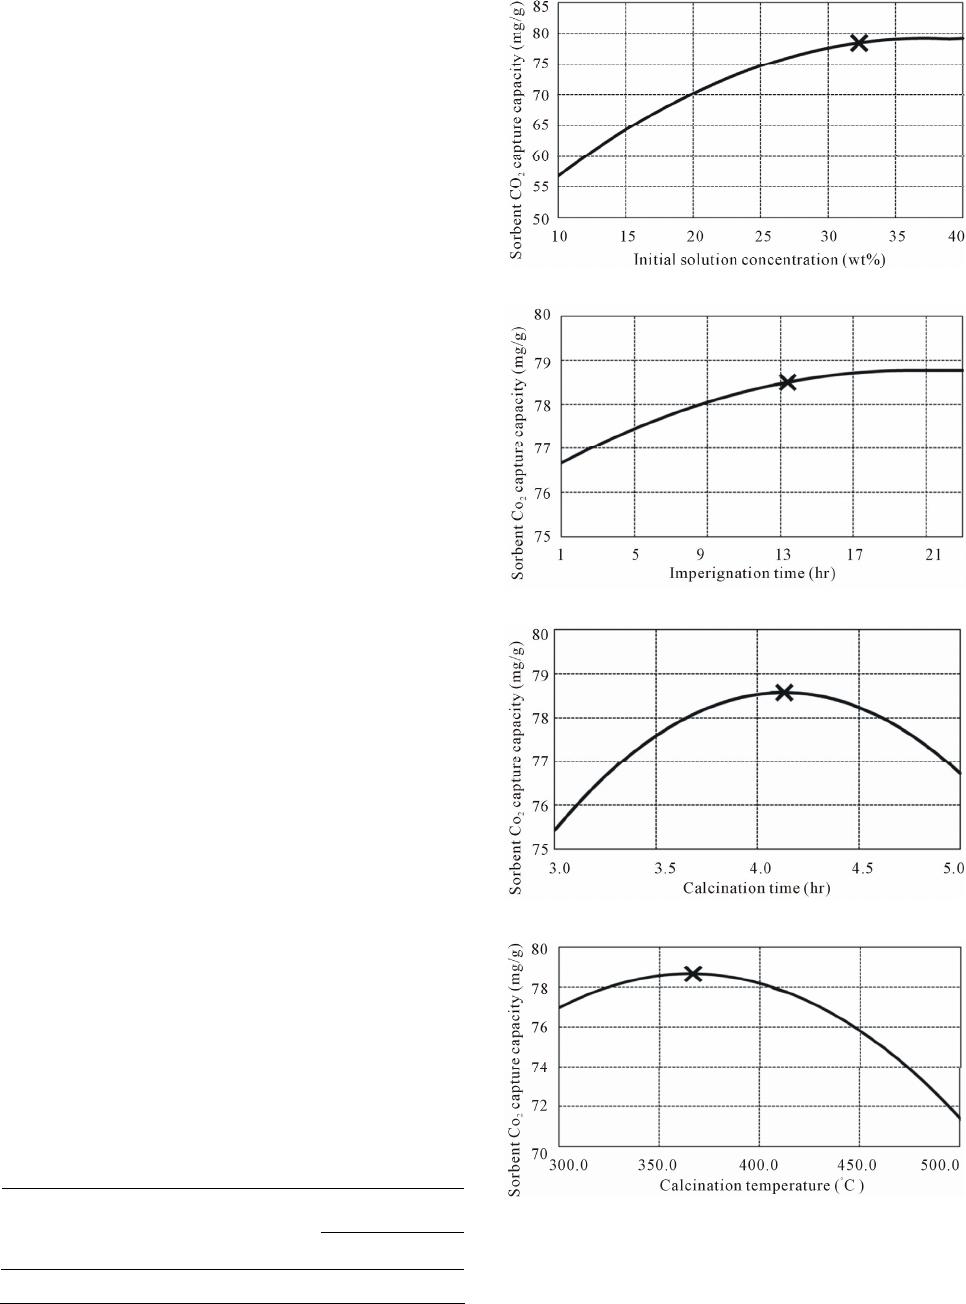
dology (RSM). The obtained results demonstrate that
sorbent capacity increased with increasing the initial so-
lution concentration and impregnation time. Sorbent ca-
pacity has a maximum point for variation of calcination
temperature and time and further increases of these vari-
ables lead to decrease of sorbent capacity. However,
ANOVA analysis as well as 3D surface plots revealed
that initial solution concentration has the greatest effect
on sorbent capacity. On the basis of the results it can be
concluded that RSM presents an excellent tool which
enables the evaluation of interactions and competitive
effects in multivariable systems and reduces the number
of needed experiments in contrast to the classical method
of changing one variable at a time.
The optimized values obtained for initial solution con-
centration, impregnation time and calcination step tempe-
rature and time were 32.3 wt%, 13.4 hr, 367˚C and 4.1 hr,
respectively, with the predicted maximized response of
sorbent capture capacity (78.66 mg CO2/g sorbent). Stu-
dy on other sorbent characterization such as mechanical
strength require for application of this procedure for pre-
paration of industrial sorbents.
REFERENCES
[1] P. Hagewiesche, S. S. Ashour, H. A. Al-Ghawas and O. C.
Sandall, “Absorption of Carbon Dioxide into Aqueous
Blends of Monoethanolamine and N-Methyldiethanola-
mine,” Chemical Engineering Science, Vol. 50, No. 7,
1995, pp. 1071-1079.
doi:10.1016/0009-2509(94)00489-E
[2] M. Mavroudi, S. P. Kaldis and G. P. Sakellaropoulos,
“Reduction of CO2 Emissions by a Membrane Contacting
Process,” Fuel, Vol. 82, No. 15-17, 2003, pp. 2153-2159.
doi:10.1016/S0016-2361(03)00154-6
[3] R. V. Siriwardane, M. S. Shen, E. P. Fisher and J. A. Po-
ston, “Adsorption of CO2 on Molecular Sieves and Acti-
vated Carbon,” Energy & Fuels, Vol. 15, No. 2, 2001, pp.
279-284. doi:10.1021/ef000241s
[4] H. Hayashi, J. Taniuchi, N. Furuyashiki, S. Sugiyama, S.
Hirano, N. Shigemoto and T. Nonaka, “Efficient Recov-
ery of Carbon Dioxide from Flue Gases of Coal-Fired Po-
wer Plants by Cyclic Fixed-Bed Operations over K2CO3-
on-Carbon,” Industrial and Engineering Chemistry Re-
search, Vol. 37, No. 1, 1998, pp. 185-191.
doi:10.1021/ie9704455
[5] N. Shigemoto, T. Yanagihara, S. Sugiyama and H. Haya-
shi, “Material Balance and Energy Consumption for CO2
Recovery from Moist Flue Gas Employing K2CO3-on-
Activated Carbon and Its Evaluation for Practical Adapta-
tion,” Energy & Fuels, Vol. 20, No. 2, 2006, pp. 721-726.
doi:10.1021/ef058027x
[6] S. C. Lee, B. Y. Choi, S. J. Lee, S. Y. Jung, C. K. Ryu
and J. C. Kim, “CO2 Absorption and Regeneration Using
Na and K Based Sorbents,” Studies in Surface Science
and Catalysis, Vol. 153, No. 1, 2004, pp. 527-530.
doi:10.1016/S0167-2991(04)80307-0
[7] S. C. Lee, B. Y. Choi, C. K. Ryu, Y. S. Ahn and J. C. Kim,
“Absorption and Regeneration of Alkali Metal-Based So-
lid Sorbents,” Catalysis Today, Vol. 111, No. 3-4, 2006,
pp. 385-390. doi:10.1016/j.cattod.2005.10.051
[8] J. S. Hoffman and H. W. Pennline, “Study of Regenerable
Sorbents for CO2 Capture, First National Conference on
Carbon Sequestration, Washington,” 2001.
[9] Y. Liang, D. P. Harrison, R. P. Gupta, D. A. Green and W.
J. McMichael, “Carbon Dioxide Capture Using Dry So-
dium-Based Sorbents,” Energy & Fuels, Vol. 18, No. 2,
2004, pp. 569-575. doi:10.1021/ef030158f
[10] Y. W. Seo, S. H. Jo, C. K. Ryu and C. K. Yi, “Effects of
Water Vapor Pretreatment Time and Reaction Tempera-
ture on CO2 Capture Characteristics of a Sodium-Based
Solid Sorbent in a Bubbling Fluidized-Bed Reactor,”
Chemosphere, Vol. 69, No. 5, 2007, pp. 712-718.
doi:10.1016/j.chemosphere.2007.05.036
[11] C. Zhao, X. Chen and C. Zhao, “CO2 Absorption Using
Dry Potassium-Based Sorbents with Different Supports,”
Energy & Fuels, Vol. 23, No. 9, 2009, pp. 4683-4687.
doi:10.1021/ef900182d
[12] S. Hirano, N. Shigemoto, S. Yamaha and H. Hayashi, Cy-
clic Fixed-Bed Operations over K2CO3-on-Carbon for the
Recovery of Carbon Dioxide under Moist Conditions,”
Bulletin of the Chemical Society of Japan, Vol. 68, No. 3,
1995, pp. 1030-1035. doi:10.1246/bcsj.68.1030
[13] A. G. Okunev, V. E. haronov, Y. I. Aistov and V. N. Parmon,
“Sorption of Carbon Dioxide from Wet Gases by K2CO3-
in-Porous Matrix: Influence of the Matrix Nature,” Reac-
tion Kinetics and Catalysis Letters, Vol. 71, No. 2, 2000,
pp. 355-362. doi:10.1023/A:1010395630719
[14] A. G. Okunev, V. E. Sharonov, A. V. Gubar, I. G. Danilo-
va, E. A. Paukshtis, E. M. Moroz, T. A. Kriger, V. V. Ma-
lakhov and Y. I. Aistov, “Sorption of Carbon Dioxide by
Copyright © 2013 SciRes. JEAS
J. ESMAILI, M. R. EHSANI
Copyright © 2013 SciRes. JEAS
63
the Composite Sorbent: Potassium Carbonate in Porous
Matrix,” Russian Chemical Bulletin, Vol. 52, No. 2, 2003,
pp. 359-363.
[15] I. A. W. Tan, A. L. Ahmad and B. H. Hameed, “Optimiza-
tion of Preparation Conditions for Activated Carbons
from Coconut Husk Using Response Surface Methodolo-
gy,” Chemical Engineering Journal, Vol. 137, No. 3,
2008, pp. 462-470. doi:10.1016/j.cej.2007.04.031
[16] M. Tir and M. Moulai-Mostefa, “Optimization of Oil Re-
moval from Oily Wastewater by Electrocoagulation Us-
ing Response Surface Method,” Journal of Hazardous
Materials, Vol. 158, No. 1, 2008, pp. 107-115.
doi:10.1016/j.jhazmat.2008.01.051
[17] J. N. Sahu, J. Acharya and B. C. Meikap, “Response Sur-
face Modeling and Optimization of Chromium(VI) Re-
moval from Aqueous Solution Using Tamarind Wood
Activated Carbon in Batch Process,” Journal of Hazard-
ous Materials, Vol. 172, No. 2-3, 2009, pp. 818-825.
doi:10.1016/j.jhazmat.2009.07.075
[18] A. A. Ahmad, B. H. Hameed and A. L. Ahmad, “Remo-
val of Disperse Dye from Aqueous Solution Using Waste-
Derived Activated Carbon: Optimization Study,” Journal
of Hazardous Materials, Vol. 170, No. 2-3, 2009, pp.
612-619. doi:10.1016/j.jhazmat.2009.05.021
[19] V. Gunaraj and N. Murugan, “Application of Response Sur-
face Methodologies for Predicting Weld Base Quality in
Submerged Arc Welding of Pipes,” Journal of Materials
Processing Technology, Vol. 88, No. 1-3, 1999, pp. 266-
275. doi:10.1016/S0924-0136(98)00405-1
[20] R. H. Myers and D. C. Montgomery, “Response Surface Me-
thodology: Process and Product Optimization Using De-
signed Experiments,” John Wiley and Sons, New York,
2002.