Paper Menu >>
Journal Menu >>
 Materials Sciences and Applications, 2010, 1, 285-291 doi:10.4236/msa.2010.15042 Published Online November 2010 (http://www.SciRP.org/journal/msa) Copyright © 2010 SciRes. MSA 285 PWA Doped SiO2 PEG Hybrid Materials of Class II S. Grandi, P. Mustarelli, A. Carollo, C. Tomasi, E. Quartarone, A. Magistris Department of Physical-Chemistry “M. Rolla”, INFM and I.E.N.I. C.N.R. Department of Pavia, Pavia, Italy. Email: grandi@unipv.it Received July 6th, 2010; revised August 31st, 2010; accepted September 10th, 2010. ABSTRACT Sol-gel is a promising technique for the synthesis of organic-inorganic hybrid materials of class II. One of the most interesting applications for these hybrid materials is as solid polymer electrolytes (SPEs). In particular, when doped with proton species they have potential applications in fuel cells. In this paper SiO2–PEG1500 hybrids of class II were prepared with different contents of SiO2 and phosphotungstic acid. The influence of the SiO2 content in the matrix has been studied. The samples were investigated by thermal analysis (TGA and DSC), X-ray diffraction, infrared spectros- copy (IR), scanning electron microscopy (SEM) and Impedance Spectroscopy. Keywords: Hybrid Materials, Sol-Gel, Protonic Conduction, Phosphotungistic Acid, Polymer Electrolyte 1. Introduction This Organic-inorganic hybrids have important applica- tions in several technological fields, and sol-gel synthesis allows nanoscale mixing of organic and inorganic parts. Two major classes of organic-inorganic materials, related to the kind of molecular bonds/interactions, have been described [1]: 1) materials of class I where organic mole- cules, prepolymers or even polymers are embedded in an inorganic matrix; 2) materials of class II where the inor- ganic and organic parts are connected by covalent bonds. Among the various methods used to form covalently bonded organic-inorganic hybrids [2], the following two are widely employed. In the first one sol-gel monomers containing Si-C bonds are directly used as sol-gel pre- cursors. The Si-C bonds are preserved in the sol-gel hy- drolysis and polycondensation, and the organic groups remain attached to the silica skeleton. A second method consists in functionalising the gel network by organic reactive groups and, after gelation, in attaching organo- functional groups by impregnation. By this way, however, organo-functional groups remain generally bonded to the porous surface only. Organic-inorganic systems of class II as hosts for pro- tons were synthesised in 1999 by Honma et al. [3,4]. Typically, 3-isocyanatopropyltriethoxysilane reacted with polyethylenoxide (PEO) and then the obtained pre- cursor condensed following a typical sol-gel procedure. In some cases other molecules were added in the sol-gel synthesis, such as monophenyltriethoxysilane or mono- phenyltrimethoxysilane. Protons were supplied by monododecylphosphate (MDP) or phosphotungstic acid (PWA). The authors did not study the influence of dif- ferent content of silica in the skeleton and found that the presence of PWA led to a better conductivity of the sam- ples [5]. Lin and co-workers synthesised a series of hy- brid membranes adopting a similar route but employing the 4-dodecylbenzene sulfonic acid [6] or PWA [7] as a proton carrier. According to various fabrication strategies, they also investigated the compatibility of these mem- branes with electrodes for proton conducting fuel cells [8]. PWA exhibits very large proton conductivity at around 0.18 S/cm when crystals are hydrated [9]. How- ever, PWA alone cannot be directly employed in a fuel cell because of its solubility in water. In order to prepare a membrane for a PEMFC operating at intermediate temperature PWA must be dispersed in a polymeric ma- trix with good thermal stability up to the desired tem- perature. In fact, relatively high temperatures could solve problems of CO poisoning, as well as the passivation of the Pt electrocatalysts. For these reasons, in the last years some authors focussed their attention on hybrids of SiO2-PEO (or PPO or PTMO) doped with PWA [10-13] and obtained thermally stable (up 200°C) membranes with good conductivity (~10-2 S/cm). It was found that there is no leaching of the PWA and that the presence of 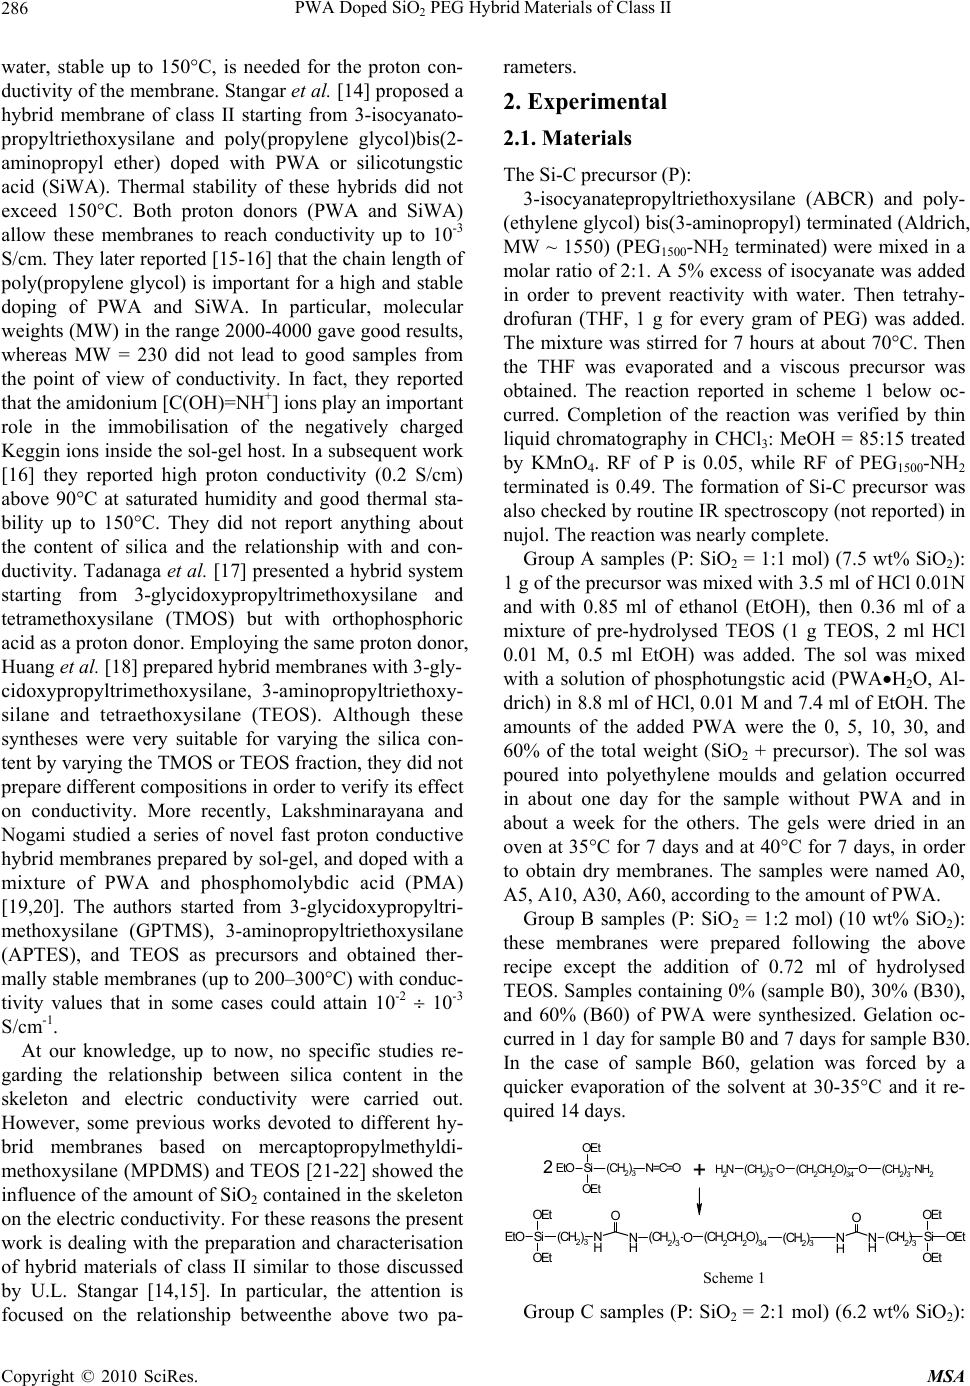 PWA Doped SiO2 PEG Hybrid Materials of Class II Copyright © 2010 SciRes. MSA 286 water, stable up to 150°C, is needed for the proton con- ductivity of the membrane. Stangar et al. [14] proposed a hybrid membrane of class II starting from 3-isocyanato- propyltriethoxysilane and poly(propylene glycol)bis(2- aminopropyl ether) doped with PWA or silicotungstic acid (SiWA). Thermal stability of these hybrids did not exceed 150°C. Both proton donors (PWA and SiWA) allow these membranes to reach conductivity up to 10-3 S/cm. They later reported [15-16] that the chain length of poly(propylene glycol) is important for a high and stable doping of PWA and SiWA. In particular, molecular weights (MW) in the range 2000-4000 gave good results, whereas MW = 230 did not lead to good samples from the point of view of conductivity. In fact, they reported that the amidonium [C(OH)=NH+] ions play an important role in the immobilisation of the negatively charged Keggin ions inside the sol-gel host. In a subsequent work [16] they reported high proton conductivity (0.2 S/cm) above 90°C at saturated humidity and good thermal sta- bility up to 150°C. They did not report anything about the content of silica and the relationship with and con- ductivity. Tadanaga et al. [17] presented a hybrid system starting from 3-glycidoxypropyltrimethoxysilane and tetramethoxysilane (TMOS) but with orthophosphoric acid as a proton donor. Employing the same proton donor, Huang et al. [18] prepared hybrid membranes with 3-gly- cidoxypropyltrimethoxysilane, 3-aminopropyltriethoxy- silane and tetraethoxysilane (TEOS). Although these syntheses were very suitable for varying the silica con- tent by varying the TMOS or TEOS fraction, they did not prepare different compositions in order to verify its effect on conductivity. More recently, Lakshminarayana and Nogami studied a series of novel fast proton conductive hybrid membranes prepared by sol-gel, and doped with a mixture of PWA and phosphomolybdic acid (PMA) [19,20]. The authors started from 3-glycidoxypropyltri- methoxysilane (GPTMS), 3-aminopropyltriethoxysilane (APTES), and TEOS as precursors and obtained ther- mally stable membranes (up to 200–300°C) with conduc- tivity values that in some cases could attain 10-2 10-3 S/cm-1. At our knowledge, up to now, no specific studies re- garding the relationship between silica content in the skeleton and electric conductivity were carried out. However, some previous works devoted to different hy- brid membranes based on mercaptopropylmethyldi- methoxysilane (MPDMS) and TEOS [21-22] showed the influence of the amount of SiO2 contained in the skeleton on the electric conductivity. For these reasons the present work is dealing with the preparation and characterisation of hybrid materials of class II similar to those discussed by U.L. Stangar [14,15]. In particular, the attention is focused on the relationship betweenthe above two pa- rameters. 2. Experimental 2.1. Materials The Si-C precursor (P): 3-isocyanatepropyltriethoxysilane (ABCR) and poly- (ethylene glycol) bis(3-aminopropyl) terminated (Aldrich, MW ~ 1550) (PEG1500-NH2 terminated) were mixed in a molar ratio of 2:1. A 5% excess of isocyanate was added in order to prevent reactivity with water. Then tetrahy- drofuran (THF, 1 g for every gram of PEG) was added. The mixture was stirred for 7 hours at about 70°C. Then the THF was evaporated and a viscous precursor was obtained. The reaction reported in scheme 1 below oc- curred. Completion of the reaction was verified by thin liquid chromatography in CHCl3: MeOH = 85:15 treated by KMnO4. RF of P is 0.05, while RF of PEG1500-NH2 terminated is 0.49. The formation of Si-C precursor was also checked by routine IR spectroscopy (not reported) in nujol. The reaction was nearly complete. Group A samples (P: SiO2 = 1:1 mol) (7.5 wt% SiO2): 1 g of the precursor was mixed with 3.5 ml of HCl 0.01N and with 0.85 ml of ethanol (EtOH), then 0.36 ml of a mixture of pre-hydrolysed TEOS (1 g TEOS, 2 ml HCl 0.01 M, 0.5 ml EtOH) was added. The sol was mixed with a solution of phosphotungstic acid (PWAH2O, Al- drich) in 8.8 ml of HCl, 0.01 M and 7.4 ml of EtOH. The amounts of the added PWA were the 0, 5, 10, 30, and 60% of the total weight (SiO2 + precursor). The sol was poured into polyethylene moulds and gelation occurred in about one day for the sample without PWA and in about a week for the others. The gels were dried in an oven at 35°C for 7 days and at 40°C for 7 days, in order to obtain dry membranes. The samples were named A0, A5, A10, A30, A60, according to the amount of PWA. Group B samples (P: SiO2 = 1:2 mol) (10 wt% SiO2): these membranes were prepared following the above recipe except the addition of 0.72 ml of hydrolysed TEOS. Samples containing 0% (sample B0), 30% (B30), and 60% (B60) of PWA were synthesized. Gelation oc- curred in 1 day for sample B0 and 7 days for sample B30. In the case of sample B60, gelation was forced by a quicker evaporation of the solvent at 30-35°C and it re- quired 14 days. Si OEt OEt EtO (CH2)3N=C=O NH2(CH2)3O(CH2 CH2 O)34 O(CH2)3NH2 Si OEt OEt OEt Si OEt OEt EtO (CH2)3N H(CH2)3O(CH2 CH2 O)34 O N H(CH2)3 N H (CH2)3N H O + 2 Scheme 1 Group C samples (P: SiO2 = 2:1 mol) (6.2 wt% SiO2): 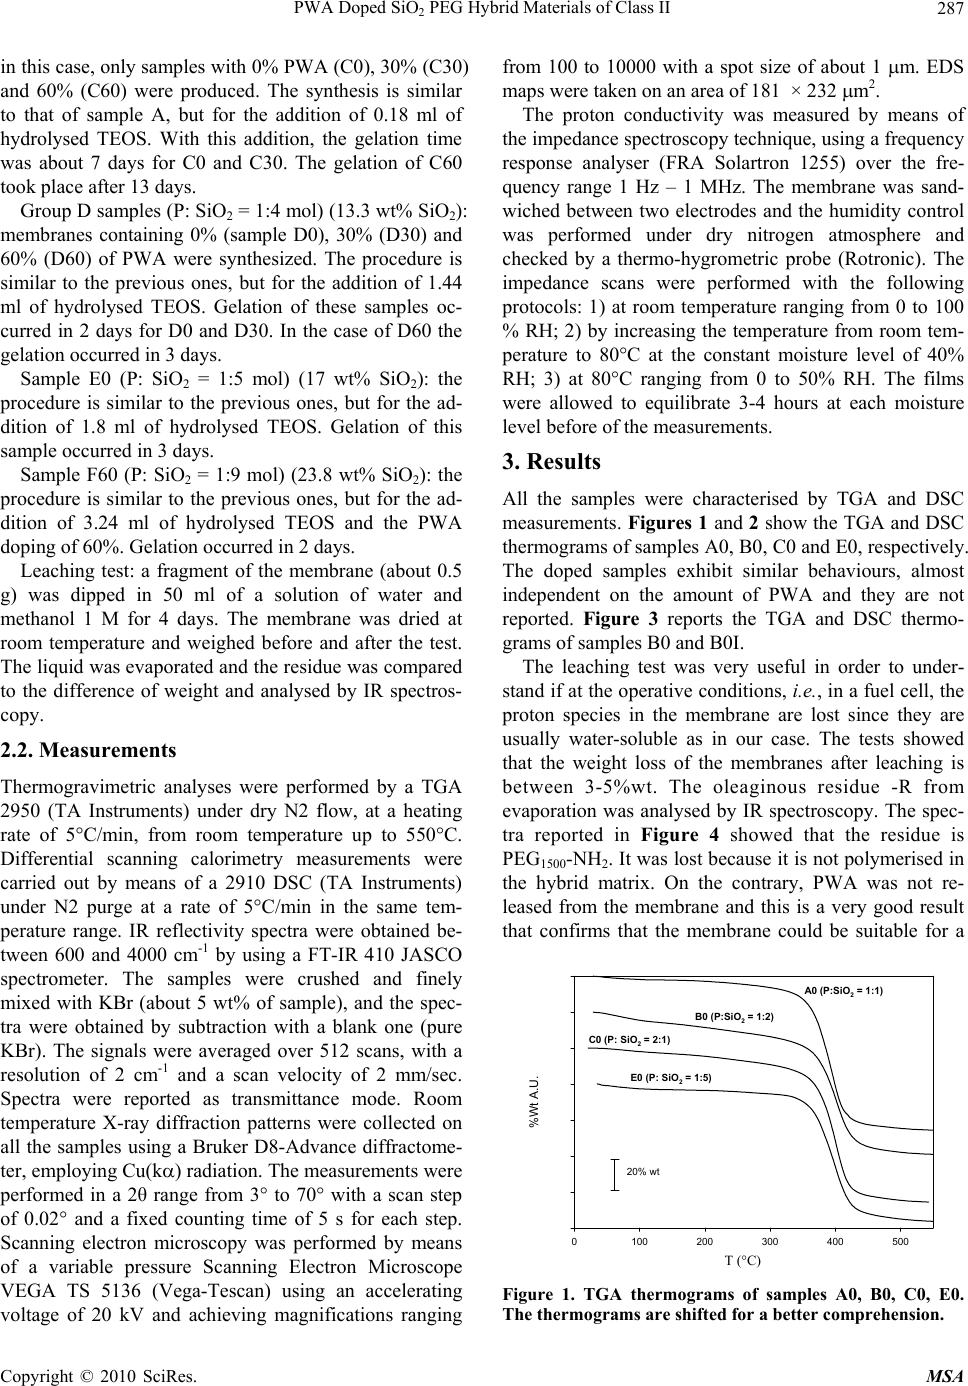 PWA Doped SiO2 PEG Hybrid Materials of Class II Copyright © 2010 SciRes. MSA 287 in this case, only samples with 0% PWA (C0), 30% (C30) and 60% (C60) were produced. The synthesis is similar to that of sample A, but for the addition of 0.18 ml of hydrolysed TEOS. With this addition, the gelation time was about 7 days for C0 and C30. The gelation of C60 took place after 13 days. Group D samples (P: SiO2 = 1:4 mol) (13.3 wt% SiO2): membranes containing 0% (sample D0), 30% (D30) and 60% (D60) of PWA were synthesized. The procedure is similar to the previous ones, but for the addition of 1.44 ml of hydrolysed TEOS. Gelation of these samples oc- curred in 2 days for D0 and D30. In the case of D60 the gelation occurred in 3 days. Sample E0 (P: SiO2 = 1:5 mol) (17 wt% SiO2): the procedure is similar to the previous ones, but for the ad- dition of 1.8 ml of hydrolysed TEOS. Gelation of this sample occurred in 3 days. Sample F60 (P: SiO2 = 1:9 mol) (23.8 wt% SiO2): the procedure is similar to the previous ones, but for the ad- dition of 3.24 ml of hydrolysed TEOS and the PWA doping of 60%. Gelation occurred in 2 days. Leaching test: a fragment of the membrane (about 0.5 g) was dipped in 50 ml of a solution of water and methanol 1 M for 4 days. The membrane was dried at room temperature and weighed before and after the test. The liquid was evaporated and the residue was compared to the difference of weight and analysed by IR spectros- copy. 2.2. Measurements Thermogravimetric analyses were performed by a TGA 2950 (TA Instruments) under dry N2 flow, at a heating rate of 5°C/min, from room temperature up to 550°C. Differential scanning calorimetry measurements were carried out by means of a 2910 DSC (TA Instruments) under N2 purge at a rate of 5°C/min in the same tem- perature range. IR reflectivity spectra were obtained be- tween 600 and 4000 cm-1 by using a FT-IR 410 JASCO spectrometer. The samples were crushed and finely mixed with KBr (about 5 wt% of sample), and the spec- tra were obtained by subtraction with a blank one (pure KBr). The signals were averaged over 512 scans, with a resolution of 2 cm-1 and a scan velocity of 2 mm/sec. Spectra were reported as transmittance mode. Room temperature X-ray diffraction patterns were collected on all the samples using a Bruker D8-Advance diffractome- ter, employing Cu(k) radiation. The measurements were performed in a 2θ range from 3° to 70° with a scan step of 0.02° and a fixed counting time of 5 s for each step. Scanning electron microscopy was performed by means of a variable pressure Scanning Electron Microscope VEGA TS 5136 (Vega-Tescan) using an accelerating voltage of 20 kV and achieving magnifications ranging from 100 to 10000 with a spot size of about 1 m. EDS maps were taken on an area of 181 × 232 m2. The proton conductivity was measured by means of the impedance spectroscopy technique, using a frequency response analyser (FRA Solartron 1255) over the fre- quency range 1 Hz – 1 MHz. The membrane was sand- wiched between two electrodes and the humidity control was performed under dry nitrogen atmosphere and checked by a thermo-hygrometric probe (Rotronic). The impedance scans were performed with the following protocols: 1) at room temperature ranging from 0 to 100 % RH; 2) by increasing the temperature from room tem- perature to 80°C at the constant moisture level of 40% RH; 3) at 80°C ranging from 0 to 50% RH. The films were allowed to equilibrate 3-4 hours at each moisture level before of the measurements. 3. Results All the samples were characterised by TGA and DSC measurements. Figures 1 and 2 show the TGA and DSC thermograms of samples A0, B0, C0 and E0, respectively. The doped samples exhibit similar behaviours, almost independent on the amount of PWA and they are not reported. Figure 3 reports the TGA and DSC thermo- grams of samples B0 and B0I. The leaching test was very useful in order to under- stand if at the operative conditions, i.e., in a fuel cell, the proton species in the membrane are lost since they are usually water-soluble as in our case. The tests showed that the weight loss of the membranes after leaching is between 3-5%wt. The oleaginous residue -R from evaporation was analysed by IR spectroscopy. The spec- tra reported in Figure 4 showed that the residue is PEG1500-NH2. It was lost because it is not polymerised in the hybrid matrix. On the contrary, PWA was not re- leased from the membrane and this is a very good result that confirms that the membrane could be suitable for a T ( ?C ) 0100 200 300 400 500 %Wt A.U. -20 0 20 40 60 80 100 120 A0 (P:SiO2 = 1:1) B0 (P:SiO2 = 1:2) C0 (P: SiO2 = 2:1) E0 (P: SiO2 = 1:5) 20% wt Figure 1. TGA thermograms of samples A0, B0, C0, E0. The thermograms are shifted for a better comprehension. T (°C) 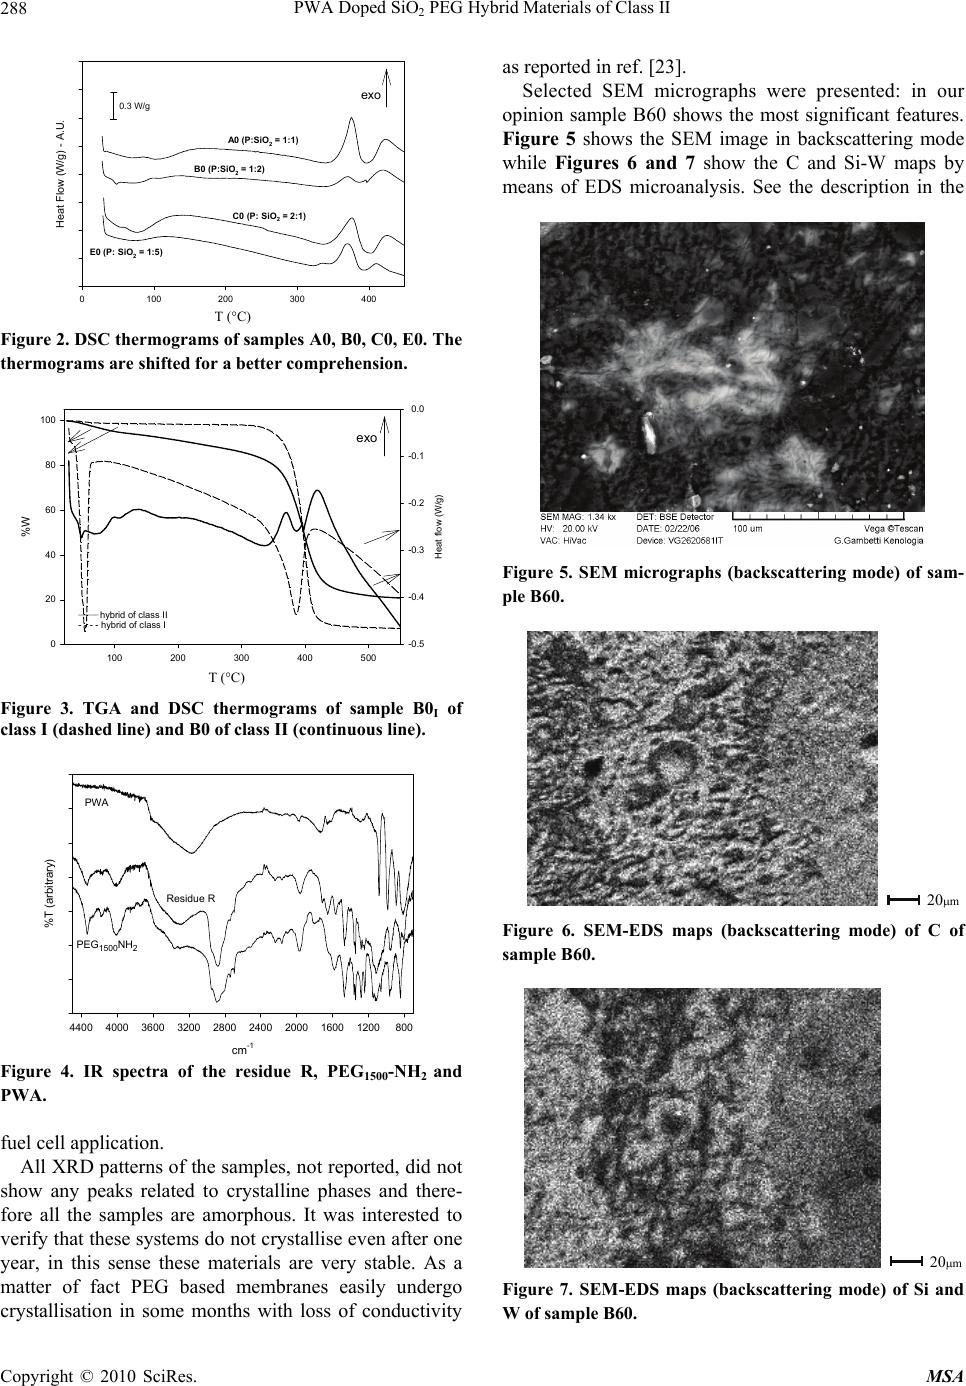 PWA Doped SiO2 PEG Hybrid Materials of Class II Copyright © 2010 SciRes. MSA 288 T (°C) 0100 200 300 400 Heat Flow (W/g) - A.U. A0 (P:SiO 2 = 1:1) B0 (P:SiO 2 = 1:2) C0 (P: SiO 2 = 2:1) E0 (P: SiO 2 = 1:5) 0.3 W/g exo Figure 2. DSC thermograms of samples A0, B0, C0, E0. The thermograms are shifted for a better comprehension. T (°C) 100 200 300 400 500 %W 0 20 40 60 80 100 Heat flow (W/g) -0.5 -0.4 -0.3 -0.2 -0.1 0.0 ______ hybrid of class II - - - - hybrid of class I exo Figure 3. TGA and DSC thermograms of sample B0I of class I (dashed line) and B0 of class II (continuous line). cm-1 800120016002000240028003200360040004400 %T (arbitrary) PWA PEG1500NH2 Residue R Figure 4. IR spectra of the residue R, PEG1500-NH2 and PWA. fuel cell application. All XRD patterns of the samples, not reported, did not show any peaks related to crystalline phases and there- fore all the samples are amorphous. It was interested to verify that these systems do not crystallise even after one year, in this sense these materials are very stable. As a matter of fact PEG based membranes easily undergo crystallisation in some months with loss of conductivity as reported in ref. [23]. Selected SEM micrographs were presented: in our opinion sample B60 shows the most significant features. Figure 5 shows the SEM image in backscattering mode while Figures 6 and 7 show the C and Si-W maps by means of EDS microanalysis. See the description in the Figure 5. SEM micrographs (backscattering mode) of sam- ple B60. 20m Figure 6. SEM-EDS maps (backscattering mode) of C of sample B60. 20m Figure 7. SEM-EDS maps (backscattering mode) of Si and W of sample B60. T (°C) T (°C) 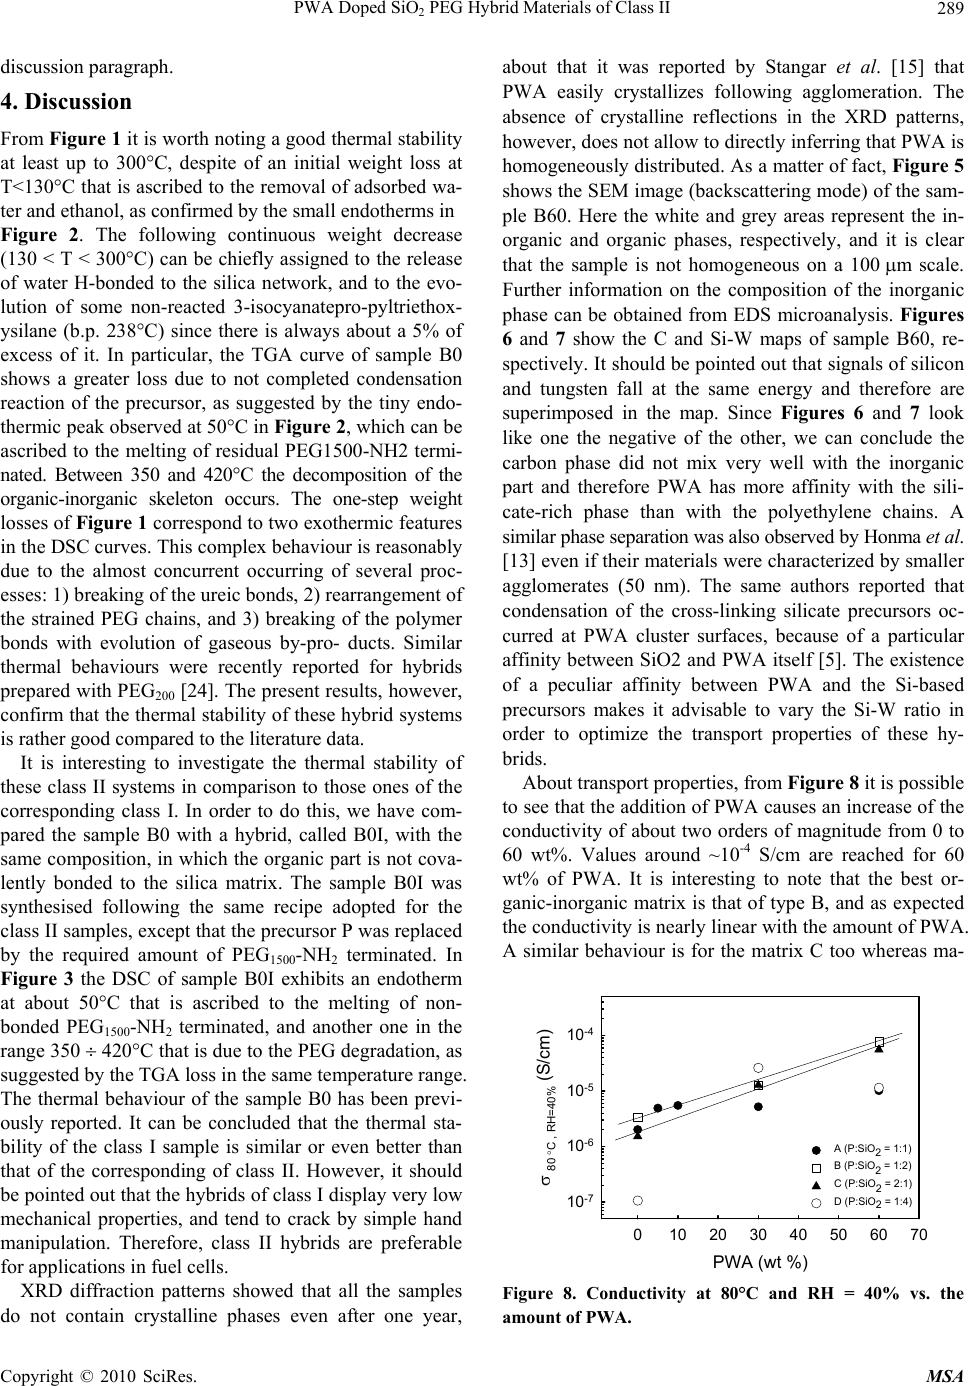 PWA Doped SiO2 PEG Hybrid Materials of Class II Copyright © 2010 SciRes. MSA 289 discussion paragraph. 4. Discussion From Figure 1 it is worth noting a good thermal stability at least up to 300°C, despite of an initial weight loss at T<130°C that is ascribed to the removal of adsorbed wa- ter and ethanol, as confirmed by the small endotherms in Figure 2. The following continuous weight decrease (130 < T < 300°C) can be chiefly assigned to the release of water H-bonded to the silica network, and to the evo- lution of some non-reacted 3-isocyanatepro-pyltriethox- ysilane (b.p. 238°C) since there is always about a 5% of excess of it. In particular, the TGA curve of sample B0 shows a greater loss due to not completed condensation reaction of the precursor, as suggested by the tiny endo- thermic peak observed at 50°C in Figure 2, which can be ascribed to the melting of residual PEG1500-NH2 termi- nated. Between 350 and 420°C the decomposition of the organic-inorganic skeleton occurs. The one-step weight losses of Figure 1 correspond to two exothermic features in the DSC curves. This complex behaviour is reasonably due to the almost concurrent occurring of several proc- esses: 1) breaking of the ureic bonds, 2) rearrangement of the strained PEG chains, and 3) breaking of the polymer bonds with evolution of gaseous by-pro- ducts. Similar thermal behaviours were recently reported for hybrids prepared with PEG200 [24]. The present results, however, confirm that the thermal stability of these hybrid systems is rather good compared to the literature data. It is interesting to investigate the thermal stability of these class II systems in comparison to those ones of the corresponding class I. In order to do this, we have com- pared the sample B0 with a hybrid, called B0I, with the same composition, in which the organic part is not cova- lently bonded to the silica matrix. The sample B0I was synthesised following the same recipe adopted for the class II samples, except that the precursor P was replaced by the required amount of PEG1500-NH2 terminated. In Figure 3 the DSC of sample B0I exhibits an endotherm at about 50°C that is ascribed to the melting of non- bonded PEG1500-NH2 terminated, and another one in the range 350 420°C that is due to the PEG degradation, as suggested by the TGA loss in the same temperature range. The thermal behaviour of the sample B0 has been previ- ously reported. It can be concluded that the thermal sta- bility of the class I sample is similar or even better than that of the corresponding of class II. However, it should be pointed out that the hybrids of class I display very low mechanical properties, and tend to crack by simple hand manipulation. Therefore, class II hybrids are preferable for applications in fuel cells. XRD diffraction patterns showed that all the samples do not contain crystalline phases even after one year, about that it was reported by Stangar et al. [15] that PWA easily crystallizes following agglomeration. The absence of crystalline reflections in the XRD patterns, however, does not allow to directly inferring that PWA is homogeneously distributed. As a matter of fact, Figure 5 shows the SEM image (backscattering mode) of the sam- ple B60. Here the white and grey areas represent the in- organic and organic phases, respectively, and it is clear that the sample is not homogeneous on a 100 m scale. Further information on the composition of the inorganic phase can be obtained from EDS microanalysis. Figures 6 and 7 show the C and Si-W maps of sample B60, re- spectively. It should be pointed out that signals of silicon and tungsten fall at the same energy and therefore are superimposed in the map. Since Figures 6 and 7 look like one the negative of the other, we can conclude the carbon phase did not mix very well with the inorganic part and therefore PWA has more affinity with the sili- cate-rich phase than with the polyethylene chains. A similar phase separation was also observed by Honma et al. [13] even if their materials were characterized by smaller agglomerates (50 nm). The same authors reported that condensation of the cross-linking silicate precursors oc- curred at PWA cluster surfaces, because of a particular affinity between SiO2 and PWA itself [5]. The existence of a peculiar affinity between PWA and the Si-based precursors makes it advisable to vary the Si-W ratio in order to optimize the transport properties of these hy- brids. About transport properties, from Figure 8 it is possible to see that the addition of PWA causes an increase of the conductivity of about two orders of magnitude from 0 to 60 wt%. Values around ~10-4 S/cm are reached for 60 wt% of PWA. It is interesting to note that the best or- ganic-inorganic matrix is that of type B, and as expected the conductivity is nearly linear with the amount of PWA. A similar behaviour is for the matrix C too whereas ma- PWA (wt %) 0 10203040506070 80 C , RH=40% (S/cm) 10-7 10-6 10-5 10-4 A (P:SiO2 = 1:1) B (P:SiO2 = 1:2) C (P:SiO2 = 2:1) D (P:SiO2 = 1:4) Figure 8. Conductivity at 80°C and RH = 40% vs. the amount of PWA.  PWA Doped SiO2 PEG Hybrid Materials of Class II Copyright © 2010 SciRes. MSA 290 trices of type A and D do not have such a trend. There- fore the amount of SiO2 into the matrix, i.e., the ratio P: SiO2, has a not linear effect on the conductivity at a given PWA content. This point will be further addressed in the following. In the Figure 9 is it possible to see that the conductivity increases of one or two orders of mag- nitude when the RH changes from 0 to 50%, reaching values of ~10-4 S/cm at RH = 50% in the case of the sam- ple B60 (P:SiO2 = 1:2). As already stated the best sam- ples are B60 and C60 (P:SiO2 = 2:1), while raising the amount of silica, sample D (P:SiO2 = 1:4) and sample F (P:SiO2 = 1:9) do not improve the conductivity. An ex- ception to the general trend of conductivity increase is given by sample A60 (P:SiO2 = 1:1) that should have an intermediate behaviour between samples B60 and C60 but on the contrary it is characterized by a very small slope on the conductivity values vs. RH%. In order to detect the influence of the silica content on the conductivity the Figure 10 is pregnant. From the analysis of this Figure 10, it is not possible to detect a common trend. The conductivity of the membranes with 0 and 30 wt% of PWA does not seem to be remarkably affected by the silica content. In contrast, in the case of RH% 0 102030405060 s80癈 (S cm-1) 10-6 10-5 10-4 A60 B60 C60 D60 F60 Figure 9. Conductivity at 80°C vs. RH% of samples A60- B60-C60-D60-F60. SiO2 (wt%) 0510 15 20 25 30 s80癈 (S/cm) 1e-8 1e-7 1e-6 1e-5 1e-4 1e-3 60 %PWA 30 % PWA 0 wt% PWA Figure 10. Plots of the conductivity behaviour at 80°C and RH = 40% as a function of the SiO2 content for samples A0,A30,A60, series B,C, D and samples E0 and F60. the sample with the highest PWA concentration, a drop in conductivity is observed above 13 wt% of SiO2. This can be due to a dilution effect (if considering SiO2 as the less conductive species) as it happens in Li-based com- posite membranes [25], or to the formation of more Si-rich agglomerates, as probed by the SEM analysis previously discussed. About the last group of results (Figure 11) it is possi- ble to verify that the samples display a reasonable Arrhe- nian behaviour in the explored temperature range, from which it has been possible to extract the activation ener- gies, Ea, for the proton conductivity. The activation en- ergies of the most promising matrices (A,B and C) vs. PWA content are reported in Figure 12. A non-linear behaviour of Ea vs. the PWA content is clearly seen, with a minimum for 30 wt%. It also seems that the addition of silica determines a decrease of the activation energies (compare series 1:2 and 2:1) and again, series B seems to be the best candi- date for a fuel cell application. 5. Conclusions Thermally stable hybrid membranes of class II were ob- 1/T (103 K-1) 2.6 2.8 3.0 3.2 3.4 3.6 s (S cm-1) 10-6 10-5 10-4 B60 A60 C60 Figure 11. Arrhenius plots of samples A60 and B60 at 40 RH%. PWA (wt%) 0 10203040506070 Ea (eV) 0.2 0.3 0.4 0.5 0.6 A (P:SiO2 1:1) B (P:SiO2 1:2) C (P:SiO2 2:1) Figure 12. activation energies vs. PWA content for series A,B and C.  PWA Doped SiO2 PEG Hybrid Materials of Class II Copyright © 2010 SciRes. MSA 291 tained by means of a sol-gel route also for high PWA doping. The membrane proton conductivity depends on both the humidity and the PWA content. From this study it seems there is not a marked influence of the amount of silica in these systems, however it is not advisable to exceed the 13% wt of SiO2 in the hybrid matrices be- cause there is a drop in conductivity. The main perspec- tive at the moment is to set up particular equipments to perform conductivity measurements at higher tempera- tures and humidity in order to check whether these mate- rials are real candidates for PEMFC applications. REFERENCES [1] J. D. Wright and N. A. J. M. Sommerdijk, “Sol-Gel Ma- terials: Chemistry and Applications,” The Netherlands Gordon and Breach Science Publishers, Amsterdam, 2001. [2] J. E. Mark, “The Sol-Gel Route to Inorganic—Organic Composites,” Heterogenous Chemical Reviews, Vol. 3, 1996, pp. 307-326. [3] I. Honma, S. Hirakawa, K. Yamada and J. M. Bae, Solid State Ionics, Vol. 118, No. 1, 1999, pp. 29-36. [4] I. Honma, Y. Takeda and J. M. Bae, Solid State Ionics, Vol. 120, 1999, pp. 255-264. [5] I. Honma, S. Nomura and H. Nakajima, Journal of Mem- brane Science, Vol. 185, 2001, pp. 83. [6] H. Y. Chang and C. W. Lin, Journal of Membrane Sci- ence, Vol. 218, 2003, pp. 295. [7] C. W. Lin, R. Thangamuthu and P. H. Chang, Journal of Membrane Science, Vol. 254, 2005, pp. 197. [8] R. Thangamuthu and C. W. Lin, J. of Power Sources, Vol. 150, 2005, pp. 48. [9] O. Nakamura, T. Kodama, I. Ogino and Y. Miyake, Chem. Lett., Vol. 1, 1979, pp. 17. [10] I. Honma, H. Nakajima and S. Nomura, Solid State Ionics, Vol. 707, 2002, pp. 154. [11] H. Nakajima, S. Nomura, T. Sugimoto, S. Nishikawa and I. Honma, Journal of the Electrochemical Society, Vol. 149, No. 8, 2002, pp. A953. [12] I. Honma, O. Nishikawa, T. Sugimoto, S. Nomura and H. Nakajima, Fuel Cells, Vol. 2, No. 1, 2002, pp. 52 [13] I. Honma, H. Nakajima, O. Nishikawa, T. Sugimoto and S. Nomura, Solid State Ionics, Vol. 237, 2003,162. [14] U. L. Stangar, N. Groselj, B. Orel and P. Colomban, Chem Mater, Vol. 12, 2000, pp. 3745. [15] U. L. Stangar, N. Groselj, B. Orel, A. Schmitz and P. Colomban, Solid State Ionics, Vol. 145, 2001, pp. 109. [16] U. L. Stangar, B. Orel, J. Vince, V. Jovanovski, H. Spreizer, A. Surca Vuk and S. Hocevar, J. Solid State Electrochem., Vol. 9, 2005, pp. 106. [17] K. Tadanaga, H. Yoshida, A. Matsuda, T. Minami and M. Tatsumisago, Chem. Mater., Vol. 15, 2003, pp. 1910. [18] S. J. Huang, H. K. Lee, Y. S. Lee and W. H. Kang, J. Am. Ceram. Soc., Vol. 88, No. 12, 2005, pp. 3427. [19] G. Lakshminarayana and M. Nogami, J. Phys. Chem. C, Vol. 113, 2009, pp. 14550. [20] G. Lakshminarayana and M. Nogami, Electrochimica Acta, Vol. 54, 2009, pp. 4731. [21] R. H. Nagarale, G. S. Gohil, V. K. Shahi and R. Rangarajan, Macromolecules, Vol. 37, 2004, pp. 10023. [22] V. V. Binsu, R. K. Nagarale and V. K. Shahi, J. Mater. Chem., Vol. 15, 2005, pp. 4823. [23] L. M. Bronstein, C. Joo, R. Karlinsey, A. Ryder and J. W. Zwanziger, Chem. Mater., Vol. 13, 2001, pp. 3678. [24] S. Grandi, A. Magistris, P. Mustarelli, E. Quartarone, C. Tomasi and L. Meda, J. Non-Cryst. Solids, Vol. 352, 2006, pp. 273. [25] E. Quartarone, P. Mustarelli and A. Magistris, Solid State Ionics, Vol. 110, 1998, pp. 1. |