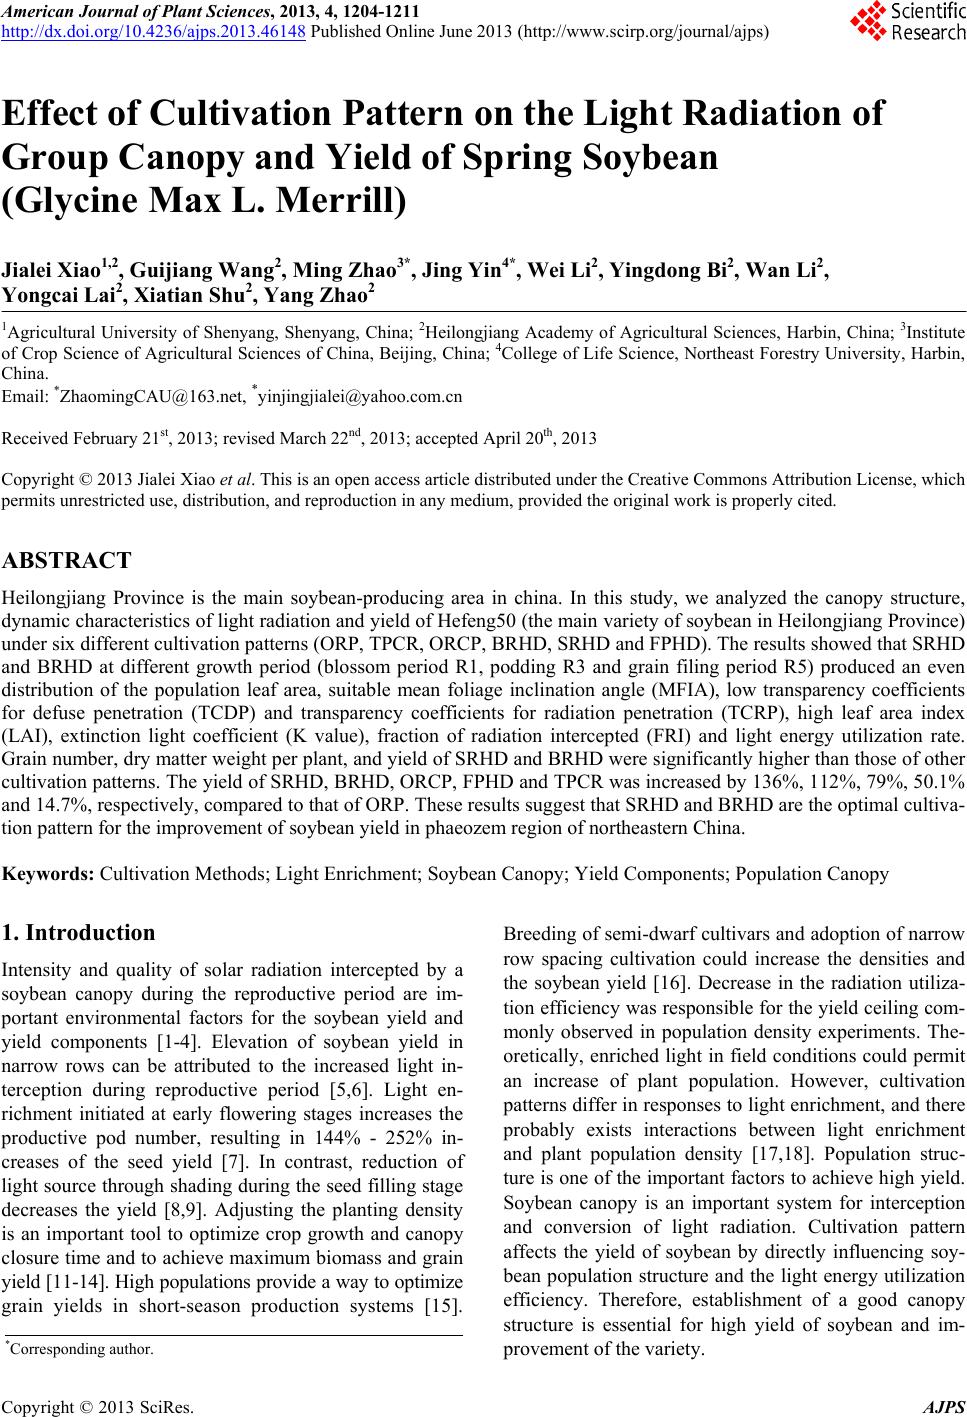
 American Journal of Plant Sciences, 2013, 4, 1204-1211 http://dx.doi.org/10.4236/ajps.2013.46148 Published Online June 2013 (http://www.scirp.org/journal/ajps) Effect of Cultivation Pattern on the Light Radiation of Group Canopy and Yield of Spring Soybean (Glycine Max L. Merrill) Jialei Xiao1,2, Guijiang Wang2, Ming Zhao3*, Jing Yin4*, Wei Li2, Yingdong Bi2, Wan Li2, Yongcai Lai2, Xiatian Shu2, Yang Zhao2 1Agricultural University of Shenyang, Shenyang, China; 2Heilongjiang Academy of Agricultural Sciences, Harbin, China; 3Institute of Crop Science of Agricultural Sciences of China, Beijing, China; 4College of Life Science, Northeast Forestry University, Harbin, China. Email: *ZhaomingCAU@163.net, *yinjingjialei@yahoo.com.cn Received February 21st, 2013; revised March 22nd, 2013; accepted April 20th, 2013 Copyright © 2013 Jialei Xiao et al. This is an open access article distributed under the Creative Commons Attribution License, which permits unrestricted use, distribution, and reproduction in any medium, provided the original work is properly cited. ABSTRACT Heilongjiang Province is the main soybean-producing area in china. In this study, we analyzed the canopy structure, dynamic characteristics of light radiation and yield of Hefeng50 (the main variety of soybean in Heilongjiang Province) under six different cultivation patterns (ORP, TPCR, ORCP, BRHD, SRHD and FPHD). The results showed that SRHD and BRHD at different growth period (blossom period R1, podding R3 and grain filing period R5) produced an even distribution of the population leaf area, suitable mean foliage inclination angle (MFIA), low transparency coefficients for defuse penetration (TCDP) and transparency coefficients for radiation penetration (TCRP), high leaf area index (LAI), extinction light coefficient (K value), fraction of radiation intercepted (FRI) and light energy utilization rate. Grain number, dry matter weight per plant, and yield of SRHD and BRHD were significantly higher than those of other cultivation patterns. The yield of SRHD, BRHD, ORCP, FPHD and TPCR was increased by 136%, 112%, 79%, 50.1% and 14.7%, respectively, compared to that of ORP. These results suggest that SRHD and BRHD are the optimal cultiva- tion pattern for the improvement of soybean yield in phaeozem region of northeastern China. Keywords: Cultivation Methods; Light Enrichment; Soybean Canopy; Yield Components; Population Canopy 1. Introduction Intensity and quality of solar radiation intercepted by a soybean canopy during the reproductive period are im- portant environmental factors for the soybean yield and yield components [1-4]. Elevation of soybean yield in narrow rows can be attributed to the increased light in- terception during reproductive period [5,6]. Light en- richment initiated at early flowering stages increases the productive pod number, resulting in 144% - 252% in- creases of the seed yield [7]. In contrast, reduction of light source through shading during the seed filling stage decreases the yield [8,9]. Adjusting the planting density is an important tool to optimize crop growth and canopy closure time and to achieve maximum biomass and grain yield [11-14]. High populations provide a way to optimize grain yields in short-season production systems [15]. Breeding of semi-dwarf cultivars and adoption of narrow row spacing cultivation could increase the densities and the soybean yield [16]. Decrease in the radiation utiliza- tion efficiency was responsible for the yield ceiling com- monly observed in population density experiments. The- oretically, enriched light in field conditions could permit an increase of plant population. However, cultivation patterns differ in responses to light enrichment, and there probably exists interactions between light enrichment and plant population density [17,18]. Population struc- ture is one of the important factors to achieve high yield. Soybean canopy is an important system for interception and conversion of light radiation. Cultivation pattern affects the yield of soybean by directly influencing soy- bean population structure and the light energy utilization efficiency. Therefore, establishment of a good canopy structure is essential for high yield of soybean and im- provement of the variety. *Corresponding author. Copyright © 2013 SciRes. AJPS 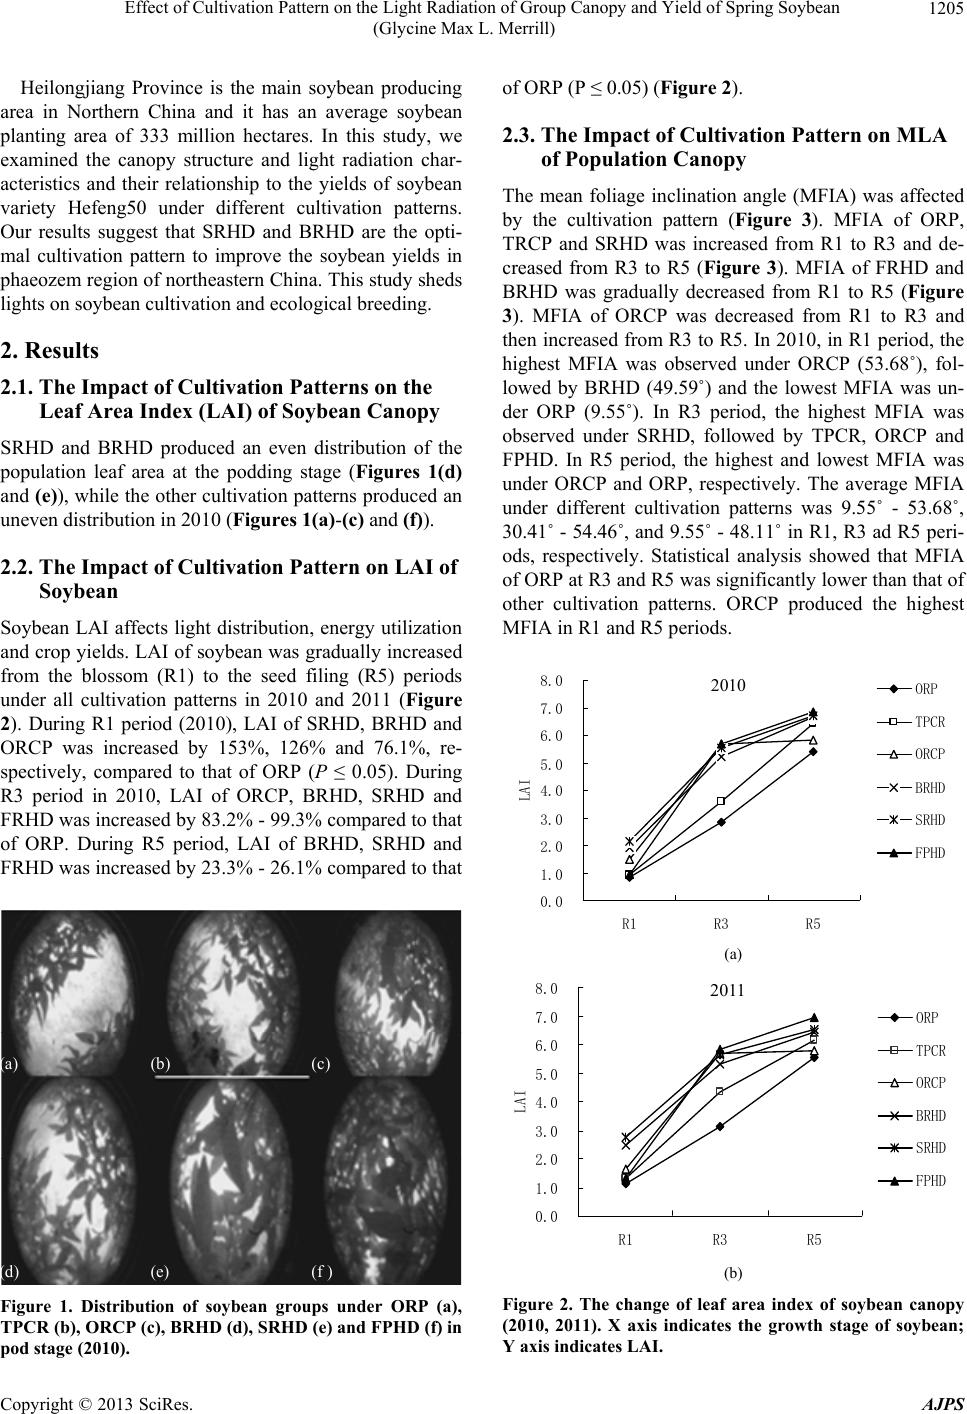 Effect of Cultivation Pattern on the Light Radiation of Group Canopy and Yield of Spring Soybean (Glycine Max L. Merrill) 1205 Heilongjiang Province is the main soybean producing area in Northern China and it has an average soybean planting area of 333 million hectares. In this study, we examined the canopy structure and light radiation char- acteristics and their relationship to the yields of soybean variety Hefeng50 under different cultivation patterns. Our results suggest that SRHD and BRHD are the opti- mal cultivation pattern to improve the soybean yields in phaeozem region of northeastern China. This study sheds lights on soybean cultivation and ecological breeding. 2. Results 2.1. The Impact of Cultivation Patterns on the Leaf Area Index (LAI) of Soybean Canopy SRHD and BRHD produced an even distribution of the population leaf area at the podding stage (Figures 1(d) and (e)), while the other cultivation patterns produced an uneven distribution in 2010 (Figures 1(a)-(c) and (f)). 2.2. The Impact of Cultivation Pattern on LAI of Soybean Soybean LAI affects light distribution, energy utilization and crop yields. LAI of soybean was gradually increased from the blossom (R1) to the seed filing (R5) periods under all cultivation patterns in 2010 and 2011 (Figure 2). During R1 period (2010), LAI of SRHD, BRHD and ORCP was increased by 153%, 126% and 76.1%, re- spectively, compared to that of ORP (P ≤ 0.05). During R3 period in 2010, LAI of ORCP, BRHD, SRHD and FRHD was increased by 83.2% - 99.3% compared to that of ORP. During R5 period, LAI of BRHD, SRHD and FRHD was increased by 23.3% - 26.1% compared to that a) d) ( ) (e) (c) (f ) Figure 1. Distribution of soybean groups under ORP (a), TPCR (b), ORCP (c), BRHD (d), SRHD (e) and FPHD (f) in pod stage (2010). of ORP (P ≤ 0.05) (Figure 2). 2.3. The Impact of Cultivation Pattern on MLA of Population Canopy The mean foliage inclination angle (MFIA) was affected by the cultivation pattern (Figure 3). MFIA of ORP, TRCP and SRHD was increased from R1 to R3 and de- creased from R3 to R5 (Figure 3). MFIA of FRHD and BRHD was gradually decreased from R1 to R5 (Figure 3). MFIA of ORCP was decreased from R1 to R3 and then increased from R3 to R5. In 2010, in R1 period, the highest MFIA was observed under ORCP (53.68˚), fol- lowed by BRHD (49.59˚) and the lowest MFIA was un- der ORP (9.55˚). In R3 period, the highest MFIA was observed under SRHD, followed by TPCR, ORCP and FPHD. In R5 period, the highest and lowest MFIA was under ORCP and ORP, respectively. The average MFIA under different cultivation patterns was 9.55˚ - 53.68˚, 30.41˚ - 54.46˚, and 9.55˚ - 48.11˚ in R1, R3 ad R5 peri- ods, respectively. Statistical analysis showed that MFIA of ORP at R3 and R5 was significantly lower than that of other cultivation patterns. ORCP produced the highest MFIA in R1 and R5 periods. 0.0 1.0 2.0 3.0 4.0 5.0 6.0 7.0 8.0 R1 R3 R5 LAI ORP TPCR ORCP BRHD SRHD FPHD 2010 (a) 0.0 1.0 2.0 3.0 4.0 5.0 6.0 7.0 8.0 R1 R3 R5 LAI ORP TPCR ORCP BRHD SRHD FPHD 2011 (b) Figure 2. The change of leaf area index of soybean canopy (2010, 2011). X axis indicates the growth stage of soybean; Y axis indicates LAI. Copyright © 2013 SciRes. AJPS 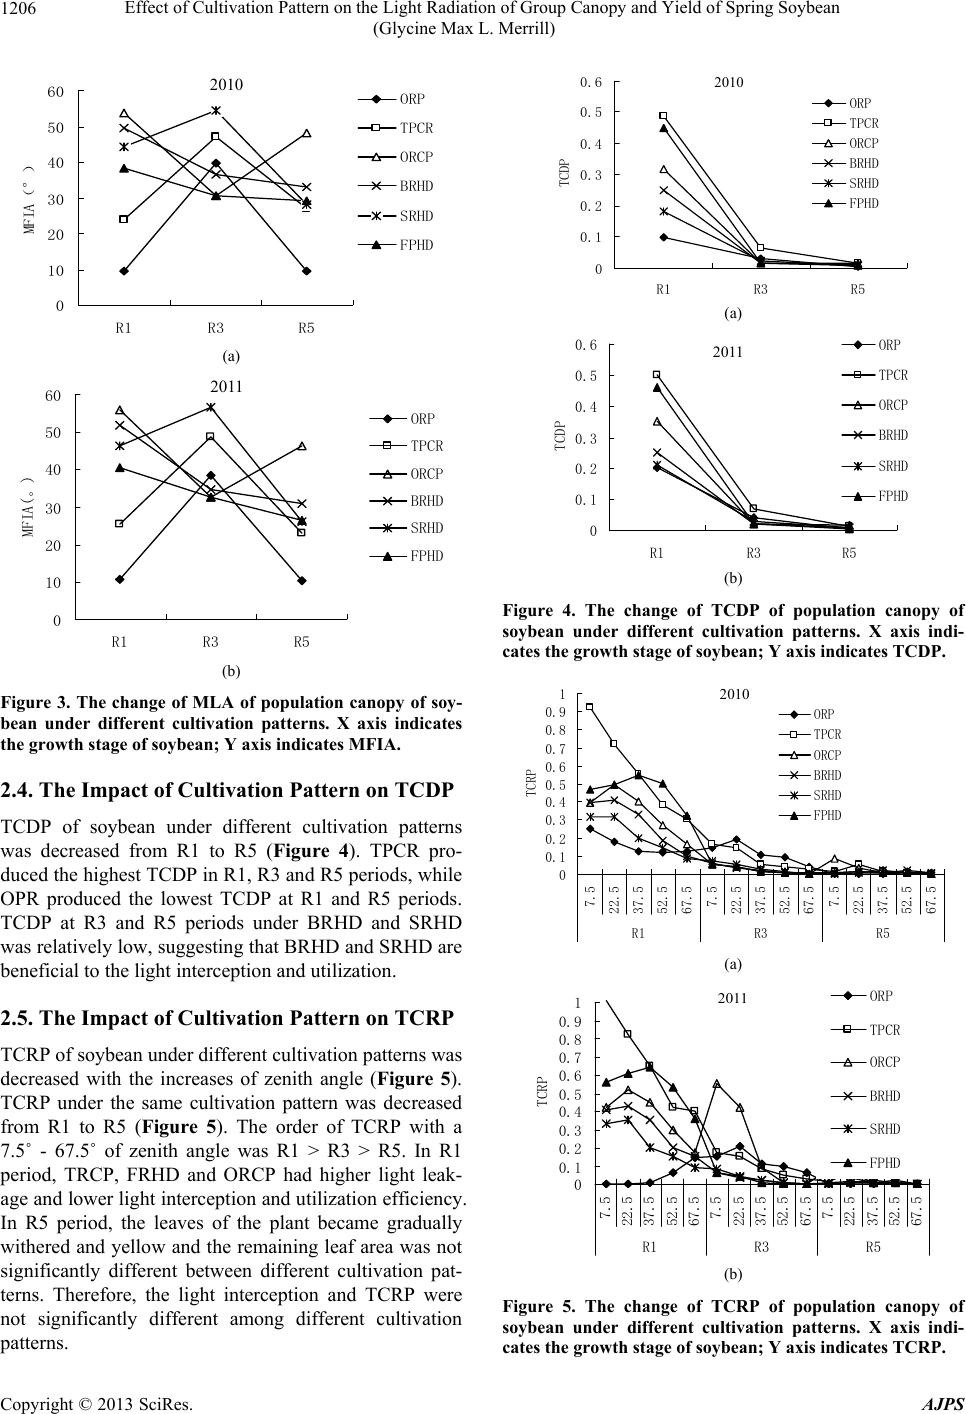 Effect of Cultivation Pattern on the Light Radiation of Group Canopy and Yield of Spring Soybean (Glycine Max L. Merrill) 1206 0 10 20 30 40 50 60 R1R3 R5 MFIA(°) ORP TPCR ORCP BRHD SRHD FPHD 2010 (a) 0 10 20 30 40 50 60 R1 R3 R5 MFIA(。) ORP TPCR ORCP BRHD SRHD FPHD 2011 (b) Figure 3. The change of MLA of population canopy of soy- bean under different cultivation patterns. X axis indicates the growth stage of soybean; Y axis indicates MFIA. 2.4. The Impact of Cultivation Pattern on TCDP TCDP of soybean under different cultivation patterns was decreased from R1 to R5 (Figure 4). TPCR pro- duced the highest TCDP in R1, R3 and R5 periods, while OPR produced the lowest TCDP at R1 and R5 periods. TCDP at R3 and R5 periods under BRHD and SRHD was relatively low, suggesting that BRHD and SRHD are beneficial to the light interception and utilization. 2.5. The Impact of Cultivation Pattern on TCRP TCRP of soybean under different cultivation patterns was decreased with the increases of zenith angle (Figure 5). TCRP under the same cultivation pattern was decreased from R1 to R5 (Figure 5). The order of TCRP with a 7.5˚ - 67.5˚ of zenith angle was R1 > R3 > R5. In R1 period, TRCP, FRHD and ORCP had higher light leak- age and lower light interception and utilization efficiency. In R5 period, the leaves of the plant became gradually withered and yellow and the remaining leaf area was not significantly different between different cultivation pat- terns. Therefore, the light interception and TCRP were not significantly different among different cultivation patterns. 0 0.1 0.2 0.3 0.4 0.5 0.6 R1 R3 R5 TCDP ORP TPCR ORCP BRHD SRHD FPHD 2010 (a) 0 0.1 0.2 0.3 0.4 0.5 0.6 R1R3 R5 TCDP ORP TPCR ORCP BRHD SRHD FPHD 2011 (b) Figure 4. The change of TCDP of population canopy of soybean under different cultivation patterns. X axis indi- cates the growth stage of soybean; Y axis indicates TCDP. 0 0.1 0.2 0.3 0.4 0.5 0.6 0.7 0.8 0.9 1 7.5 22.5 37.5 52.5 67.5 7.5 22.5 37.5 52.5 67.5 7.5 22.5 37.5 52.5 67.5 R1 R3 R5 TCRP ORP TPCR ORCP BRHD SRHD FPHD 2010 (a) 0 0.1 0.2 0.3 0.4 0.5 0.6 0.7 0.8 0.9 1 7.5 22.5 37.5 52.5 67.5 7.5 22.5 37.5 52.5 67.5 7.5 22.5 37.5 52.5 67.5 R1 R3 R5 TCRP ORP TPCR ORCP BRHD SRHD FPHD 2011 (b) Figure 5. The change of TCRP of population canopy of soybean under different cultivation patterns. X axis indi- cates the growth stage of soybean; Y axis indicates TCRP. Copyright © 2013 SciRes. AJPS 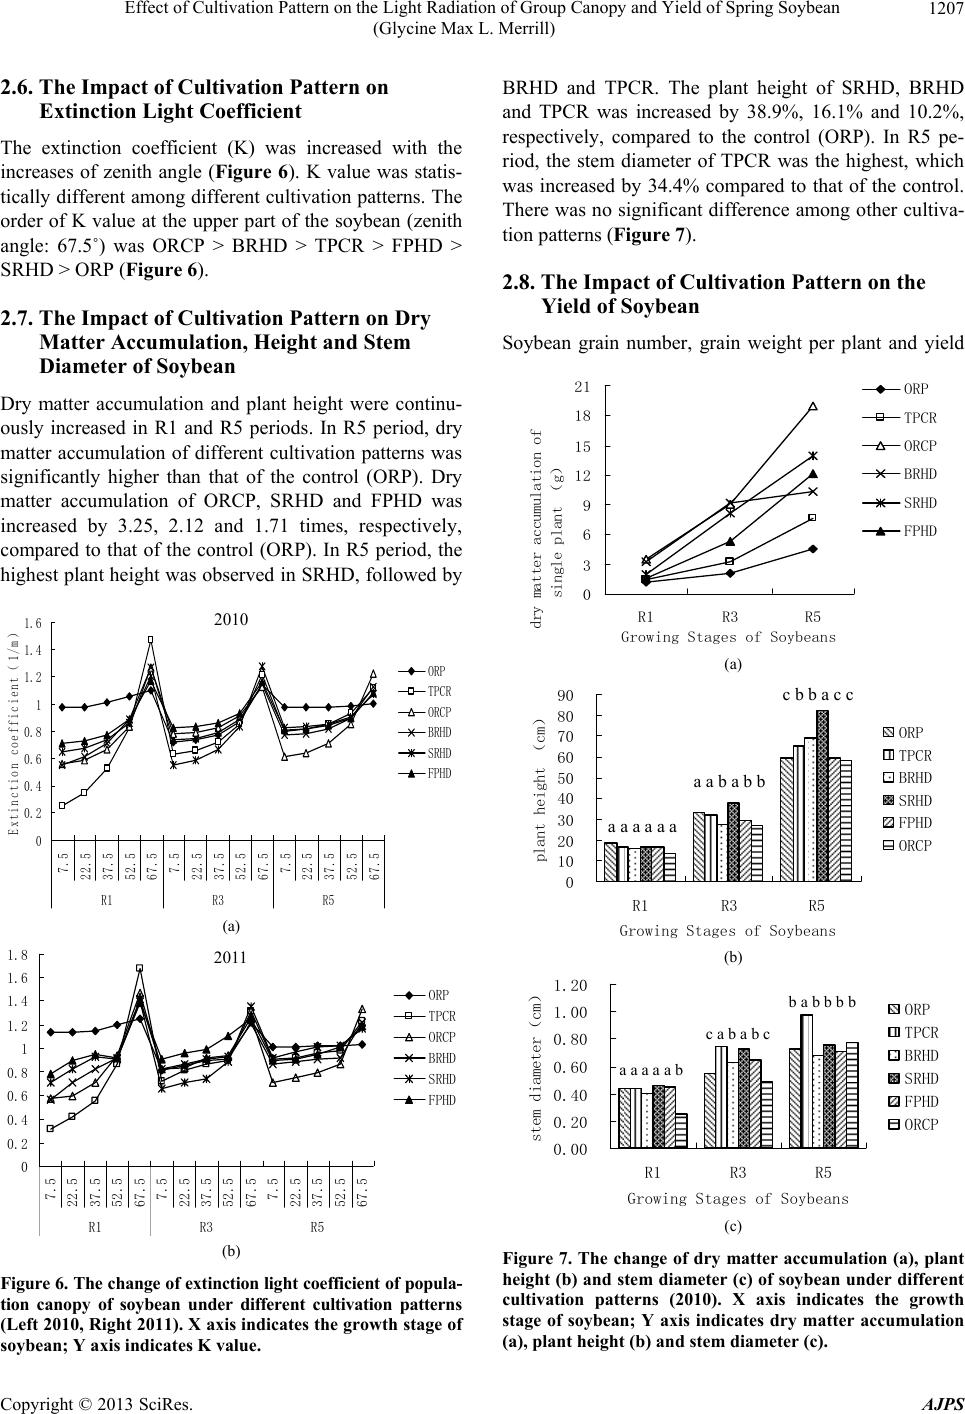 Effect of Cultivation Pattern on the Light Radiation of Group Canopy and Yield of Spring Soybean (Glycine Max L. Merrill) 1207 2.6. The Impact of Cultivation Pattern on Extinction Light Coefficient The extinction coefficient (K) was increased with the increases of zenith angle (Figure 6). K value was statis- tically different among different cultivation patterns. The order of K value at the upper part of the soybean (zenith angle: 67.5˚) was ORCP > BRHD > TPCR > FPHD > SRHD > ORP (Figure 6). 2.7. The Impact of Cultivation Pattern on Dry Matter Accumulation, Height and Stem Diameter of Soybean Dry matter accumulation and plant height were continu- ously increased in R1 and R5 periods. In R5 period, dry matter accumulation of different cultivation patterns was significantly higher than that of the control (ORP). Dry matter accumulation of ORCP, SRHD and FPHD was increased by 3.25, 2.12 and 1.71 times, respectively, compared to that of the control (ORP). In R5 period, the highest plant height was observed in SRHD, followed by 0 0.2 0.4 0.6 0.8 1 1.2 1.4 1.6 7.5 22.5 37.5 52.5 67.5 7.5 22.5 37.5 52.5 67.5 7.5 22.5 37.5 52.5 67.5 R1R3 R5 Extinction coefficient(1/m) ORP TPCR ORCP BRHD SRHD FPHD 2010 (a) 0 0.2 0.4 0.6 0.8 1 1.2 1.4 1.6 1.8 7.5 22.5 37.5 52.5 67.5 7.5 22.5 37.5 52.5 67.5 7.5 22.5 37.5 52.5 67.5 R1 R3 R5 ORP TPCR ORCP BRHD SRHD FPHD 2011 (b) Figure 6. The change of extinction light coefficient of popula- tion canopy of soybean under different cultivation patterns (Left 2010, Right 2011). X axis indicates the growth stage of soybean; Y axis indicates K value. BRHD and TPCR. The plant height of SRHD, BRHD and TPCR was increased by 38.9%, 16.1% and 10.2%, respectively, compared to the control (ORP). In R5 pe- riod, the stem diameter of TPCR was the highest, which was increased by 34.4% compared to that of the control. There was no significant difference among other cultiva- tion patterns (Figure 7). 2.8. The Impact of Cultivation Pattern on the Yield of Soybean Soybean grain number, grain weight per plant and yield 0 3 6 9 12 15 18 21 R1R3 R5 Growing Stages of Soybeans dry matter accumulation of single plant (g) ORP TPCR ORCP BRHD SRHD FPHD (a) 0 10 20 30 40 50 60 70 80 90 R1R3 R5 Growing Stages of Soybeans plant height (cm) ORP TPCR BRHD SRHD FPHD ORCP a a a a a a a a b a b b c b b a c c (b) 0.00 0.20 0.40 0.60 0.80 1.00 1.20 R1 R3 R5 Growing Stages of Soybeans stem diameter(cm) ORP TPCR BRHD SRHD FPHD ORCP a a a a a b c a b a b c b a b b b b (c) Figure 7. The change of dry matter accumulation (a), plant height (b) and stem diameter (c) of soybe an under different cultivation patterns (2010). X axis indicates the growth stage of soybean; Y axis indicates dry matter accumulation (a), plant height (b) and stem diameter (c). Copyright © 2013 SciRes. AJPS 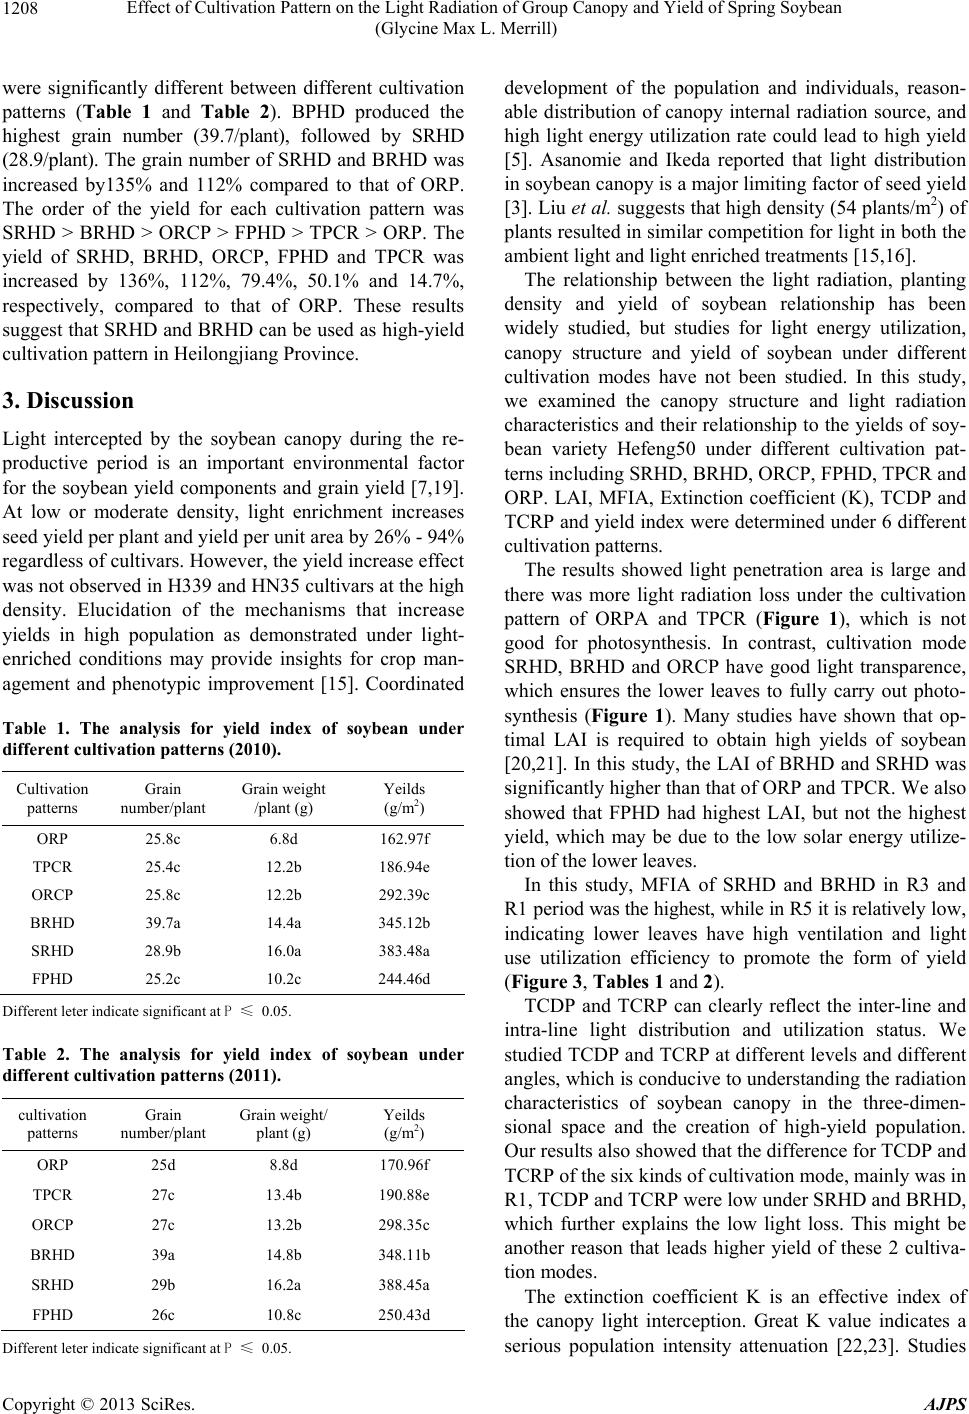 Effect of Cultivation Pattern on the Light Radiation of Group Canopy and Yield of Spring Soybean (Glycine Max L. Merrill) 1208 were significantly different between different cultivation patterns (Table 1 and Table 2). BPHD produced the highest grain number (39.7/plant), followed by SRHD (28.9/plant). The grain number of SRHD and BRHD was increased by135% and 112% compared to that of ORP. The order of the yield for each cultivation pattern was SRHD > BRHD > ORCP > FPHD > TPCR > ORP. The yield of SRHD, BRHD, ORCP, FPHD and TPCR was increased by 136%, 112%, 79.4%, 50.1% and 14.7%, respectively, compared to that of ORP. These results suggest that SRHD and BRHD can be used as high-yield cultivation pattern in Heilongjiang Province. 3. Discussion Light intercepted by the soybean canopy during the re- productive period is an important environmental factor for the soybean yield components and grain yield [7,19]. At low or moderate density, light enrichment increases seed yield per plant and yield per unit area by 26% - 94% regardless of cultivars. However, the yield increase effect was not observed in H339 and HN35 cultivars at the high density. Elucidation of the mechanisms that increase yields in high population as demonstrated under light- enriched conditions may provide insights for crop man- agement and phenotypic improvement [15]. Coordinated Table 1. The analysis for yield index of soybean under different cultivation patterns (2010). Cultivation patterns Grain number/plant Grain weight /plant (g) Yeilds (g/m2) ORP 25.8c 6.8d 162.97f TPCR 25.4c 12.2b 186.94e ORCP 25.8c 12.2b 292.39c BRHD 39.7a 14.4a 345.12b SRHD 28.9b 16.0a 383.48a FPHD 25.2c 10.2c 244.46d Different leter indicate significant at P ≤ 0.05. Table 2. The analysis for yield index of soybean under different cultivation patterns (2011). cultivation patterns Grain number/plant Grain weight/ plant (g) Yeilds (g/m2) ORP 25d 8.8d 170.96f TPCR 27c 13.4b 190.88e ORCP 27c 13.2b 298.35c BRHD 39a 14.8b 348.11b SRHD 29b 16.2a 388.45a FPHD 26c 10.8c 250.43d Different leter indicate significant at P ≤ 0.05. development of the population and individuals, reason- able distribution of canopy internal radiation source, and high light energy utilization rate could lead to high yield [5]. Asanomie and Ikeda reported that light distribution in soybean canopy is a major limiting factor of seed yield [3]. Liu et al. suggests that high density (54 plants/m2) of plants resulted in similar competition for light in both the ambient light and light enriched treatments [15,16]. The relationship between the light radiation, planting density and yield of soybean relationship has been widely studied, but studies for light energy utilization, canopy structure and yield of soybean under different cultivation modes have not been studied. In this study, we examined the canopy structure and light radiation characteristics and their relationship to the yields of soy- bean variety Hefeng50 under different cultivation pat- terns including SRHD, BRHD, ORCP, FPHD, TPCR and ORP. LAI, MFIA, Extinction coefficient (K), TCDP and TCRP and yield index were determined under 6 different cultivation patterns. The results showed light penetration area is large and there was more light radiation loss under the cultivation pattern of ORPA and TPCR (Figure 1), which is not good for photosynthesis. In contrast, cultivation mode SRHD, BRHD and ORCP have good light transparence, which ensures the lower leaves to fully carry out photo- synthesis (Figure 1). Many studies have shown that op- timal LAI is required to obtain high yields of soybean [20,21]. In this study, the LAI of BRHD and SRHD was significantly higher than that of ORP and TPCR. We also showed that FPHD had highest LAI, but not the highest yield, which may be due to the low solar energy utilize- tion of the lower leaves. In this study, MFIA of SRHD and BRHD in R3 and R1 period was the highest, while in R5 it is relatively low, indicating lower leaves have high ventilation and light use utilization efficiency to promote the form of yield (Figure 3, Tables 1 and 2). TCDP and TCRP can clearly reflect the inter-line and intra-line light distribution and utilization status. We studied TCDP and TCRP at different levels and different angles, which is conducive to understanding the radiation characteristics of soybean canopy in the three-dimen- sional space and the creation of high-yield population. Our results also showed that the difference for TCDP and TCRP of the six kinds of cultivation mode, mainly was in R1, TCDP and TCRP were low under SRHD and BRHD, which further explains the low light loss. This might be another reason that leads higher yield of these 2 cultiva- tion modes. The extinction coefficient K is an effective index of the canopy light interception. Great K value indicates a serious population intensity attenuation [22,23]. Studies Copyright © 2013 SciRes. AJPS  Effect of Cultivation Pattern on the Light Radiation of Group Canopy and Yield of Spring Soybean (Glycine Max L. Merrill) 1209 have shown that large K value can result in serious leaf shading, less light received by lower leaves, which is bad for pod of soybean [24]. In this study, ORP cultivation mode has a largest K value and SRHD and BRHD had medium K value and the TPCR had a minimum K value (Figure 6). Small K values of SRHD and BRHD is fa- vorable to the light utilization and yield formation. In summary, the light interception ability of soybean canopy is closely related to the yield. The radiation characteristics of the canopy are mostly affected by can- opy structure. LAI, MFIA, TCDP, TCRP and extinction coefficient (K) are important parameters to evaluate soybean population [19]. Growth and development of the soybean at different stages will, in turn, change canopy parameters of soybean population and affect soybean yield [25]. Particularly, subsoiling and cultivation tech- niques are the most important factors to influence popu- lation parameters. In this study, grain number/plant, dry matter accumulation and yield were significantly differ- ent between different cultivation patterns. Our results suggest that SRHD and BRHD are the optimal cultiva- tion pattern for the improvement of soybean yield in phaeozem region of northeastern China. 4. Experimental Section 4.1. Plant Materials Soybean cultivar used in this study was Hefeng50. This cultivar had sub-limited pods, 85 - 90cm of plant height, sharp leaves, strong stalks, resistance to high density and short internodes. 4.2. Experimental Design This study was conducted in Fuyu Agroecological Ex- perimental Station of Heilongjiang Academy of Sciences in Northeast China in 2010 and 2011. The research site (47˚18′N, 124˚0′E, Altitude: 240 m) is in the north tem- perate and continental monsoon area (cold and arid in winter, hot and rainy in summer). The average annual precipitation is 530 mm with 65% in June-August, and an average annual temperature of 1.5˚C. Annual sunshine time is approximately 2600 - 2800 h, annual solar radia- tion is 113 MJ·cm–2 and annual average available accu- mulated temperature (≥10˚C) is 2450˚C. The soil is the typical Mollisol (Black soil), and textural class is silty clay loam or silty clay with about 40% clay. In each year a cultivar-by-density factorial experiment, arranged in a randomized complete block design with three replica- tions, was conducted. Soybean was cultivated with 6 cultivation Patterns: Big ridge and high density, ridge width 140 cm (BRHD), Small ridge and high density, ridge width 45 cm (SRHD), Flat planting and high density (FPHD), Three line planting in ridge, ridge width 70 cm (TPCR), Original ridge and cards planting, Maize stubble (ORCP) and ORP (Ordinary ridge planting, 70 cm) (Table 3). The planting area for each cultivation pattern was 1260 m2 (21 m × 60 m) and each experiment was performed in split plot with three replicates. The seeds were sowed on 1 May, 2010. Me- chanical precision sowing was used and the experimental field management was similar to the production field. Fertilizer standard for BRHD SRHD and FPHD was 40 kg·ha–1 carbamide (46% N), 180 kg·ha–1 diammonium phosphate (18% N, 46% P2O5) and 80 kg·ha–1 of K2SO4 (50% K2O). The fertilizer standard for TPCR, ORCP and ORP was 75 kg·ha–1 carbamide, 150 kg·ha–1 diammo- nium phosphate and 45 kg·ha–1 of K2SO4. The fences were inspected periodically and all plants in rows bordering the center row were pushed behind the fences to prevent encroachment on the sample row. Canopy parameters and pictures measurements were ob- tained at 15:00-17:00 each day at the beginning flower stage R1 (15th Jul 2010,20th Jul 2011), podding stage R3 (1st Aug 2010, 5th Aug 2011) and the seed filing stage R5 (20th Aug 2010, 25th Aug 2011) using a plant canopy digital image analyzer (CI-110, CID, US) that was placed parallel to and beside the center row plants. Canopy structure indicators included LAI, FIA, VHFD, TCDP, TCRP, extinction light coefficient and picture of population structure at R1, R3 and R5 stage. In each plot, the yield parameters including mature pod number per plant, seeds per plant and seed size (mg/seed) were measured on 15 plants. The plant was cut at ground level, bulked and a total biomass was determined. Mass of a 100-seed subsample was used to determine the mass of an individual seed. Statistical analysis of data was per- formed by using the PROC ANOVA of SAS, and mean comparison was made according to the Duncan’s multi- ple range tests (SAS Institute, Inc. 1996). Table 3. Experimental design in 2010 and 2011. Cultivation Pattern Density (plants/m2) Line distance, Line number Plant distance Ridge width ORP(control)25 12 cm, 2 line 5 cm 70 cm TPCR 25 12 cm, 2 line 5 cm 70 cm ORCP 30 12 cm, 2 line 5 cm 70 cm BRHD 45 12 cm, 6 line 5 cm 140 cm SRHD 38 12 cm, 12 line 5 cm 45 cm FPHD 38 12 cm, 12 line 5 cm 70 cm Copyright © 2013 SciRes. AJPS  Effect of Cultivation Pattern on the Light Radiation of Group Canopy and Yield of Spring Soybean (Glycine Max L. Merrill) 1210 5. Conclusion In this study, we analyzed the canopy structure, dynamic characteristics of light radiation and yield of Hefeng50 (the main variety of soybean in Heilongjiang Province) under six different cultivation patterns (ORP, TPCR, ORCP, BRHD, SRHD and FPHD). The results showed that SRHD and BRHD at different growth period (blos- som period R1, podding R3 and grain filing period R5) produced an even distribution of the population leaf area, suitable mean foliage inclination angle (MFIA), low transparency coefficients for defuse penetration (TCDP) and transparency coefficients for radiation penetration (TCRP), high leaf area index (LAI), extinction light co- efficient (K value), fraction of radiation intercepted (FRI) and light energy utilization rate. Grain number, dry mat- ter weight per plant, and yield of SRHD and BRHD were significantly higher than those of other cultivation pat- terns. The yield of SRHD, BRHD, ORCP, FPHD and TPCR was increased by 136%, 112%, 79%, 50.1% and 14.7%, respectively, compared to that of ORP. These results suggest that SRHD and BRHD are the optimal cultivation pattern for the improvement of soybean yield in phaeozem region of northeastern China. 6. Acknowledgements This work was supported by Nature Science Foundation Grant of Nation (31101171), Nonprofit sector projects in the Ministry of Agriculture (200903007-09) and Youth Innovate Foundation Grant of Haerbin city (2011RFQY- N048). REFERENCES [1] Q. N. Alvaro, P. Eligio and O. Morandi, “Post-Flowering Leaflet Removals Increase Pod Initiation in Soybean Ca- nopies,” Field Crops Research, Vol. 120, No. 3, 2011, pp. 151-160. [2] A. Biabani, M. Hashemi and S. J. Herbert, “Agronomic Performance of Two Intercropped Soybean Cultivars,” International Journal of Plant Production, Vol. 2, No. 3, 2008, pp. 215-222. [3] N. Asanome and T. Ikeda, “Effect of Branch Directions Arrangement on Soybean Yield and Yield Components,” Journal of Agronomy and Crop Science, Vol. 181, No. 2, 1998, pp. 95-102. doi:10.1111/j.1439-037X.1998.tb00404.x [4] R. A. Ball, L. C. Purcell and E. D. Vories, “Optimizing Soybean Plant Population for a Short-Season Production System in the Southern USA,” Crop Scienc e, Vol. 40, No. 5, 2000, pp. 757-764. doi:10.2135/cropsci2000.403757x [5] R. C. David and A. Alain, “Vanasse Production of Soy- bean Associated with Different Hybrid Poplar Clones in a Tree-Based Intercropping System in Southwestern Que- bec, Canada,” Agriculture, Ecosystems and Environment, Vol. 131, No. 1-2, 2009, pp. 51-60. doi:10.1016/j.agee.2008.08.011 [6] B. C. Emine, “Changes in Leaf Area Index, Light Inter- ception, Quality and Dry Matter Yield of an Abandoned Rangeland as Affected by the Different Levels of Nitro- gen and Phosphorus Fertilization,” Turkish Journal of Field Crops, Vol. 16, No. 2, 2011, pp. 117-120. [7] Y. Gan, I. Stulen and H. V. Keulen, “Physiological Re- sponse of Soybean Genotypes to Plant Density,” Field Crop Research, Vol. 74, No. 2-3, 2002, pp. 231-241. doi:10.1016/S0378-4290(01)00212-X [8] G. R. Haddadchi and Z. Gerivani, “Effects of Phenolic Extracts of Canola (Brassica napuse L.) on Germination and Physiological Responses of Soybean (Glycin max L.) Seedlings,” International Journal of Plant Production, Vol. 3, No. 1, 2009, pp. 63-74. [9] T. Hirose, “Development of the Monsi-Saeki Theory on Canopy Structure and Function,” Annals of Botany, Vol. 95, No. 3, 2005, pp. 483-494. doi:10.1093/aob/mci047 [10] L. F. Huang, J. H. Zheng and W. H. Zhang, “Diurnal Va- riations in Gas Exchange, Chlorophyll Fluorescence Quenching and Light Allocation in Soybean Leaves: The Cause for Midday Depression in CO2 Assimilation,” Sci- entia Horticulturae, Vol. 110, No. 2, 2006, pp. 214-218. doi:10.1016/j.scienta.2006.07.001 [11] E. James and S. Board, “Soybean Cultivar Differences on Light Interception and Leaf Area Index during Seed Fill- ing,” Agronomy Journal, Vol. 96, No. 1, 2004, pp. 305- 310. doi:10.2134/agronj2004.0305 [12] W. Jeremy, W. M. David and J. S. Thomas, “Variability of Light Interception and Radiation Use Efficiency in Maize and Soybean,” Field Crops Research, Vol. 121, No. 1, 2011, pp. 147-152. doi:10.1016/j.fcr.2010.12.007 [13] J. Jin and X. B. Liu, “A Comparative Study on Phy- siological Characteristics during Reproductive Growth Stage in Different Yielding Types and Maturities of Soy- bean,” Acta Agronomica Sinica, Vol. 30, No. 12, 2004, pp. 1225-1231. (in Chinese with English Abstract) [14] B. Liu, Y. Li, X. B. Liu and C. Wang, “Lower Total So- luble Sugars in Vegetative Parts of Soybean Plants Are Responsible for Reduced Pod Number under Shading Conditions,” Field Crops Research, Vol. 5, No. 13, 2011, pp. 1852-1857. [15] B. Liu, X. B. Liu and W. Cheng, “Responses of Soybean Yield and Yield Components to Light Enrichment and Planting Density,” International Journal of Plant Pro- duction, Vol. 4, No. 1, 2010, pp. 1735-1742. [16] X. B. Liu, S. J. Herbert and A. M. Hashemi, “Soybean (Glycine max) Seed Growth Characteristics in Response to Light Enrichment and Shading,” Plant, Soil and En- vironment, Vol. 52, No. 4, 2006, pp. 178-185. [17] X. B. Liu, S. J. Herbert and Q. Y. Zhang, “Yield-Density Relation of Glyphosate-Resistant Soya Beans and Their Responses to Light Enrichment in North-Eastern USA,” Journal of Agronomy and Crop Science, Vol. 193, No. 1, 2007, pp. 55-62. doi:10.1111/j.1439-037X.2006.00241.x [18] R. S. Loomis and W. A. Williams, “Productivity and the Copyright © 2013 SciRes. AJPS  Effect of Cultivation Pattern on the Light Radiation of Group Canopy and Yield of Spring Soybean (Glycine Max L. Merrill) Copyright © 2013 SciRes. AJPS 1211 Morphology of Crop Stands: Patterns with Leaves,” Am- erican Society of Agronomy, Vol. 3, No. 1, 1969, pp. 27- 47. [19] P. S. Shawn, N. D. Dylan and L. K. Eric, “Leaf Optical Properties Reflect Variation in Photosynthetic Metabo- lism and Its Sensitivity to Temperature,” Journal of Ex- perimental Botany, Vol. 63, No. 1, 2012, pp. 489-502. doi:10.1093/jxb/err294 [20] G. A. Maddonni, M. E. Otegui and A. G. Cirilo, “Plant Population Density, Row Spacing and Hybrid Effects on Maize Canopy Architecture and Light Attenuation,” Field Crops Research, Vol. 71, No. 3, 2001, pp. 183-193. doi:10.1016/S0378-4290(01)00158-7 [21] T. Mevlüt, A. Sebahattin and Y. Osman, “Effect of Seed- ing Rate on the Forage Yields and Quality in Pea Culti- vars of Differing Leaf Types,” Turkish Journal of Field Crops, Vol. 16, No. 2, 2011, pp. 137-141. [22] S. B. Peng, G. S. Khush and P. Virk, “Progress in Ideo- type Breeding to Increase Rice Yield Potential,” Field Crops Research, Vol. 108, No. 1, 2008, pp. 32-38. doi:10.1016/j.fcr.2008.04.001 [23] D. G. Reta-Sanchez and J. L. Fowler, “Canopy Light Environment and Yield of Narrow-Row Cotton as Affect- ed by Canopy Architecture,” Agronomy Journal, Vol. 94, No. 6, 2002, pp. 1317-1322. doi:10.2134/agronj2002.1317 [24] T. Rüveyde, “The Effects of Varying Row Spacing and Phosphorus Doses on the Yield and Quality of Fenugreek (Trigonella foenum-graecum L.),” Turkish Journal of Field Crops, Vol. 16, No. 2, 2011, pp. 142-148. [25] Z.Svecnjak, B. Varga and J. Butorac, “Yield Components of Apical and Subapical Ear Contributing to the Grain Yield Responses of Prolific Maize at High and Low Plant Populations,” Journal of Agronomy and Crop Science, Vol. 192, No. 1, 2006, pp. 37-42. doi:10.1111/j.1439-037X.2006.00188.x
|