Paper Menu >>
Journal Menu >>
 Computational Water, Energy, and Environmental Engineering, 2013, 2, 1-9 doi:10.4236/cweee.2013.22B001 Published Online April 2013 (http://www.scirp.org/journal/cweee) Growing Public Health Concerns from Poor Urban Air Quality: Strategies for Sustainable Urban Living Bhaskar Kura, Suruchi Verma, Elena Ajdari, Amrita Iyer Civil & Environmental Engineering, University of New Orleans, Louisiana, U.S.A Email: bkura@uno.edu Received 2013 ABSTRACT Urban areas around the world, particularly in emerging nations such as China, India, and Brazil are experiencing high levels of air pollution due to increased population, economy, spending, and consumption, all of which contribute to de- terioration in environmental and public health conditions in urban areas. This paper briefly discusses important sources of air pollution, air pollutants of concern, public health impacts, and proposed strategies to combat urban air pollution and promote sustainable urban living. A team of researchers under the mentorship of the main author is working on a number of air quality projects that involve air quality monitoring (sources, ambient, indoor, and occupational), emis- sions modeling, atmospheric dispersion modeling, air pollution control, and development of knowledge-based systems to manage air quality. This paper presents potential strategies that could help address the growing public health con- cerns in urban areas and promote sustainable and healthy living. Keywords: Urban Air Quality; Exposures to Air Pollutants; Risk Assessment; Public Health 1. Introduction The populations of the rapidly expanding cities of Asia, Africa, and Latin America are increasingly exposed to ambient air pollutants by several folds compared to the levels of exposures in developed countries. It is estimated that more than 1 billion people are exposed to outdoor air pollution annually. Urban air pollution is linked to about 1 million premature deaths and 1 million pre-native deaths each year [1]. Urban air pollution is estimated to cost approximately 2% of GDP in developed countries and 5% in developing countries [1]. Rapid urbanization has resulted in increasing urban air pollution in major cities, especially in developing countries. The potential for serious consequences of exposure to high levels of ambient air pollution was made clear in the mid-20th century when cities in Europe and the United States experienced episodes of air pollution, such as the incidents of London Fog of 1952 [2] and Donora Smog of 1948 [3], which resulted in large numbers of excess deaths and hospital admissions. In more recent years, the “gray sky” phenomenon has been the subject of growing public concern. Research shows that high levels of am- bient fine particles (PM2.5) lead to poor visibility [4]. Urban air pollution occurs when there are continuous or large emissions of air pollutants. The level of pollution depends on the meteorological (wind conditions and at- mospheric stability) conditions as well. Urban air pollu- tion is usually associated with high quantities of sulfur dioxide, oxides of carbon (dioxide and monoxide), ox- ides of nitrogen, and particulate matter (PM10 and PM2.5) present in the atmosphere. Depending on other emission sources in cities, heavy metals and volatile organic com- pounds (VOCs) are also present. In the United States air pollutants are broadly categorized into criteria pollut- ants (SO2, NOx, CO, O3, PM10 and Pb) and hazardous air pollutants (HAPs). Criteria pollutants have federal stan- dards as promulgated by the United States Environmental Protection Agency (U.S. EPA) which are shown in Table 1. Whereas HAPs do not have national ambient standards and the goal is to eliminate them from the air environ- ment to the extent possible as they are considered to be hazardous/toxic to human health at any levels. Data from the World Health Organization (WHO) in- dicates that the world's average PM10 levels by region ranges from 21 to 142 µg/m3, with a world average of 71 μg/m3[5]. Scientific studies suggest that fine particulate matter – less than 10 microns in diameter (PM10) – is likely to be the most dangerous because such fine parti- cles can be inhaled deeply into the lungs where the clearance time of deposited particles is much longer, in- creasing the potential for adverse health effects. Countries like China, India and Pakistan have recently become highly polluted in terms of air pollution. By the end of 2011, the mainland of the People's Republic of China had a total urban population of 691 million or 51.2% of the total population, rising from 26% in 1990. Copyright © 2013 SciRes. CWEEE  B. KURA ET AL. 2 In the 11-yr period of 1990–‒2001, the urban population increased 10%, from 26% to 36% of the population as seen in Figure 1. Similarly, GDP changes are shown in Figure 2[6]. Table 1. National ambient air quality standards (NAAQs) for criteria pollutants [Adapted from 17]. Pollutant Primary/Secondary Average Time Level Urban Sources Health Impacts 8-hour 9 ppm (10.31 mg/m3) Carbon Monoxide primary 1-hour 35 ppm (40.09 mg/m3) Vehicles Fatigue, impaired vision, CNS and cardiovascular defects Lead primary and secondary Rolling 3 month average 0.15 μg/m3 Vehicles Lead poisoning in children, CNS defects, renal and reproductive malfunctions primary 1-hour 100 ppb (188.18 μg/m3) Nitrogen Dioxide primary and secondary Annual 53 ppb (99.73 μg/m3) Vehicles Increased bronchial sensitivity and reduced lung capacity Ozone primary and secondary 8-hour 0.075 ppm (147 μg/m3) Secondary pollutant; Photochemical reactions of vehicle emission Respiratory defects and reduced lung capacity primary Annual 12 μg/m3 secondary Annual 15 μg/m3 PM2.5 primary and secondary 24-hour 35 μg/m3 Particle Pollution PM10 primary and secondary 24-hour 150 μg/m3 Vehicles, power plants, industry, agriculture, surface dust, sea spray Respiratory and cardiovascular defects. Also, an increase in short term mortality rate. Increased cardiopulmonary and lung cancer mortality rate. primary 1-hour 75 ppb (196.5 μg/m3) Sulfur Dioxide secondary 3-hour 0.5 ppm (1.31 mg/m3) Power plants, vehicles Changes in the pulmonary function and increase in mortality rate. (a) (b) Figure 1. (a) Population and urbanization rate increase in China and (b) Gross domestic product growth in China from 1990 to 2003 [6]. Copyright © 2013 SciRes. CWEEE 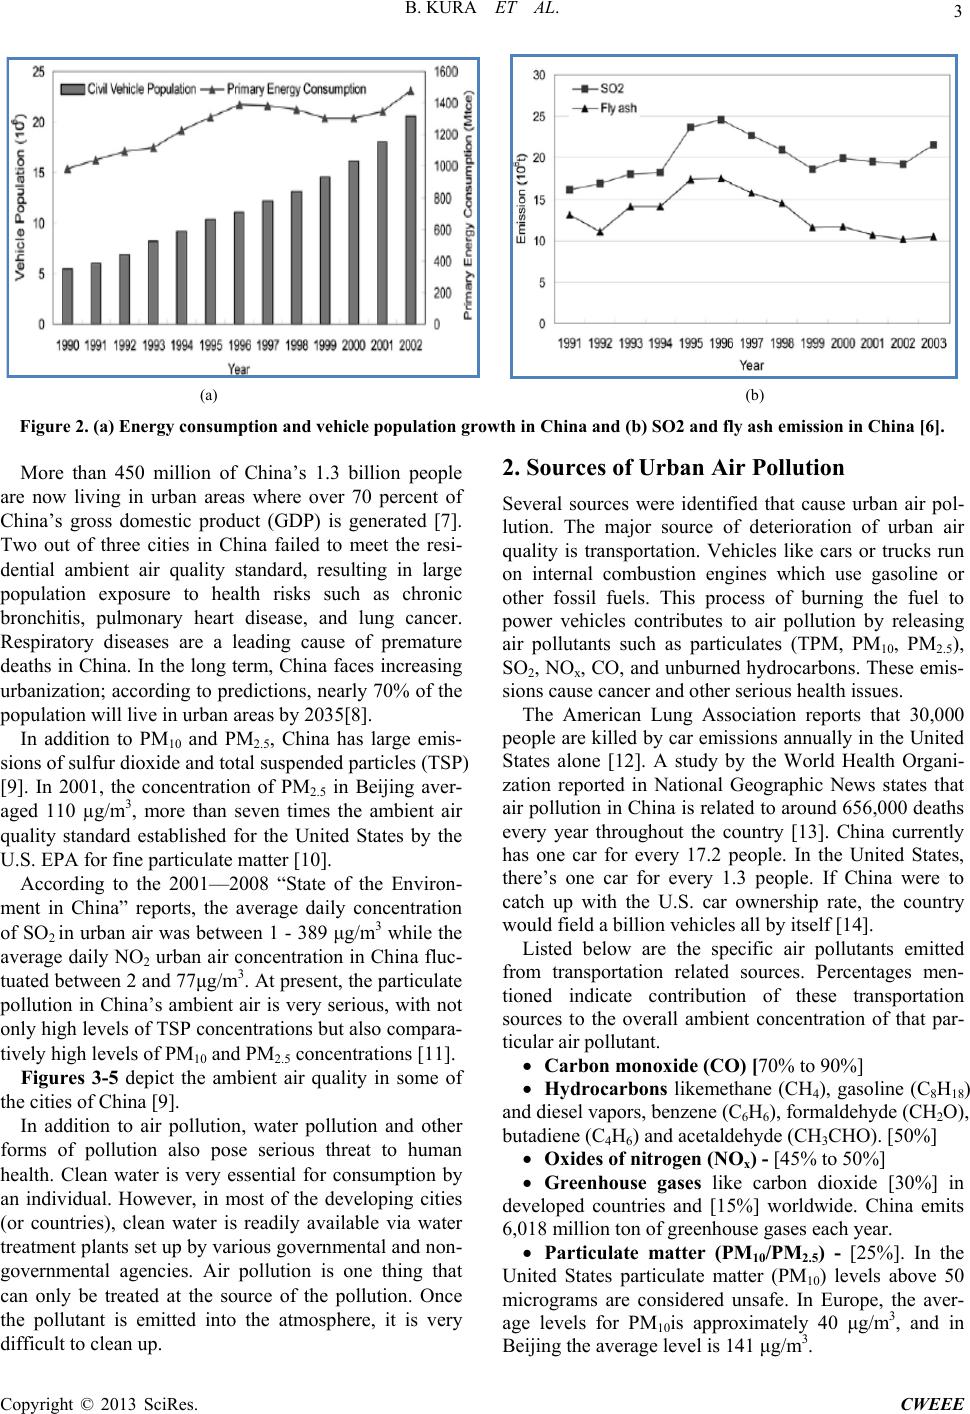 B. KURA ET AL. 3 (a) (b) Figure 2. (a) Energy consumption and vehicle population growth in China and (b) SO2 and fly ash emission in China [6]. More than 450 million of China’s 1.3 billion people are now living in urban areas where over 70 percent of China’s gross domestic product (GDP) is generated [7]. Two out of three cities in China failed to meet the resi- dential ambient air quality standard, resulting in large population exposure to health risks such as chronic bronchitis, pulmonary heart disease, and lung cancer. Respiratory diseases are a leading cause of premature deaths in China. In the long term, China faces increasing urbanization; according to predictions, nearly 70% of the population will live in urban areas by 2035[8]. In addition to PM10 and PM2.5, China has large emis- sions of sulfur dioxide and total suspended particles (TSP) [9]. In 2001, the concentration of PM2.5 in Beijing aver- aged 110 µg/m3, more than seven times the ambient air quality standard established for the United States by the U.S. EPA for fine particulate matter [10]. According to the 2001–‒2008 “State of the Environ- ment in China” reports, the average daily concentration of SO2 in urban air was between 1 - 389 μg/m3 while the average daily NO2 urban air concentration in China fluc- tuated between 2 and 77μg/m3. At present, the particulate pollution in China’s ambient air is very serious, with not only high levels of TSP concentrations but also compara- tively high levels of PM10 and PM2.5 concentrations [11]. Figures 3-5 depict the ambient air quality in some of the cities of China [9]. In addition to air pollution, water pollution and other forms of pollution also pose serious threat to human health. Clean water is very essential for consumption by an individual. However, in most of the developing cities (or countries), clean water is readily available via water treatment plants set up by various governmental and non- governmental agencies. Air pollution is one thing that can only be treated at the source of the pollution. Once the pollutant is emitted into the atmosphere, it is very difficult to clean up. 2. Sources of Urban Air Pollution Several sources were identified that cause urban air pol- lution. The major source of deterioration of urban air quality is transportation. Vehicles like cars or trucks run on internal combustion engines which use gasoline or other fossil fuels. This process of burning the fuel to power vehicles contributes to air pollution by releasing air pollutants such as particulates (TPM, PM10, PM2.5), SO2, NOx, CO, and unburned hydrocarbons. These emis- sions cause cancer and other serious health issues. The American Lung Association reports that 30,000 people are killed by car emissions annually in the United States alone [12]. A study by the World Health Organi- zation reported in National Geographic News states that air pollution in China is related to around 656,000 deaths every year throughout the country [13]. China currently has one car for every 17.2 people. In the United States, there’s one car for every 1.3 people. If China were to catch up with the U.S. car ownership rate, the country would field a billion vehicles all by itself [14]. Listed below are the specific air pollutants emitted from transportation related sources. Percentages men- tioned indicate contribution of these transportation sources to the overall ambient concentration of that par- ticular air pollutant. Carbon monoxide (CO) [70% to 90%] Hydrocarbons likemethane (CH4), gasoline (C8H18) and diesel vapors, benzene (C6H6), formaldehyde (CH2O), butadiene (C4H6) and acetaldehyde (CH3CHO). [50%] Oxides of nitrogen (NOx) - [45% to 50%] Greenhouse gases like carbon dioxide [30%] in developed countries and [15%] worldwide. China emits 6,018 million ton of greenhouse gases each year. Particulate matter (PM10/PM2.5) - [25%]. In the United States particulate matter (PM10) levels above 50 micrograms are considered unsafe. In Europe, the aver- age levels for PM10is approximately 40 μg/m3, and in Beijing the average level is 141 μg/m3. Copyright © 2013 SciRes. CWEEE 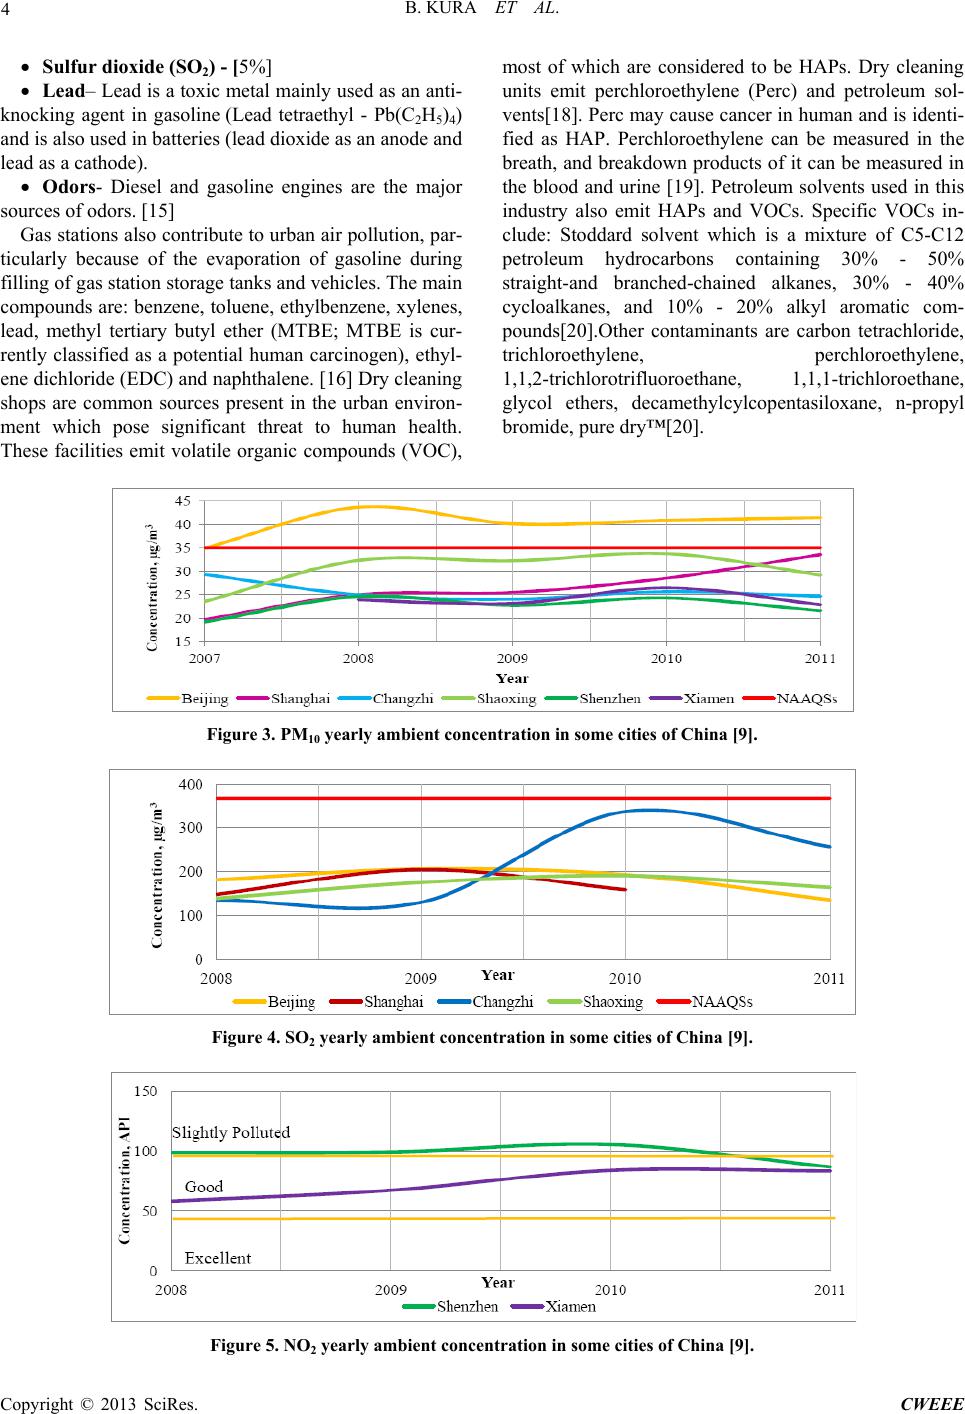 B. KURA ET AL. 4 Sulfur dioxide (SO2) - [5%] Lead– Lead is a toxic metal mainly used as an anti- knocking agent in gasoline (Lead tetraethyl - Pb(C2H5)4) and is also used in batteries (lead dioxide as an anode and lead as a cathode). Odors- Diesel and gasoline engines are the major sources of odors. [15] Gas stations also contribute to urban air pollution, par- ticularly because of the evaporation of gasoline during filling of gas station storage tanks and vehicles. The main compounds are: benzene, toluene, ethylbenzene, xylenes, lead, methyl tertiary butyl ether (MTBE; MTBE is cur- rently classified as a potential human carcinogen), ethyl- ene dichloride (EDC) and naphthalene. [16] Dry cleaning shops are common sources present in the urban environ- ment which pose significant threat to human health. These facilities emit volatile organic compounds (VOC), most of which are considered to be HAPs. Dry cleaning units emit perchloroethylene (Perc) and petroleum sol- vents[18]. Perc may cause cancer in human and is identi- fied as HAP. Perchloroethylene can be measured in the breath, and breakdown products of it can be measured in the blood and urine [19]. Petroleum solvents used in this industry also emit HAPs and VOCs. Specific VOCs in- clude: Stoddard solvent which is a mixture of C5-C12 petroleum hydrocarbons containing 30% - 50% straight-and branched-chained alkanes, 30% - 40% cycloalkanes, and 10% - 20% alkyl aromatic com- pounds[20].Other contaminants are carbon tetrachloride, trichloroethylene, perchloroethylene, 1,1,2-trichlorotrifluoroethane, 1,1,1-trichloroethane, glycol ethers, decamethylcylcopentasiloxane, n-propyl bromide, pure dry™[20]. Figure 3. PM10 yearly ambient concentration in some cities of China [9]. Figure 4. SO2 yearly ambient concentration in some cities of China [9]. Figure 5. NO2 yearly ambient concentration in some cities of China [9]. Copyright © 2013 SciRes. CWEEE  B. KURA ET AL. 5 Compounds in VOCs can react with sunlight and con- tribute to ground level ozone which can cause respiratory disease. In 1991, California wasthe first state which de- clared perchloroethylene as a toxic chemical.As a result of thisban will be implemented on using this material by thedry cleaners in that state from 2023 [21]A recent study at Georgetown University shows that perc remains in dry-cleaned clothes and the level of this chemical in- creases with repeated dry cleanings [22]. 3. Health Impacts from Exposure to Air Pollutants The health impacts of a particular air pollutant depends on the pathway that it enters a human body and the type of interactions it goes through once it is inside the body. This is depicted in Figure 6. Usually, the pathway of exposure to an air pollutant is inhalation of the pollutant. Another route of exposure could be dermal where the skin comes in contact with the pollutant. Skin offers a good resistance to any air pollutant, but in case of any cracks or aberrations, it is highly possible that the pol- lutant might enter the body through the skin. The extent of exposure depends on the dose that the individual is exposed to and the time that the individual was exposed for. Even when the individual goes through a very small dosage of the pollutant, if the time period of exposure is long enough, the person can suffer a fatality in some cases. Based on this, the health impacts are clas- sified as acute and chronic. Air pollutants majorly affect the respiratory system that mainly constitutes the lungs. The various effects on the respiratory system are increased respiratory (lung) illnesses, asthma exacerbations (makes asthma worse), decreased lung function in children, and chronic respiratory illnesses. In some cases with high levels of exposure,air pollutants can cause cancer and premature death. Figure 6. Exposure pathways for air pollutants (Source: EPA). Once inside the lungs, the air pollutants get picked up by the bloodstream and can cause a number of cardio- vascular impacts. These include, but not limited to, myocardial infarction (heart attack), stroke, hypertension (high blood pressure), atherosclerosis (artery disease), arrhythmia (irregular heartbeat), and thrombosis (abnor- mal clotting). In several cases, certain reproductive (birth) defects have been observed. These birth defects are preterm ba- bies (born earlier than they should be), low birth weight, slow growth in the womb, miscarriage, still birth, pre- mature birth, infant mortality. Studies have found that a 10% increase in PM and SO2 pollution are associated with a 1% increase in infant deaths. Also, breathing high levels of urban air pollution almost tripled a mother’s chances of having a low birth weight baby. More in-depth health impacts are shown in Tables 1-3. Quantifying the magnitude of these health impacts in cities worldwide, however, presents considerable chal- lenges owing to the limited availability of information on both effects on health and on exposures to air pollution in many parts of the world. Man-made urban air pollution is a complex mixture with many toxic components. 4. An Integrated Approach to Risk Assessment An air quality research team at the University of New Orleans (UNO) is involved in research that promotes integrated air quality management using health risk as an important criteria. As part of integrated air quality man- agement, the team typically uses the following strategies and research methods to achieve the overall air quality management goals: Air quality monitoring: Monitoring of ambient air quality, source emissions, indoor air quality, and occupa- tional exposures are monitored as part of the research methodology. Modeling: Modeling strategies used include, emis- sions modeling, atmospheric dispersion modeling, expo- sure modeling (both ambient conditions and indoor con- ditions). Clean/green technologies: As part of this initiative, research efforts are made to optimize industrial and mu- nicipal processes with the goal of (a) promoting/in- creasing efficiency, (b) minimize consumption of natural resources, input materials, fuel, and energy, (c) minimize life-cycle costs, (d) reduce waste quantities, and (e) minimize health risks (cancer and non-cancer health risks). UNO has an emissions test facility which can be used to simulate industrial and other processes to evalu- ate existing manufacturing technologies and recommend process changes to achieve environmental friendliness. Copyright © 2013 SciRes. CWEEE 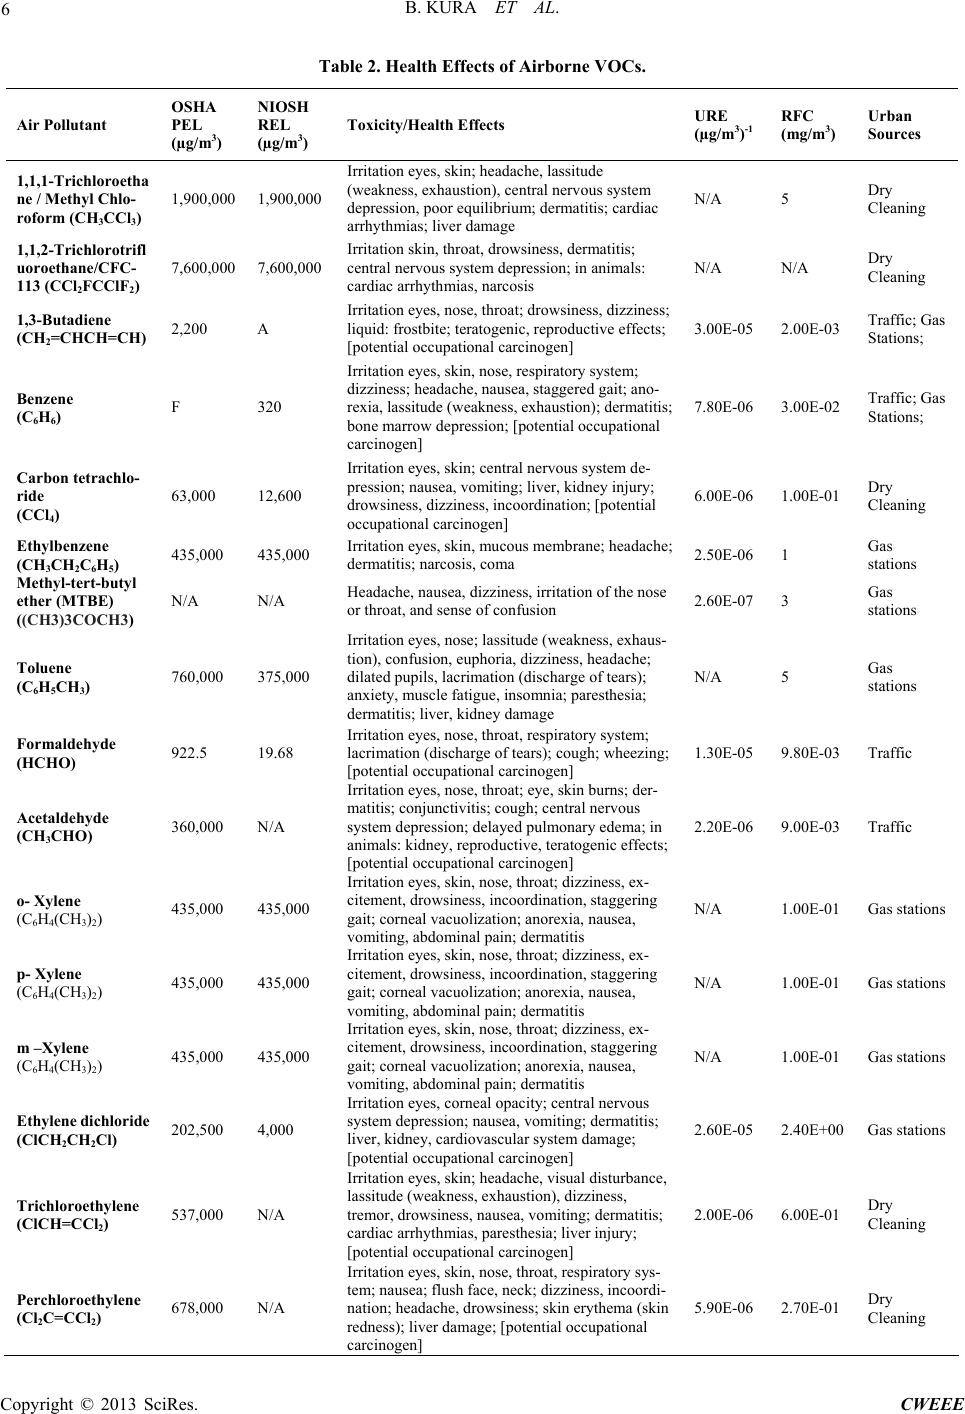 B. KURA ET AL. 6 Table 2. Health Effects of Airborne VOCs. Air Pollutant OSHA PEL (µg/m3) NIOSH REL (µg/m3) Toxicity/Health Effects URE (µg/m3)-1 RFC (mg/m3) Urban Sources 1,1,1-Trichloroetha ne / Methyl Chlo- roform (CH3CCl3) 1,900,000 1,900,000 Irritation eyes, skin; headache, lassitude (weakness, exhaustion), central nervous system depression, poor equilibrium; dermatitis; cardiac arrhythmias; liver damage N/A 5 Dry Cleaning 1,1,2-Trichlorotrifl uoroethane/CFC- 113 (CCl2FCClF2) 7,600,000 7,600,000 Irritation skin, throat, drowsiness, dermatitis; central nervous system depression; in animals: cardiac arrhythmias, narcosis N/A N/A Dry Cleaning 1,3-Butadiene (CH2=CHCH=CH) 2,200 A Irritation eyes, nose, throat; drowsiness, dizziness; liquid: frostbite; teratogenic, reproductive effects; [potential occupational carcinogen] 3.00E-05 2.00E-03 Traffic; Gas Stations; Benzene (C6H6) F 320 Irritation eyes, skin, nose, respiratory system; dizziness; headache, nausea, staggered gait; ano- rexia, lassitude (weakness, exhaustion); dermatitis; bone marrow depression; [potential occupational carcinogen] 7.80E-06 3.00E-02 Traffic; Gas Stations; Carbon tetrachlo- ride (CCl4) 63,000 12,600 Irritation eyes, skin; central nervous system de- pression; nausea, vomiting; liver, kidney injury; drowsiness, dizziness, incoordination; [potential occupational carcinogen] 6.00E-06 1.00E-01 Dry Cleaning Ethylbenzene (CH3CH2C6H5) 435,000 435,000 Irritation eyes, skin, mucous membrane; headache; dermatitis; narcosis, coma 2.50E-06 1 Gas stations Methyl-tert-butyl ether (MTBE) ((CH3)3COCH3) N/A N/A Headache, nausea, dizziness, irritation of the nose or throat, and sense of confusion 2.60E-07 3 Gas stations Toluene (C6H5CH3) 760,000 375,000 Irritation eyes, nose; lassitude (weakness, exhaus- tion), confusion, euphoria, dizziness, headache; dilated pupils, lacrimation (discharge of tears); anxiety, muscle fatigue, insomnia; paresthesia; dermatitis; liver, kidney damage N/A 5 Gas stations Formaldehyde (HCHO) 922.5 19.68 Irritation eyes, nose, throat, respiratory system; lacrimation (discharge of tears); cough; wheezing; [potential occupational carcinogen] 1.30E-05 9.80E-03 Traffic Acetaldehyde (CH3CHO) 360,000 N/A Irritation eyes, nose, throat; eye, skin burns; der- matitis; conjunctivitis; cough; central nervous system depression; delayed pulmonary edema; in animals: kidney, reproductive, teratogenic effects; [potential occupational carcinogen] 2.20E-06 9.00E-03 Traffic o- Xylene (C6H4(CH3)2) 435,000 435,000 Irritation eyes, skin, nose, throat; dizziness, ex- citement, drowsiness, incoordination, staggering gait; corneal vacuolization; anorexia, nausea, vomiting, abdominal pain; dermatitis N/A 1.00E-01 Gas stations p- Xylene (C6H4(CH3)2) 435,000 435,000 Irritation eyes, skin, nose, throat; dizziness, ex- citement, drowsiness, incoordination, staggering gait; corneal vacuolization; anorexia, nausea, vomiting, abdominal pain; dermatitis N/A 1.00E-01 Gas stations m –Xylene (C6H4(CH3)2) 435,000 435,000 Irritation eyes, skin, nose, throat; dizziness, ex- citement, drowsiness, incoordination, staggering gait; corneal vacuolization; anorexia, nausea, vomiting, abdominal pain; dermatitis N/A 1.00E-01 Gas stations Ethylene dichloride (ClCH2CH2Cl) 202,500 4,000 Irritation eyes, corneal opacity; central nervous system depression; nausea, vomiting; dermatitis; liver, kidney, cardiovascular system damage; [potential occupational carcinogen] 2.60E-05 2.40E+00 Gas stations Trichloroethylene (ClCH=CCl2) 537,000 N/A Irritation eyes, skin; headache, visual disturbance, lassitude (weakness, exhaustion), dizziness, tremor, drowsiness, nausea, vomiting; dermatitis; cardiac arrhythmias, paresthesia; liver injury; [potential occupational carcinogen] 2.00E-06 6.00E-01 Dry Cleaning Perchloroethylene (Cl2C=CCl2) 678,000 N/A Irritation eyes, skin, nose, throat, respiratory sys- tem; nausea; flush face, neck; dizziness, incoordi- nation; headache, drowsiness; skin erythema (skin redness); liver damage; [potential occupational carcinogen] 5.90E-06 2.70E-01 Dry Cleaning Copyright © 2013 SciRes. CWEEE  B. KURA ET AL. 7 Table 3. Health effects of airborne metals.* Air Pollutant OSHA PEL (µg/m3) NIOSH REL (µg/m3) Toxicity/Health Effects URE (µg/m3)-1 RFC (mg/m3) Urban Sources Lead (Pb) 50 50 Lassitude, insomnia; facial pallor; anorexia, constipation, abdominal pain, colic; anemia; gingival lead line; tremor; paralysis wrist, ankles; encephalopathy; kidney disease; irrita- tion eyes; hypertension N/A++ 1.5E-04 [2 times more potent that Hg] Traffic-Brake Dust Antimony (Sb) 500 500 Chronic poisoning, functional disorders of the heart, degeneration of the heart muscle N/A 2.2E-04 [1.4 times more potent that Hg] Traffic-Brake Dust Copper (Cu) 1,000 1,000 Irritation-Eye, Nose, Throat; Cumulative Lung Damage N/A N/A Traffic-Brake Dust Zinc (Zn) 5,000 5,000 Irritation-Eye, Nose, Throat, Skin---Marked Respiratory Effects---Acute lung dam- age/edema Chronic (Cumulative) Toxic- ity-Suspect Carcinogen or mutagen N/A N/A Vehicular tires Mercury (Hg) 100 50 Irritation eyes, skin; cough, dyspnea, bronchitis, pneumonitis; tremor, insomnia, lassitude ; stomatitis, salivation; gastrointestinal distur- bance, anorexia, weight loss; proteinuria N/A 3.00E-04 Various Chromium (Cr) 1,000 500 Cancer; irritation eyes, skin; lung fibrosis (his- tologic) 1.2E-02 [38 times more carcinogenic than Ni] 1E-04 [3 times more potent that Hg] Various Manga- nese (Mn) 5,000 1,000 Asthenia, insomnia, mental confusion; metal fume fever: dry throat, cough, chest tightness, dyspnea, rales, flu-like fever; low-back pain; vomiting; malaise ; lassitude ; kidney damage N/A 0.5E-04 [6 times more potent that Hg] Various Nickel (Ni) 1,000 15 Sensitization dermatitis, allergic asthma, pneu- monitis; [potential occupational carcinogen] 3.12E-04 0.9E-04 [3.3 times more potent that Hg] Various Cadmium (Cd) 5 N/A Pulmonary edema, dyspnea, cough, chest tight- ness, headache; chills, muscle aches; nausea, vomiting, diarrhea; anosmia, emphysema, proteinuria, mild anemia; [potential occupa- tional carcinogen] 0.18E-02 [5.8 times more carcinogenic than Ni] 0.1E-04 [30 times more potent that Hg] Various Arsenic (As) 10 2 Ulceration of nasal septum, dermatitis, gastro- intestinal disturbances, peripheral neuropathy, hyperpigmentation of skin, [potential occupa- tional carcinogen] 0.43E-02 [13.8 times more carcinogenic than Ni] 0.15E-04 [20 times more potent that Hg] Various *Note: Ambient Standards for the above air pollutants are not available. Some sources recommend 1/1000th value of OSHA PEL as ambient limit. N/A- Not Available Engineering controls: The research team identifies, evaluates, and develops air pollution control technologies appropriate for various industry sectors for both particu- lates and gaseous air pollutants. Development of decision support systems: Kura’s research team developed a number of decision support systems for industrial environmental management, occu- pational exposures and health management, health risk management system for public, and life cycle assessment and life cycle costing predictive model for industrial processes. 5. Proposed Research and Management Strategies for Urban Air Quality Man- agement As the urban air environment is contaminated with a va- riety of pollutants such as criteria pollutants (CO, SO2, NOx, PM10, PM2.5, Pb, O3) and hazardous air pollutants (heavy metals, volatile organic compounds, and others) from a wide range of sources such as transportation, com- mercial, and industrial sources, urban air quality man- agement requires a comprehensive and integrate ap- proach. Kura’s research team at UNO has significant experience in this area. A conceptual urban air quality management approach is described in this section: Identify sources of air pollution in the immediate urban area and the area of influence Knowing the sources of air pollution to identify the specific pollutants that may be released in the air envi- ronment Conduct preliminary air quality monitoring to identify the concentration ranges for air pollutants of concern Identify the best monitoringtechniques, equip- ment, and resources needed to understand the short term and long term trends of these pollutants Establish a permanent network of air quality monitoring stations to measure criteria pollutants and hazardous air pollutants Develop a database of air pollutant emission quan- tities from various sources that have been identified for Copyright © 2013 SciRes. CWEEE  B. KURA ET AL. 8 the urban area being investigated Evaluate the relationships between the emission quantities and the ambient concentrations under various meteorological conditions Prioritizethe sources of air pollution for regulating as appropriate Use the data obtained from the network of air qual- ity monitoring stations for developing policies to con- trol emissions and also to make changes in public be- havior which may be responsible for poor air quality (traffic; open burning; fuel combustion; others) Develop a decision support system to integrate the ambient air quality data to compute exposures and health risk probabilities (cancer and non-cancer) Use the data from the decision support system to assist the policy makers, scientists, and the public to achieve the required air quality management goals. A proposed integrated air quality management plan for urban areas is illustrated in Figure 7. 6. Summary and Conclusions This paper presents various urban air quality challenges experienced by many cities around the world. More spe- cifically, types of sources present in urban areas, types of air pollutants, and health hazards associated with most common urban air pollutants. Due to the high concentra- tion of population, recent growth in the economy and increased consumption resulted in deteriorated air quality. Information provided in this paper and some suggested strategies discussed should be helpful to initiate a dia- logue among interested parties. While it is not practically feasible to discuss all aspects of integrated urban air quality management strategies, this paper should serve well in undertaking further actions by the stake-holders from the governmental agencies, the scientific commu- nity, and the public. 7. Acknowledgements Principal author (who serves on the Board of Trustees of ITU) acknowledges and thanks the financial support re- ceived from the International Technological University (ITU), San Jose, CA towards conference travel. REFERENCES [1] Urban Air Quality. United Nations Environment Pro- gramme, Urban Environment Unit - http://www.unep.org/urban_environment/issues/urban_air .asp [2] Stegeman, John J. & Solow, Andrew R,“A Look Back at the London Smog of 1952 and the Half Century Since A Half Century Later: Recollections of the London Fog,” Environmental Health Perspectives, 2002. [3] “Overview of the 1948 Donora Smog,” Pennsylvania Department of Environmental Protection. [4] Y.L. Sun, G.S. Zhuang, Y. Wang, L.H. Han, J.H. Guo, M. Dan, W.J. Zhang, Z.F.Wang and Z.P. Hao, “The Air-Borne Particulate Pollution in Bei- jing—Concentration, Composition, Distribution and Sources,” 2004. [5] Annual mean PM10 (Particulate matter with diameter of 10 μm or less), by city. World Health organization - http://www.who.int/phe/health_topics/outdoorair/databas es/en/index.html [6] J.M. Hao and L.T. Wang, “Improving Urban Air Quality in China: Beijing Case Study,” 2005. [7] Juan, S., “Census: Population hits 1.37b,” China Daily, 2011. http://europe.chinadaily.com.cn/china/2011-04/29/content _12418282.htm [8] Urban and Rural Areas 2011, United Nations, Department of economic and Social Affairs. http://esa.un.org/unup/Wallcharts/urban-rural-areas.pdf [9] C. Blazo, B. Kura and N. Halageri, “China: The Fastest Growing Economy and the Associated Air Quality Chal- lenges”, Automatic Welding Machinery Association, 2012. [10] J.L.Wang, Y.H. Zhang, M. Shao, et al. “The Chemical Composition and Quantitative Relationship between Me- teorological Condition and Fine Particles in Beijing,” Jounal of Environmental Sciences, Vol. 16, 2004, pp. 860-864. [11] Air Quality Information Transparency Index, Institute of Public & Environmental Affairs - http://www.ipe.org.cn/upload/report-aqti-en.pdf [12] Jacob, S., “Facts of Car Pollution”, 2010. http://www.livestrong.com/article/156537-facts-of-car-po llution/ [13] National Geographic News: http://news.nationalgeographic.com/news/2007/07/07070 9-china-pollution.html [14] Plumer, B., “Air Pollution now Kills more than High cholesterol,” 2012. http://www.washingtonpost.com/blogs/wonkblog/wp/201 2/12/20/air-pollution-now-kills-more-people-than-high-ch olesterol/ [15] Jean-Paul Rodrigue, “The Geography of Transport Sys- tems,” 3rd Edition, 2013. [16] Environmental Pollution Centers [17] NAAQs for criteria pollutants - http://epa.gov/air/criteria.html [18] EPA-outdoor Air-industry,business, and home: Dry Cleaning Operations - Additional information, available at: http://www.epa.gov/oaqps001/community/details/dryclea ning_addl_info.html#activity2 [19] EPA- Air Toxics Health Effects Notebook, available at http://www.epa.gov/ttn/atw/hlthef/tet-ethy.html [20] Chemicals used in drycleaning operations report, Bill Linn, Florida Department of Environmental Protection Copyright © 2013 SciRes. CWEEE  B. KURA ET AL. Copyright © 2013 SciRes. CWEEE 9 (FDEP), Scott Stupak, North Carolina Superfund Section, provided technical support for database development, January 2002, Revised July 2009 [21] NBC news, available at: http://www.nbcnews.com/id/ 16816627/ns/us_news-environment/t/calif-air-regulators- ban-dry-cleaning-chemical/#.USQcPB0skuA [22] Prof. Paul Roepe, GeorgetownUniversity, available at: http://www.georgetown.edu/story/dry-cleaning-study .htm l |

