 CellBio, 2013, 2, 73-95 http://dx.doi.org/10.4236/cellbio.2013.22010 Published Online June 2013 (http://www.scirp.org/journal/cellbio) Intracellular Notch1 May I nduce a Conformational Change in CSL/DNA, without Forming ICN1/CSL/DNA Molecular Complex, in Vitr o Alexei A. Stortchevoi* Department of Pathology, Yale University, New Haven, USA Email: alexei.stortchevoi@yale.edu Received November 25, 2012; revised December 26, 2012; accepted January 10, 2013 Copyright © 2013 Alexei A. Stortchevoi. This is an open access article distributed under the Creative Commons Attribution License, which permits unrestricted use, distribution, and reproduction in any medium, provided the original work is properly cited. ABSTRACT Intracellular Notch (ICN) initiates DNA transcription in cooperation with CSL that acts as repressor in the absence of ICN. The ICN mediates recruitment of MAML protein, leading to the formation of minimal transcriptional complex, MAML/ICN/CSL/DNA. Crystal structure reveals that different conformations exist between the free (CSL/DNA) and bound (ICN/MAML/CSL/DNA) forms. The significance of this modulation of the CSL/DNA molecular complex can be better understood by experimental approaches that aim to elucidate the cause and timing of these events. There are four orthologues of human ICN (ICN1-4). We studied interactions between human full-length ICN1 and CSL/DNA without involvement of MAML, in vitro, and found that 1) the EMSA profile of CSL/DNA is altered in the presence of ICN1 as a consequence of an intrinsic change(s) in CSL/DNA, and not due to the formation of an ICN/CSL/DNA mo- lecular complex; 2) ICN1 destabilizes CSL/DNA. These findings indicate that human ICN1 functions to modulate the CSL/DNA molecular complex for subsequent recruitment of MAML, and that modulated CSL/DNA cannot accommo- date ICN1 in the absence of MAML. The latter in turn, implies that the formation of the MAML/ICN1/CSL/DNA is likely to be a collective event, wherein preassembly of MAML and ICN1 as a binary complex co-localizes at the CSL/DNA promoter site, or the MAML/ICN1/CSL complex is pre-assembled prior to binding to the promoter, rather than ICN1 arriving at CSL/DNA ahead of MAML and/or other associated transcription factors. The novel finding that ICN1 destabilizes the CSL/DNA complex opens new possibilities of transcriptional regulation by Notch. Keywords: CBF1; CSL; Hes1 Promoter; Notch; RbpJ; Su(H) 1. Introduction Notch is a transmembrane receptor protein that controls numerous developmental decisions through binding of ligands displayed on the surface of adjacent cells. Notch signaling pathway regulates cell fate decisions in neuro- genesis [1], T cell development [2] and hypoxia [3] and has been implicated in multiple cross talks with major pathways that influence cell proliferation, differentiation, survival and migration [4]. Aberrations in Notch recep- tors have been linked to malignancies [5-9], and lately, the components of Notch signal transduction have been targeted in anti-cancer drug development [10-12]. Upon ligand binding, the Notch receptor is proteolyti- cally cleaved at the membrane site, and intracellular Notch (ICN) migrates to the nucleus, where it interacts with various promoters to stimulate transcription in co- operation with transcription factor CSL (also known as RBP-J, CBF1, Su(H) and LAG-1), reviewed [13-15]. In the absence of ICN, CSL acts as a transcriptional repres- sor, bound at the promoter to “GTGGGAAA” CSL spe- cific sequence. The ICN has not been found to bind di- rectly to DNA but its RAM domain (RAM = RBP-J As- sociating Molecule) and Ankyrin domain (ANK) interact with CSL [16]. Transcriptional repression by CSL is re- portedly achieved through recruitment of histone deace- tylase complexes, SMRT/mSin3A/HDAC-1 or NCor/ nSin3A/HDAC-1 [17], CIR/SAP30/HADC-2 [18] or SHARP/CtIP [19] to a gene promoter site and compact- ing of the chromatin. It is believed that ICN1 plays an important role in displacing the co-repressor complexes, allowing the chromatinized DNA to unfold and thus fa- *Current address: Department of Genetics, Harvard Medical School, Center for Human Genetic Research, Massachusetts General Hospital’s Richard B. Simches Research Center, Boston, USA.
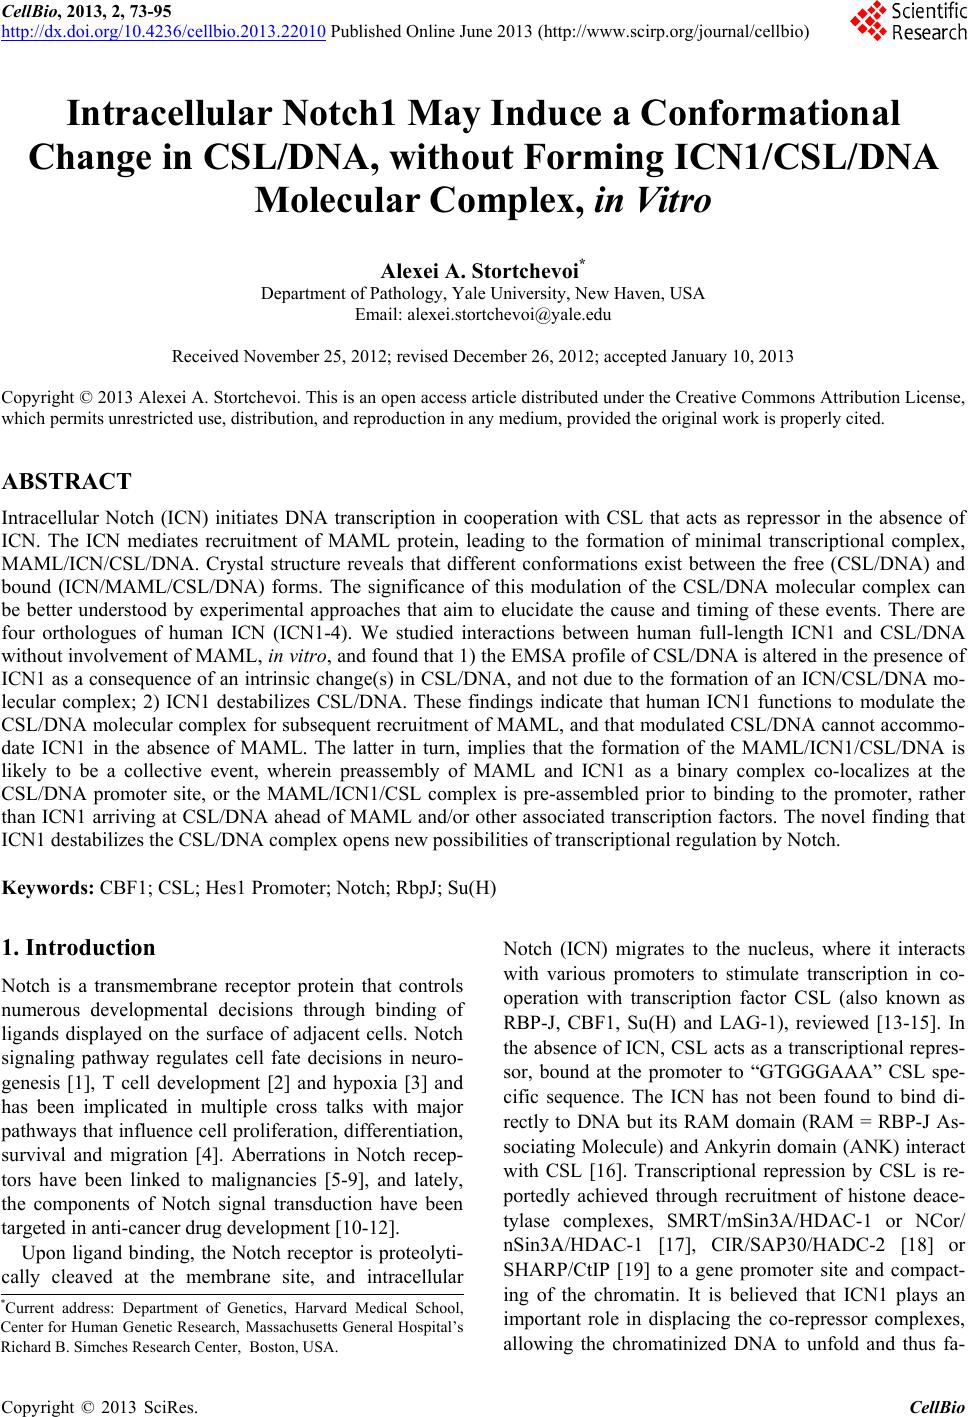
C opyright © 2013 SciRes. CellBio 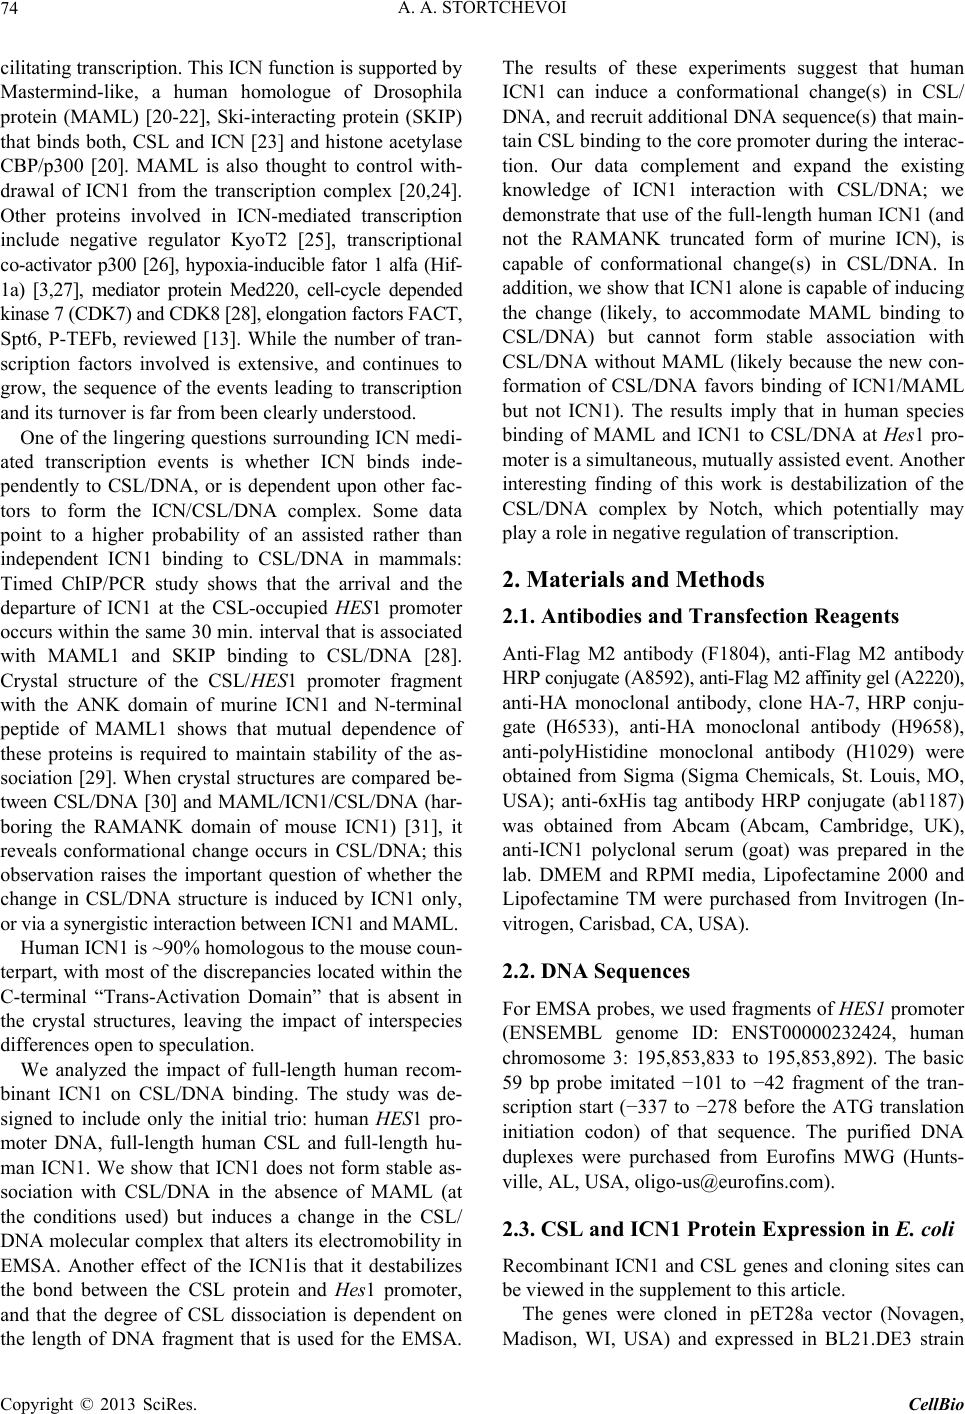 A. A. STORTCHEVOI 74 cilitating transcription. This ICN function is supported by Mastermind-like, a human homologue of Drosophila protein (MAML) [20-22], Ski-interacting protein (SKIP) that binds both, CSL and ICN [23] and histone acetylase CBP/p300 [20]. MAML is also thought to control with- drawal of ICN1 from the transcription complex [20,24]. Other proteins involved in ICN-mediated transcription include negative regulator KyoT2 [25], transcriptional co-activator p300 [26], hypoxia-inducible fator 1 alfa (Hif- 1a) [3,27], mediator protein Med220, cell-cycle depended kinase 7 (CDK7) and CDK8 [28], elongation factors FACT, Spt6, P-TEFb, reviewed [13]. While the number of tran- scription factors involved is extensive, and continues to grow, the sequence of the events leading to transcription and its turnover is far from been clearly understood. One of the lingering questions surrounding ICN medi- ated transcription events is whether ICN binds inde- pendently to CSL/DNA, or is dependent upon other fac- tors to form the ICN/CSL/DNA complex. Some data point to a higher probability of an assisted rather than independent ICN1 binding to CSL/DNA in mammals: Timed ChIP/PCR study shows that the arrival and the departure of ICN1 at the CSL-occupied HES1 promoter occurs within the same 30 min. interval that is associated with MAML1 and SKIP binding to CSL/DNA [28]. Crystal structure of the CSL/HES1 promoter fragment with the ANK domain of murine ICN1 and N-terminal peptide of MAML1 shows that mutual dependence of these proteins is required to maintain stability of the as- sociation [29]. When crystal structures are compared be- tween CSL/DNA [30] and MAML/ICN1/CSL/DNA (har- boring the RAMANK domain of mouse ICN1) [31], it reveals conformational change occurs in CSL/DNA; this observation raises the important question of whether the change in CSL/DNA structure is induced by ICN1 only, or via a synergistic interaction between ICN1 and MAML. Human ICN1 is ~90% homologous to the mouse coun- terpart, with most of the discrepancies located within the C-terminal “Trans-Activation Domain” that is absent in the crystal structures, leaving the impact of interspecies differences open to speculation. We analyzed the impact of full-length human recom- binant ICN1 on CSL/DNA binding. The study was de- signed to include only the initial trio: human HES1 pro- moter DNA, full-length human CSL and full-length hu- man ICN1. We show that ICN1 does not form stable as- sociation with CSL/DNA in the absence of MAML (at the conditions used) but induces a change in the CSL/ DNA molecular complex that alters its electromobility in EMSA. Another effect of the ICN1is that it destabilizes the bond between the CSL protein and Hes1 promoter, and that the degree of CSL dissociation is dependent on the length of DNA fragment that is used for the EMSA. The results of these experiments suggest that human ICN1 can induce a conformational change(s) in CSL/ DNA, and recruit additional DNA sequence(s) that main- tain CSL binding to the core promoter during the interac- tion. Our data complement and expand the existing knowledge of ICN1 interaction with CSL/DNA; we demonstrate that use of the full-length human ICN1 (and not the RAMANK truncated form of murine ICN), is capable of conformational change(s) in CSL/DNA. In addition, we show that ICN1 alone is capable of inducing the change (likely, to accommodate MAML binding to CSL/DNA) but cannot form stable association with CSL/DNA without MAML (likely because the new con- formation of CSL/DNA favors binding of ICN1/MAML but not ICN1). The results imply that in human species binding of MAML and ICN1 to CSL/DNA at Hes1 pro- moter is a simultaneous, mutually assisted event. Another interesting finding of this work is destabilization of the CSL/DNA complex by Notch, which potentially may play a role in negative regulation of transcription. 2. Materials and Methods 2.1. Antibodies and Transfection Reagents Anti-Flag M2 antibody (F1804), anti-Flag M2 antibody HRP conjugate (A8592), anti-Flag M2 affinity gel (A2220), anti-HA monoclonal antibody, clone HA-7, HRP conju- gate (H6533), anti-HA monoclonal antibody (H9658), anti-polyHistidine monoclonal antibody (H1029) were obtained from Sigma (Sigma Chemicals, St. Louis, MO, USA); anti-6xHis tag antibody HRP conjugate (ab1187) was obtained from Abcam (Abcam, Cambridge, UK), anti-ICN1 polyclonal serum (goat) was prepared in the lab. DMEM and RPMI media, Lipofectamine 2000 and Lipofectamine TM were purchased from Invitrogen (In- vitrogen, Carisbad, CA, USA). 2.2. DNA Sequences For EMSA probes, we used fragments of HES1 promoter (ENSEMBL genome ID: ENST00000232424, human chromosome 3: 195,853,833 to 195,853,892). The basic 59 bp probe imitated −101 to −42 fragment of the tran- scription start (−337 to −278 before the ATG translation initiation codon) of that sequence. The purified DNA duplexes were purchased from Eurofins MWG (Hunts- ville, AL, USA, oligo-us@eurofins.com). 2.3. CSL and ICN1 Protein Expression in E. coli Recombinant ICN1 and CSL genes and cloning sites can be viewed in the supplement to this article. The genes were cloned in pET28a vector (Novagen, Madison, WI, USA) and expressed in BL21.DE3 strain Copyright © 2013 SciRes. CellBio 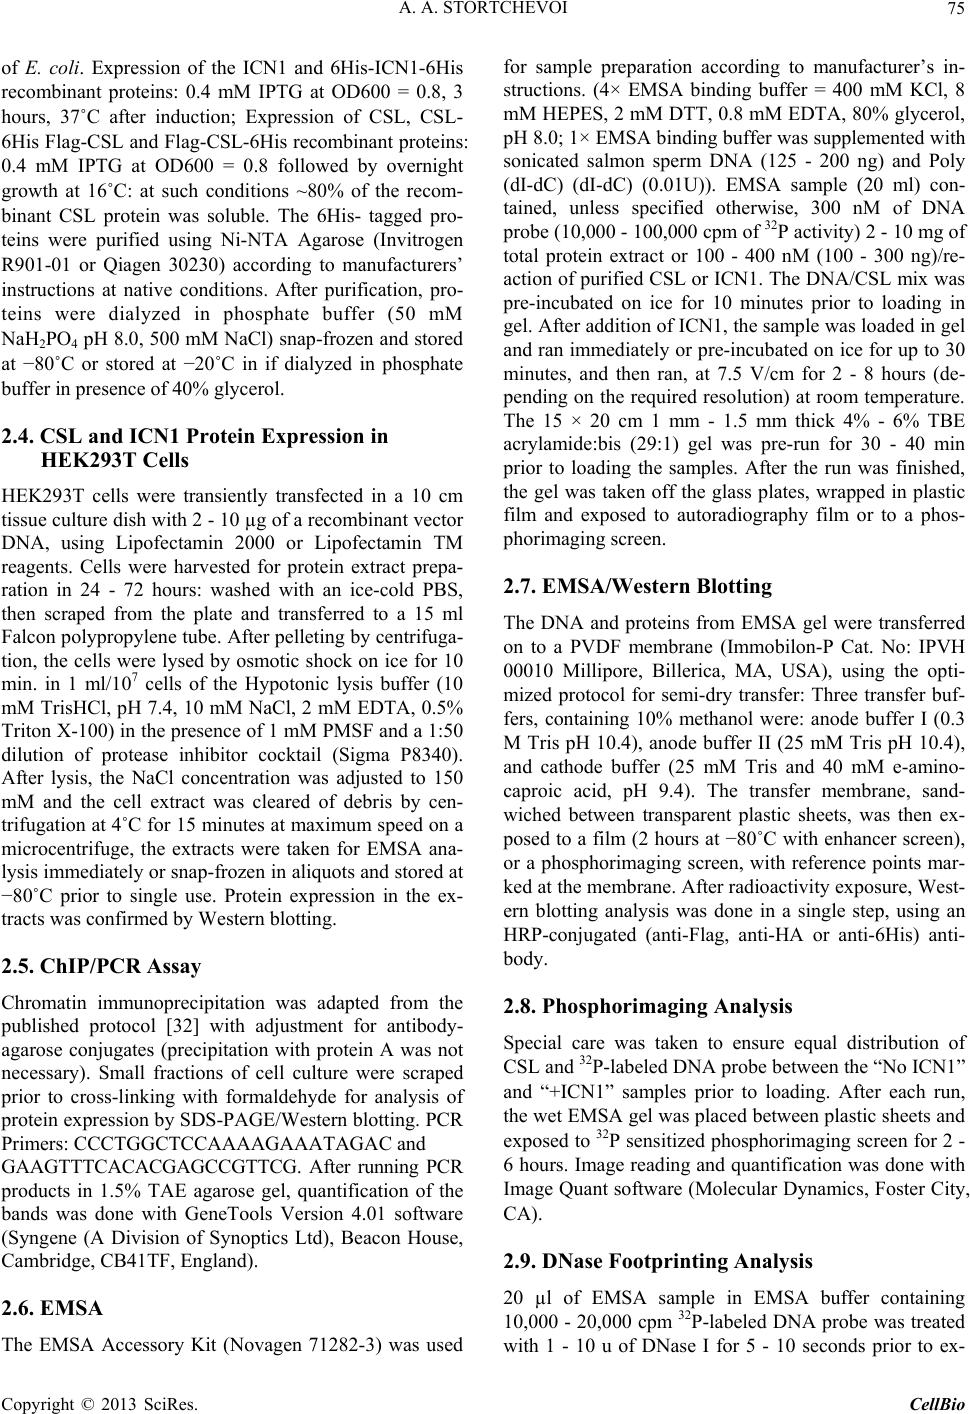 A. A. STORTCHEVOI 75 of E. coli. Expression of the ICN1 and 6His-ICN1-6His recombinant proteins: 0.4 mM IPTG at OD600 = 0.8, 3 hours, 37˚C after induction; Expression of CSL, CSL- 6His Flag-CSL and Flag-CSL-6His recombinant proteins: 0.4 mM IPTG at OD600 = 0.8 followed by overnight growth at 16˚C: at such conditions ~80% of the recom- binant CSL protein was soluble. The 6His- tagged pro- teins were purified using Ni-NTA Agarose (Invitrogen R901-01 or Qiagen 30230) according to manufacturers’ instructions at native conditions. After purification, pro- teins were dialyzed in phosphate buffer (50 mM NaH2PO4 pH 8.0, 500 mM NaCl) snap-frozen and stored at −80˚C or stored at −20˚C in if dialyzed in phosphate buffer in presence of 40% glycerol. 2.4. CSL and ICN1 Protein Expression in HEK293T Cells HEK293T cells were transiently transfected in a 10 cm tissue culture dish with 2 - 10 µg of a recombinant vector DNA, using Lipofectamin 2000 or Lipofectamin TM reagents. Cells were harvested for protein extract prepa- ration in 24 - 72 hours: washed with an ice-cold PBS, then scraped from the plate and transferred to a 15 ml Falcon polypropylene tube. After pelleting by centrifuga- tion, the cells were lysed by osmotic shock on ice for 10 min. in 1 ml/107 cells of the Hypotonic lysis buffer (10 mM TrisHCl, pH 7.4, 10 mM NaCl, 2 mM EDTA, 0.5% Triton X-100) in the presence of 1 mM PMSF and a 1:50 dilution of protease inhibitor cocktail (Sigma P8340). After lysis, the NaCl concentration was adjusted to 150 mM and the cell extract was cleared of debris by cen- trifugation at 4˚C for 15 minutes at maximum speed on a microcentrifuge, the extracts were taken for EMSA ana- lysis immediately or snap-frozen in aliquots and stored at −80˚C prior to single use. Protein expression in the ex- tracts was confirmed by Western blotting. 2.5. ChIP/PCR Assay Chromatin immunoprecipitation was adapted from the published protocol [32] with adjustment for antibody- agarose conjugates (precipitation with protein A was not necessary). Small fractions of cell culture were scraped prior to cross-linking with formaldehyde for analysis of protein expression by SDS-PAGE/Western blotting. PCR Primers: CCCTGGCTCCAAAAGAAATAGAC and GAAGTTTCACACGAGCCGTTCG. After running PCR products in 1.5% TAE agarose gel, quantification of the bands was done with GeneTools Version 4.01 software (Syngene (A Division of Synoptics Ltd), Beacon House, Cambridge, CB41TF, England). 2.6. EMSA The EMSA Accessory Kit (Novagen 71282-3) was used for sample preparation according to manufacturer’s in- structions. (4× EMSA binding buffer = 400 mM KCl, 8 mM HEPES, 2 mM DTT, 0.8 mM EDTA, 80% glycerol, pH 8.0; 1× EMSA binding buffer was supplemented with sonicated salmon sperm DNA (125 - 200 ng) and Poly (dI-dC) (dI-dC) (0.01U)). EMSA sample (20 ml) con- tained, unless specified otherwise, 300 nM of DNA probe (10,000 - 100,000 cpm of 32P activity) 2 - 10 mg of total protein extract or 100 - 400 nM (100 - 300 ng)/re- action of purified CSL or ICN1. The DNA/CSL mix was pre-incubated on ice for 10 minutes prior to loading in gel. After addition of ICN1, the sample was loaded in gel and ran immediately or pre-incubated on ice for up to 30 minutes, and then ran, at 7.5 V/cm for 2 - 8 hours (de- pending on the required resolution) at room temperature. The 15 × 20 cm 1 mm - 1.5 mm thick 4% - 6% TBE acrylamide:bis (29:1) gel was pre-run for 30 - 40 min prior to loading the samples. After the run was finished, the gel was taken off the glass plates, wrapped in plastic film and exposed to autoradiography film or to a phos- phorimaging screen. 2.7. EMSA/Western Blotting The DNA and proteins from EMSA gel were transferred on to a PVDF membrane (Immobilon-P Cat. No: IPVH 00010 Millipore, Billerica, MA, USA), using the opti- mized protocol for semi-dry transfer: Three transfer buf- fers, containing 10% methanol were: anode buffer I (0.3 M Tris pH 10.4), anode buffer II (25 mM Tris pH 10.4), and cathode buffer (25 mM Tris and 40 mM e-amino- caproic acid, pH 9.4). The transfer membrane, sand- wiched between transparent plastic sheets, was then ex- posed to a film (2 hours at −80˚C with enhancer screen), or a phosphorimaging screen, with reference points mar- ked at the membrane. After radioactivity exposure, West- ern blotting analysis was done in a single step, using an HRP-conjugated (anti-Flag, anti-HA or anti-6His) anti- body. 2.8. Phosphorimaging Analysis Special care was taken to ensure equal distribution of CSL and 32P-labeled DNA probe between the “No ICN1” and “+ICN1” samples prior to loading. After each run, the wet EMSA gel was placed between plastic sheets and exposed to 32P sensitized phosphorimaging screen for 2 - 6 hours. Image reading and quantification was done with Image Quant software (Molecular Dynamics, Foster City, CA). 2.9. DNase Footprinting Analysis 20 µl of EMSA sample in EMSA buffer containing 10,000 - 20,000 cpm 32P-labeled DNA probe was treated with 1 - 10 u of DNase I for 5 - 10 seconds prior to ex- Copyright © 2013 SciRes. CellBio 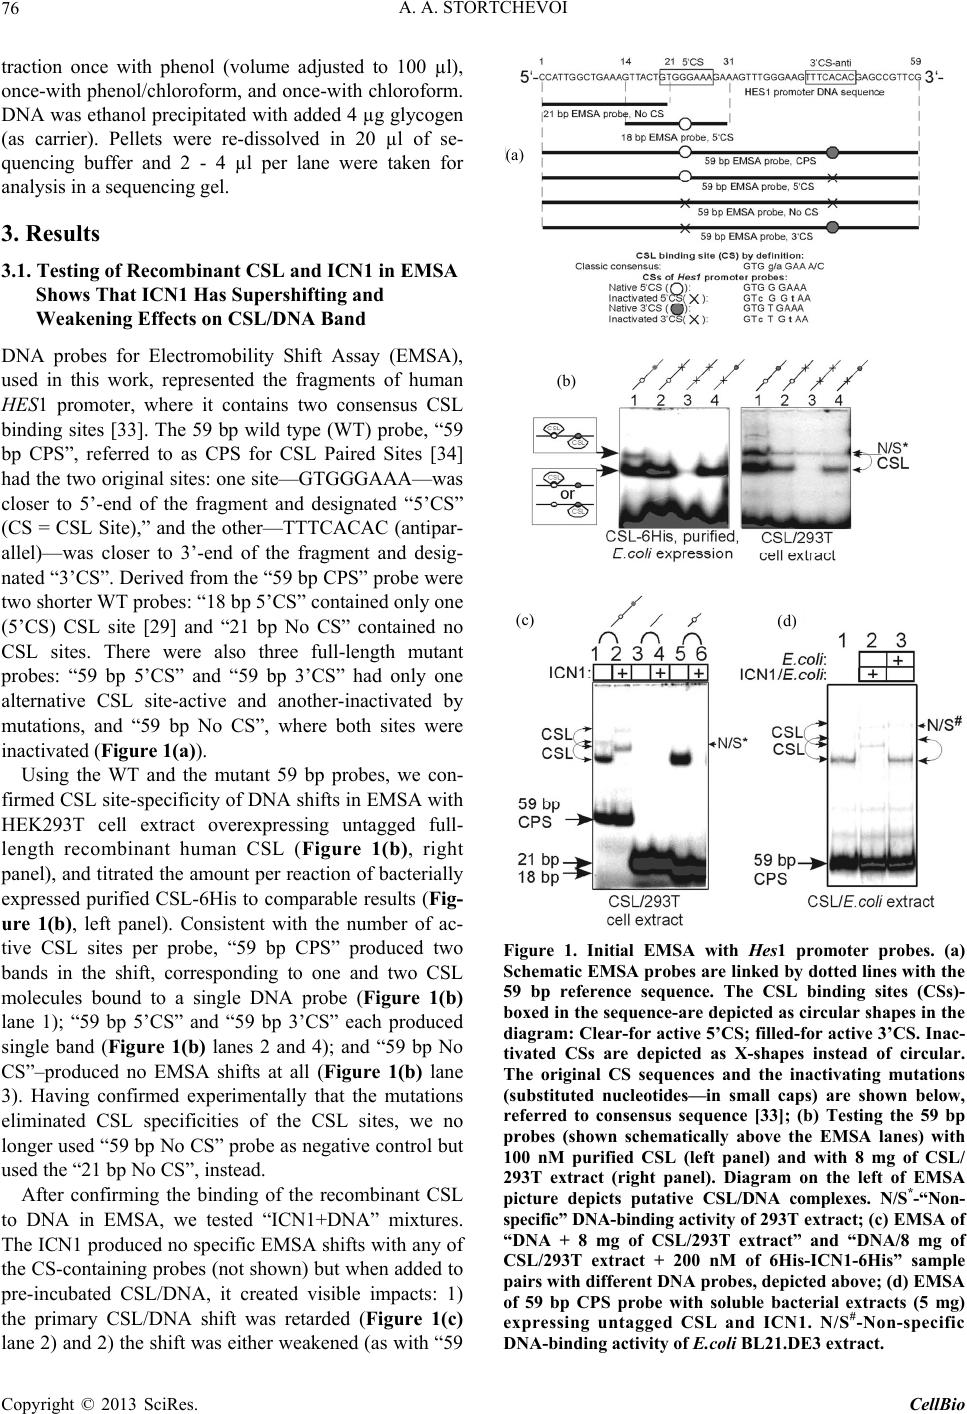 A. A. STORTCHEVOI 76 traction once with phenol (volume adjusted to 100 µl), once-with phenol/chloroform, and once-with chloroform. DNA was ethanol precipitated with added 4 µg glycogen (as carrier). Pellets were re-dissolved in 20 µl of se- quencing buffer and 2 - 4 µl per lane were taken for analysis in a sequencing gel. (a) 3. Results 3.1. Testing of Recombinant CSL and ICN1 in EMSA Shows That ICN1 Has Supershifting and Weakening Effects on CSL/DNA Band DNA probes for Electromobility Shift Assay (EMSA), used in this work, represented the fragments of human HES1 promoter, where it contains two consensus CSL binding sites [33]. The 59 bp wild type (WT) probe, “59 bp CPS”, referred to as CPS for CSL Paired Sites [34] had the two original sites: one site—GTGGGAAA—was closer to 5’-end of the fragment and designated “5’CS” (CS = CSL Site),” and the other—TTTCACAC (antipar- allel)—was closer to 3’-end of the fragment and desig- nated “3’CS”. Derived from the “59 bp CPS” probe were two shorter WT probes: “18 bp 5’CS” contained only one (5’CS) CSL site [29] and “21 bp No CS” contained no CSL sites. There were also three full-length mutant probes: “59 bp 5’CS” and “59 bp 3’CS” had only one alternative CSL site-active and another-inactivated by mutations, and “59 bp No CS”, where both sites were inactivated (Figure 1(a)). (b) (c) (d) Using the WT and the mutant 59 bp probes, we con- firmed CSL site-specificity of DNA shifts in EMSA with HEK293T cell extract overexpressing untagged full- length recombinant human CSL (Figure 1(b), right panel), and titrated the amount per reaction of bacterially expressed purified CSL-6His to comparable results (Fig- ure 1(b), left panel). Consistent with the number of ac- tive CSL sites per probe, “59 bp CPS” produced two bands in the shift, corresponding to one and two CSL molecules bound to a single DNA probe (Figure 1(b) lane 1); “59 bp 5’CS” and “59 bp 3’CS” each produced single band (Figure 1(b) lanes 2 and 4); and “59 bp No CS”–produced no EMSA shifts at all (Figure 1(b) lane 3). Having confirmed experimentally that the mutations eliminated CSL specificities of the CSL sites, we no longer used “59 bp No CS” probe as negative control but used the “21 bp No CS”, instead. After confirming the binding of the recombinant CSL to DNA in EMSA, we tested “ICN1+DNA” mixtures. The ICN1 produced no specific EMSA shifts with any of the CS-containing probes (not shown) but when added to pre-incubated CSL/DNA, it created visible impacts: 1) the primary CSL/DNA shift was retarded (Figure 1(c) lane 2) and 2) the shift was either weakened (as with “59 Figure 1. Initial EMSA with Hes1 promoter probes. (a) Schematic EMSA probes are linke d by dotted lines with the 59 bp reference sequence. The CSL binding sites (CSs)- boxed in the sequence-are depicted as circular shapes in the diagram: Clear-for active 5’CS; filled-for active 3’CS. Inac- tivated CSs are depicted as X-shapes instead of circular. The original CS sequences and the inactivating mutations (substituted nucleotides—in small caps) are shown below, referred to consensus sequence [33]; (b) Testing the 59 bp probes (shown schematically above the EMSA lanes) with 100 nM purified CSL (left panel) and with 8 mg of CSL/ 293T extract (right panel). Diagram on the left of EMSA picture depicts putative CSL/DNA complexes. N/S*-“Non- specific” DNA-binding activity of 293T extract; (c) EMSA of “DNA + 8 mg of CSL/293T extract” and “DNA/8 mg of CSL/293T extract + 200 nM of 6His-ICN1-6His” sample pairs with different DNA probes, depicted above; (d) EMSA of 59 bp CPS probe with soluble bacterial extracts (5 mg) expressing untagged CSL and ICN1. N/S#-Non-specific DNA-binding activity of E.coli BL21.DE3 extract. Copyright © 2013 SciRes. CellBio 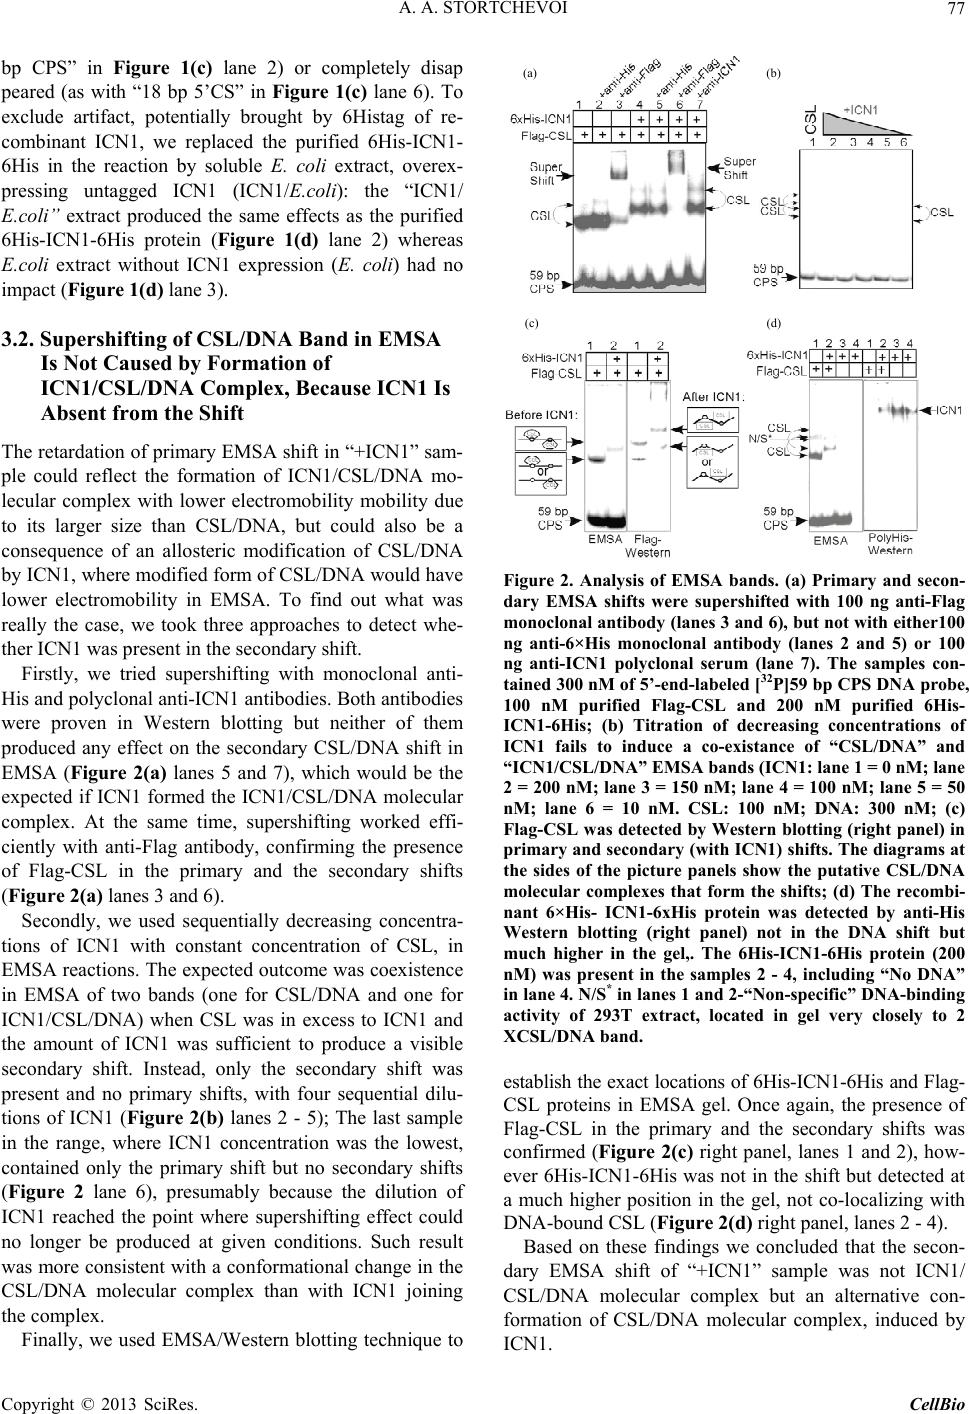 A. A. STORTCHEVOI 77 bp CPS” in Figure 1(c) lane 2) or completely disap peared (as with “18 bp 5’CS” in Figure 1(c) lane 6). To exclude artifact, potentially brought by 6Histag of re- combinant ICN1, we replaced the purified 6His-ICN1- 6His in the reaction by soluble E. coli extract, overex- pressing untagged ICN1 (ICN1/E.coli): the “ICN1/ E.coli” extract produced the same effects as the purified 6His-ICN1-6His protein (Figure 1(d) lane 2) whereas E.coli extract without ICN1 expression (E. coli) had no impact (Figure 1(d) lane 3). (a) (b) (c) (d) 3.2. Supershifting of CSL/DNA Band in EMSA Is Not Caused by Formation of ICN1/CSL/DNA Complex, Because ICN1 Is Absent from the Shift The retardation of primary EMSA shift in “+ICN1” sam- ple could reflect the formation of ICN1/CSL/DNA mo- lecular complex with lower electromobility mobility due to its larger size than CSL/DNA, but could also be a consequence of an allosteric modification of CSL/DNA by ICN1, where modified form of CSL/DNA would have lower electromobility in EMSA. To find out what was really the case, we took three approaches to detect whe- ther ICN1 was present in the secondary shift. Firstly, we tried supershifting with monoclonal anti- His and polyclonal anti-ICN1 antibodies. Both antibodies were proven in Western blotting but neither of them produced any effect on the secondary CSL/DNA shift in EMSA (Figure 2(a) lanes 5 and 7), which would be the expected if ICN1 formed the ICN1/CSL/DNA molecular complex. At the same time, supershifting worked effi- ciently with anti-Flag antibody, confirming the presence of Flag-CSL in the primary and the secondary shifts (Figure 2(a) lanes 3 and 6). Secondly, we used sequentially decreasing concentra- tions of ICN1 with constant concentration of CSL, in EMSA reactions. The expected outcome was coexistence in EMSA of two bands (one for CSL/DNA and one for ICN1/CSL/DNA) when CSL was in excess to ICN1 and the amount of ICN1 was sufficient to produce a visible secondary shift. Instead, only the secondary shift was present and no primary shifts, with four sequential dilu- tions of ICN1 (Figure 2(b) lanes 2 - 5); The last sample in the range, where ICN1 concentration was the lowest, contained only the primary shift but no secondary shifts (Figure 2 lane 6), presumably because the dilution of ICN1 reached the point where supershifting effect could no longer be produced at given conditions. Such result was more consistent with a conformational change in the CSL/DNA molecular complex than with ICN1 joining the complex. Finally, we used EMSA/Western blotting technique to Figure 2. Analysis of EMSA bands. (a) Primary and secon- dary EMSA shifts were supershifted with 100 ng anti-Flag monoclonal antibody (lanes 3 and 6), but not with either100 ng anti-6×His monoclonal antibody (lanes 2 and 5) or 100 ng anti-ICN1 polyclonal serum (lane 7). The samples con- tained 300 nM of 5’-end-labeled [32P]59 bp CPS DNA probe, 100 nM purified Flag-CSL and 200 nM purified 6His- ICN1-6His; (b) Titration of decreasing concentrations of ICN1 fails to induce a co-existance of “CSL/DNA” and “ICN1/CSL/DNA” EMSA bands (ICN1: lane 1 = 0 nM; lane 2 = 200 nM; lane 3 = 150 nM; lane 4 = 100 nM; lane 5 = 50 nM; lane 6 = 10 nM. CSL: 100 nM; DNA: 300 nM; (c) Flag-CSL was detected by Western blotting (right panel) in primary and secondary (with ICN1) shifts. The diagrams at the sides of the picture panels show the putative CSL/DNA molecular complexes that form the shifts; (d) The recombi- nant 6×His- ICN1-6xHis protein was detected by anti-His Western blotting (right panel) not in the DNA shift but much higher in the gel,. The 6His-ICN1-6His protein (200 nM) was present in the samples 2 - 4, including “No DNA” in lane 4. N/S* in lanes 1 and 2-“Non-specific” DNA-binding activity of 293T extract, located in gel very closely to 2 XCSL/DNA band. establish the exact locations of 6His-ICN1-6His and Flag- CSL proteins in EMSA gel. Once again, the presence of Flag-CSL in the primary and the secondary shifts was confirmed (Figure 2(c) right panel, lanes 1 and 2), how- ever 6His-ICN1-6His was not in the shift but detected at a much higher position in the gel, not co-localizing with DNA-bound CSL (Figure 2(d) right panel, lanes 2 - 4). Based on these findings we concluded that the secon- dary EMSA shift of “+ICN1” sample was not ICN1/ CSL/DNA molecular complex but an alternative con- formation of CSL/DNA molecular complex, induced by ICN1. Copyright © 2013 SciRes. CellBio 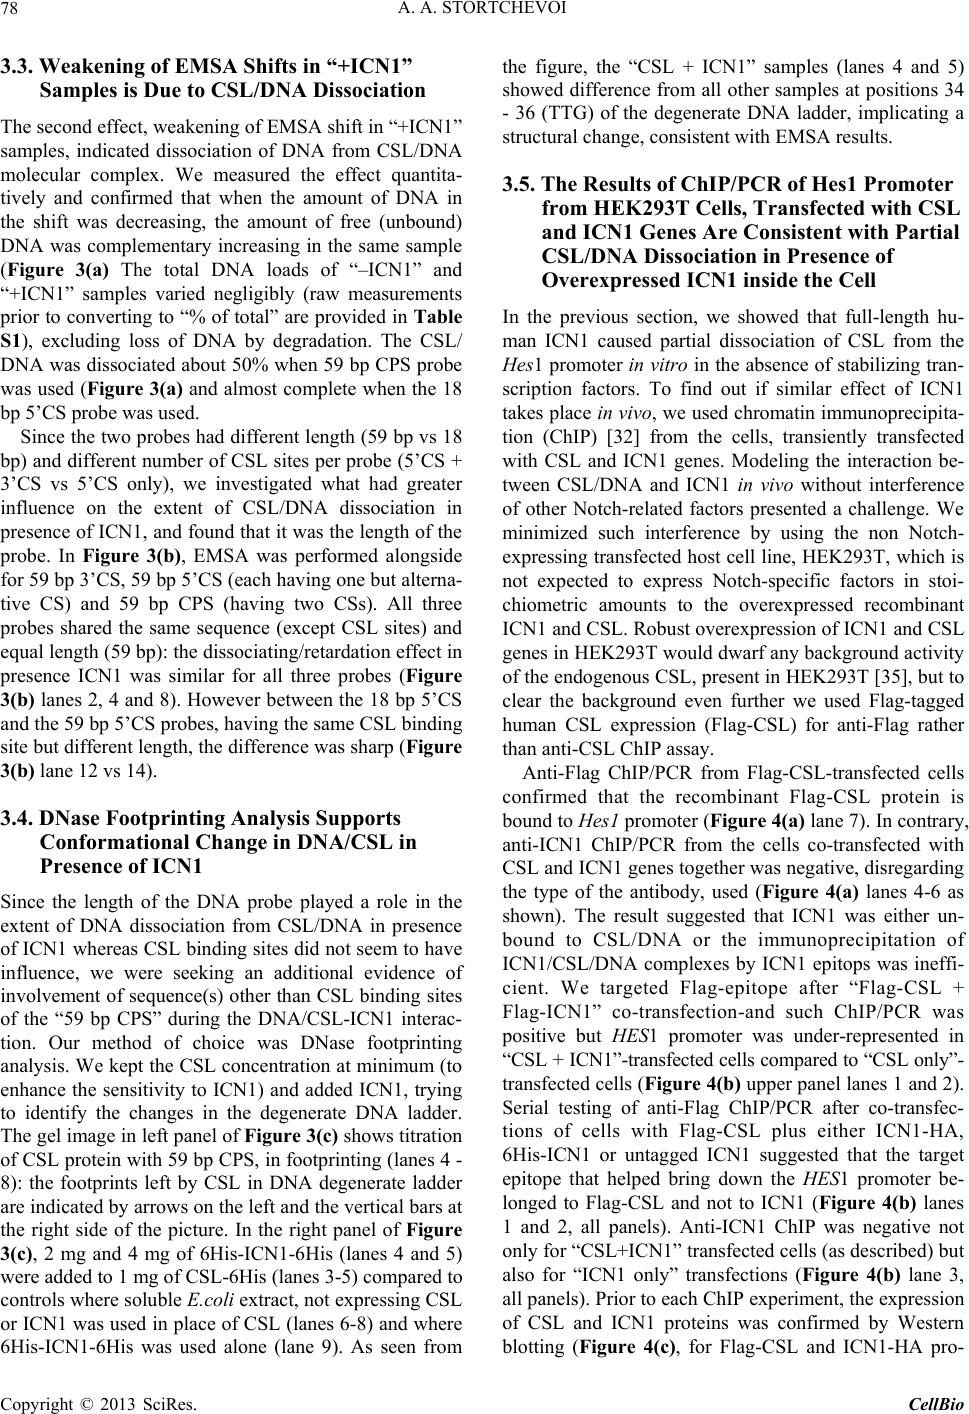 A. A. STORTCHEVOI 78 3.3. Weakening of EMSA Shifts in “+ICN1” Samples is Due to CSL/DNA Dissociation The second effect, weakening of EMSA shift in “+ICN1” samples, indicated dissociation of DNA from CSL/DNA molecular complex. We measured the effect quantita- tively and confirmed that when the amount of DNA in the shift was decreasing, the amount of free (unbound) DNA was complementary increasing in the same sample (Figure 3(a) The total DNA loads of “–ICN1” and “+ICN1” samples varied negligibly (raw measurements prior to converting to “% of total” are provided in Table S1), excluding loss of DNA by degradation. The CSL/ DNA was dissociated about 50% when 59 bp CPS probe was used (Figure 3(a) and almost complete when the 18 bp 5’CS probe was used. Since the two probes had different length (59 bp vs 18 bp) and different number of CSL sites per probe (5’CS + 3’CS vs 5’CS only), we investigated what had greater influence on the extent of CSL/DNA dissociation in presence of ICN1, and found that it was the length of the probe. In Figure 3(b), EMSA was performed alongside for 59 bp 3’CS, 59 bp 5’CS (each having one but alterna- tive CS) and 59 bp CPS (having two CSs). All three probes shared the same sequence (except CSL sites) and equal length (59 bp): the dissociating/retardation effect in presence ICN1 was similar for all three probes (Figure 3(b) lanes 2, 4 and 8). However between the 18 bp 5’CS and the 59 bp 5’CS probes, having the same CSL binding site but different length, the difference was sharp (Figure 3(b) lane 12 vs 14). 3.4. DNase Footprinting Analysis Supports Conformational Change in DNA/CSL in Presence of ICN1 Since the length of the DNA probe played a role in the extent of DNA dissociation from CSL/DNA in presence of ICN1 whereas CSL binding sites did not seem to have influence, we were seeking an additional evidence of involvement of sequence(s) other than CSL binding sites of the “59 bp CPS” during the DNA/CSL-ICN1 interac- tion. Our method of choice was DNase footprinting analysis. We kept the CSL concentration at minimum (to enhance the sensitivity to ICN1) and added ICN1, trying to identify the changes in the degenerate DNA ladder. The gel image in left panel of Figure 3(c) shows titration of CSL protein with 59 bp CPS, in footprinting (lanes 4 - 8): the footprints left by CSL in DNA degenerate ladder are indicated by arrows on the left and the vertical bars at the right side of the picture. In the right panel of Figure 3(c), 2 mg and 4 mg of 6His-ICN1-6His (lanes 4 and 5) were added to 1 mg of CSL-6His (lanes 3-5) compared to controls where soluble E.coli extract, not expressing CSL or ICN1 was used in place of CSL (lanes 6-8) and where 6His-ICN1-6His was used alone (lane 9). As seen from the figure, the “CSL + ICN1” samples (lanes 4 and 5) showed difference from all other samples at positions 34 - 36 (TTG) of the degenerate DNA ladder, implicating a structural change, consistent with EMSA results. 3.5. The Results of ChIP/PCR of Hes1 Promoter from HEK293T Cells, Transfected with CSL and ICN1 Genes Are Consistent with Partial CSL/DNA Dissociation in Presence of Overexpressed ICN1 inside the Cell In the previous section, we showed that full-length hu- man ICN1 caused partial dissociation of CSL from the Hes1 promoter in vitro in the absence of stabilizing tran- scription factors. To find out if similar effect of ICN1 takes place in vivo, we used chromatin immunoprecipita- tion (ChIP) [32] from the cells, transiently transfected with CSL and ICN1 genes. Modeling the interaction be- tween CSL/DNA and ICN1 in vivo without interference of other Notch-related factors presented a challenge. We minimized such interference by using the non Notch- expressing transfected host cell line, HEK293T, which is not expected to express Notch-specific factors in stoi- chiometric amounts to the overexpressed recombinant ICN1 and CSL. Robust overexpression of ICN1 and CSL genes in HEK293T would dwarf any background activity of the endogenous CSL, present in HEK293T [35], but to clear the background even further we used Flag-tagged human CSL expression (Flag-CSL) for anti-Flag rather than anti-CSL ChIP assay. Anti-Flag ChIP/PCR from Flag-CSL-transfected cells confirmed that the recombinant Flag-CSL protein is bound to Hes1 promoter (Figure 4(a) lane 7). In contrary, anti-ICN1 ChIP/PCR from the cells co-transfected with CSL and ICN1 genes together was negative, disregarding the type of the antibody, used (Figure 4(a) lanes 4-6 as shown). The result suggested that ICN1 was either un- bound to CSL/DNA or the immunoprecipitation of ICN1/CSL/DNA complexes by ICN1 epitops was ineffi- cient. We targeted Flag-epitope after “Flag-CSL + Flag-ICN1” co-transfection-and such ChIP/PCR was positive but HES1 promoter was under-represented in “CSL + ICN1”-transfected cells compared to “CSL only”- transfected cells (Figure 4(b) upper panel lanes 1 and 2). Serial testing of anti-Flag ChIP/PCR after co-transfec- tions of cells with Flag-CSL plus either ICN1-HA, 6His-ICN1 or untagged ICN1 suggested that the target epitope that helped bring down the HES1 promoter be- longed to Flag-CSL and not to ICN1 (Figure 4(b) lanes 1 and 2, all panels). Anti-ICN1 ChIP was negative not only for “CSL+ICN1” transfected cells (as described) but also for “ICN1 only” transfections (Figure 4(b) lane 3, all panels). Prior to each ChIP experiment, the expression of CSL and ICN1 proteins was confirmed by Western blotting (Figure 4(c), for Flag-CSL and ICN1-HA pro- Copyright © 2013 SciRes. CellBio 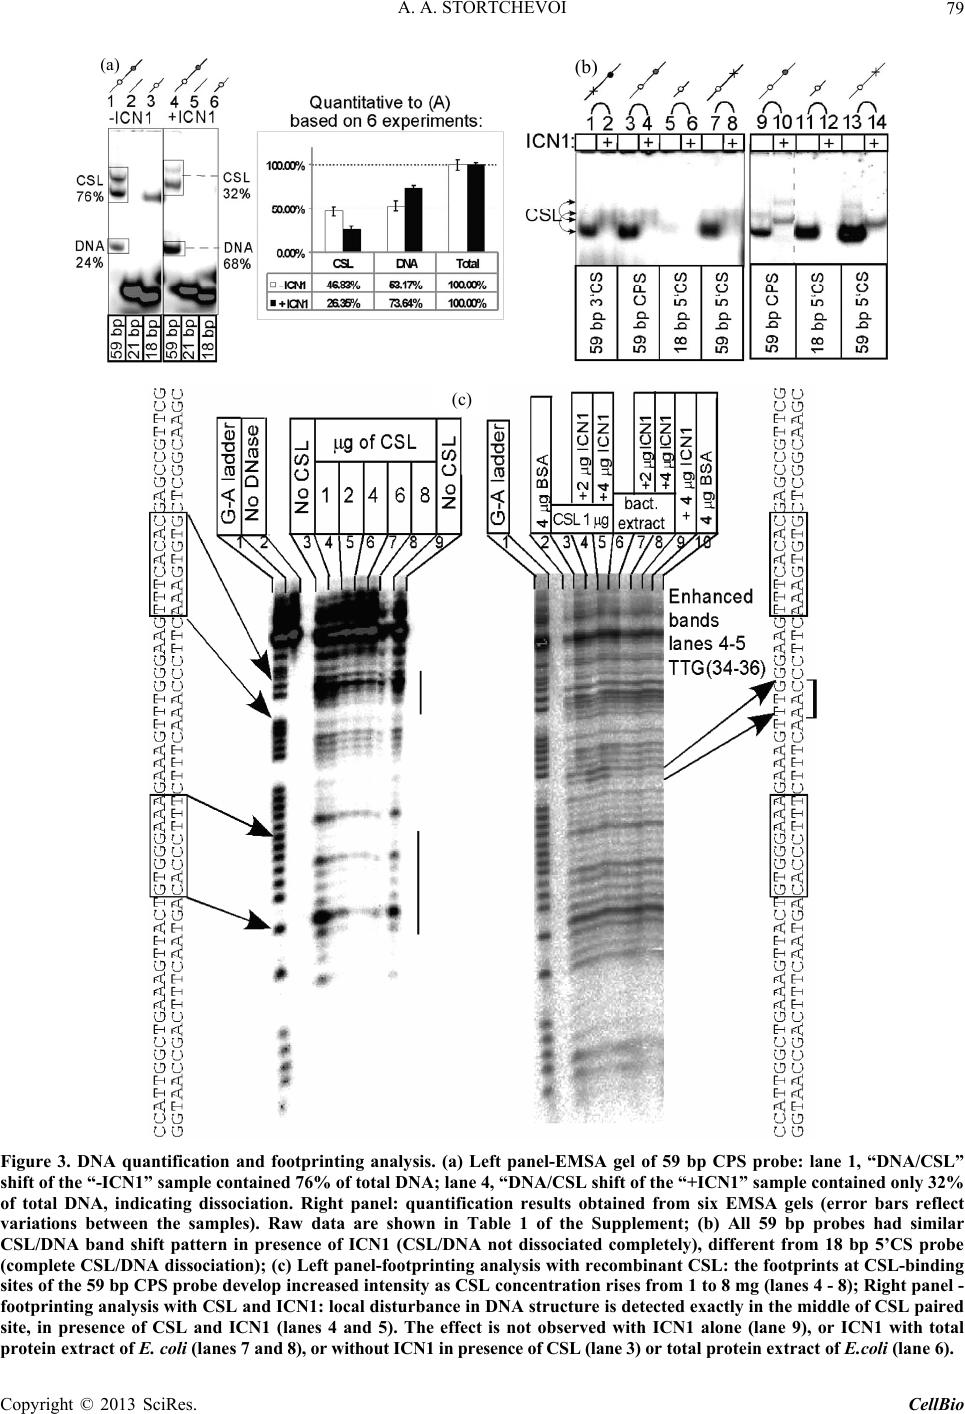 A. A. STORTCHEVOI Copyright © 2013 SciRes. CellBio 79 (a) (b) c (c) Figure 3. DNA quantification and footprinting analysis. (a) Left panel-EMSA gel of 59 bp CPS probe: lane 1, “DNA/CSL” shift of the “-ICN1” sample contained 76% of total DNA; lane 4, “DNA/CSL shift of the “+ICN1” sample contained only 32% of total DNA, indicating dissociation. Right panel: quantification results obtained from six EMSA gels (error bars reflect variations between the samples). Raw data are shown in Table 1 of the Supplement; (b) All 59 bp probes had similar CSL/DNA band shift pattern in presence of ICN1 (CSL/DNA not dissociated completely), different from 18 bp 5’CS probe (complete CSL/DNA dissociation); (c) Left panel-footprinting analy sis with recombinant CSL: the footprints at CSL-binding sites of the 59 bp CPS probe develop increased intensity as CSL concentration rises from 1 to 8 mg (lanes 4 - 8); Right panel - footprinting analysis with CSL and ICN1: local disturbance in DNA structure is detected exactly in the middle of CSL paired site, in presence of CSL and ICN1 (lanes 4 and 5). The effect is not observed with ICN1 alone (lane 9), or ICN1 with total protein extract of E. coli (lanes 7 and 8), or without ICN1 in presence of CSL (lane 3) or total protein extract of E.coli (lane 6). 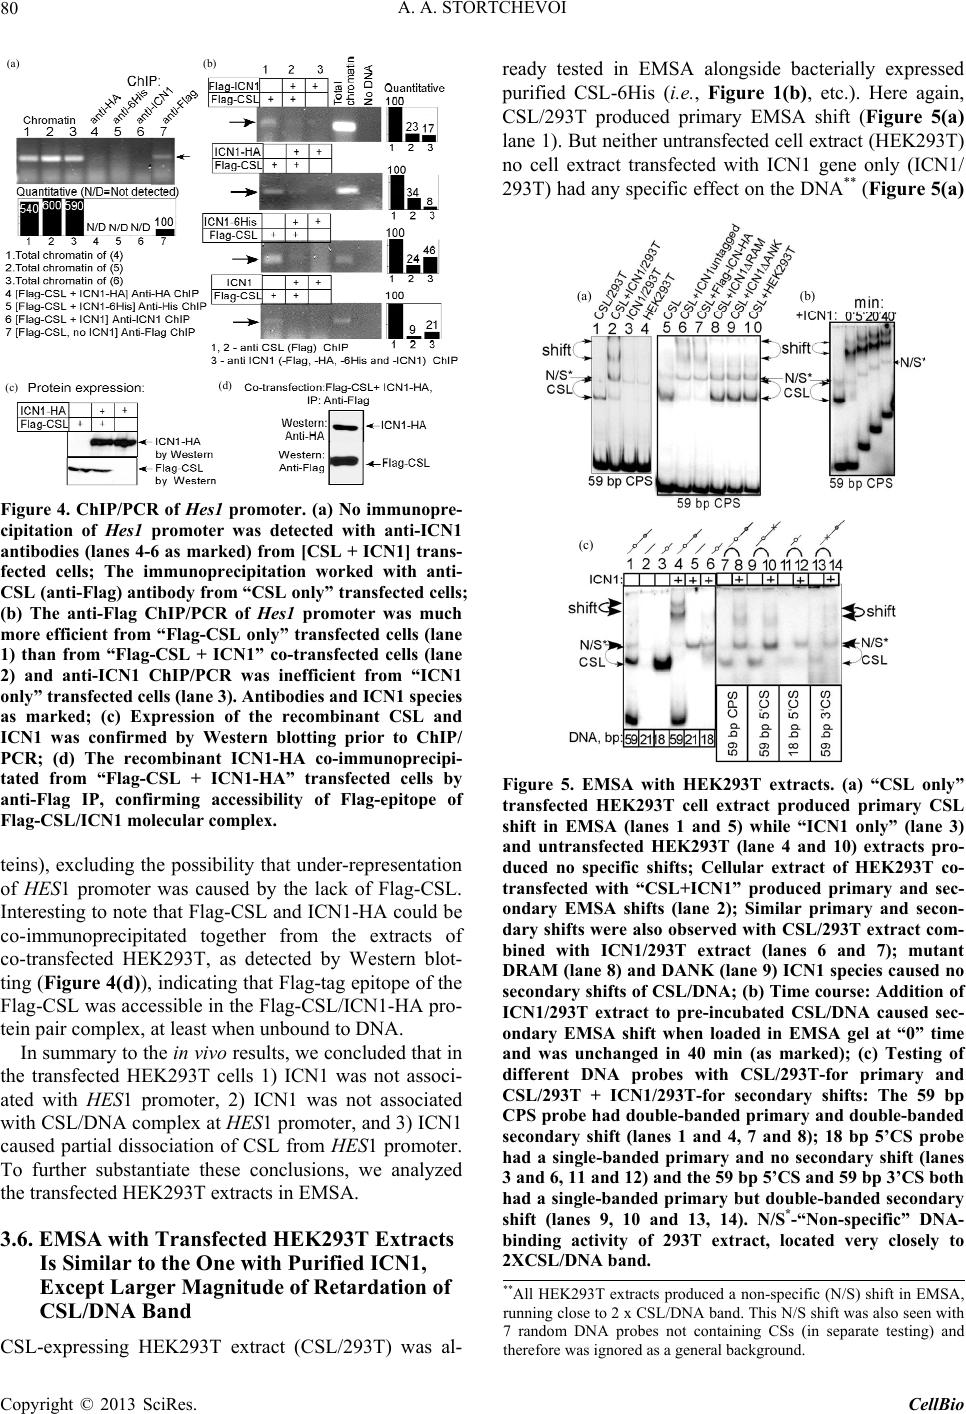 A. A. STORTCHEVOI 80 (a) (b) (c) (d) Figure 4. ChIP/PCR of Hes1 promoter. (a) No immunopre- cipitation of Hes1 promoter was detected with anti-ICN1 antibodies (lanes 4-6 as marked) from [CSL + ICN1] trans- fected cells; The immunoprecipitation worked with anti- CSL (anti-Flag) antibody from “CSL only” transfected cells; (b) The anti-Flag ChIP/PCR of Hes1 promoter was much more efficient from “Flag-CSL only” transfected cells (lane 1) than from “Flag-CSL + ICN1” co-transfected cells (lane 2) and anti-ICN1 ChIP/PCR was inefficient from “ICN1 only” transfected cells (lane 3). Antibodies and ICN1 species as marked; (c) Expression of the recombinant CSL and ICN1 was confirmed by Western blotting prior to ChIP/ PCR; (d) The recombinant ICN1-HA co-immunoprecipi- tated from “Flag-CSL + ICN1-HA” transfected cells by anti-Flag IP, confirming accessibility of Flag-epitope of Flag-CSL/ICN1 molecular complex. teins), excluding the possibility that under-representation of HES1 promoter was caused by the lack of Flag-CSL. Interesting to note that Flag-CSL and ICN1-HA could be co-immunoprecipitated together from the extracts of co-transfected HEK293T, as detected by Western blot- ting (Figure 4(d)), indicating that Flag-tag epitope of the Flag-CSL was accessible in the Flag-CSL/ICN1-HA pro- tein pair complex, at least when unbound to DNA. In summary to the in vivo results, we concluded that in the transfected HEK293T cells 1) ICN1 was not associ- ated with HES1 promoter, 2) ICN1 was not associated with CSL/DNA complex at HES1 promoter, and 3) ICN1 caused partial dissociation of CSL from HES1 promoter. To further substantiate these conclusions, we analyzed the transfected HEK293T extracts in EMSA. 3.6. EMSA with Transfected HEK293T Extracts Is Similar to the One with Purified ICN1, Except Larger Magnitude of Retardation of CSL/DNA Band CSL-expressing HEK293T extract (CSL/293T) was al- ready tested in EMSA alongside bacterially expressed purified CSL-6His (i.e., Figure 1(b), etc.). Here again, CSL/293T produced primary EMSA shift (Figure 5(a) lane 1). But neither untransfected cell extract (HEK293T) no cell extract transfected with ICN1 gene only (ICN1/ 293T) had any specific effect on the DNA** (Figure 5(a) (a) (b) (c) Figure 5. EMSA with HEK293T extracts. (a) “CSL only” produced a non-specific (N/S) shift in EMSA, transfected HEK293T cell extract produced primary CSL shift in EMSA (lanes 1 and 5) while “ICN1 only” (lane 3) and untransfected HEK293T (lane 4 and 10) extracts pro- duced no specific shifts; Cellular extract of HEK293T co- transfected with “CSL+ICN1” produced primary and sec- ondary EMSA shifts (lane 2); Similar primary and secon- dary shifts were also observed with CSL/293T extract com- bined with ICN1/293T extract (lanes 6 and 7); mutant DRAM (lane 8) and DANK (lane 9) ICN1 species caused no secondary shifts of CSL/DNA; (b) Time course: Addition of ICN1/293T extract to pre-incubated CSL/DNA caused sec- ondary EMSA shift when loaded in EMSA gel at “0” time and was unchanged in 40 min (as marked); (c) Testing of different DNA probes with CSL/293T-for primary and CSL/293T + ICN1/293T-for secondary shifts: The 59 bp CPS probe had double-bande d primary and double-banded secondary shift (lanes 1 and 4, 7 and 8); 18 bp 5’CS probe had a single-banded primary and no secondary shift (lanes 3 and 6, 11 and 12) and the 59 bp 5’CS and 59 bp 3’CS both had a single-banded primary but double-banded secondary shift (lanes 9, 10 and 13, 14). N/S*-“Non-specific” DNA- binding activity of 293T extract, located very closely to 2XCSL/DNA band. **All HEK293T extracts running close to 2 x CSL/DNA band. This N/S shift was also seen with 7 random DNA probes not containing CSs (in separate testing) and therefore was ignored as a general background. Copyright © 2013 SciRes. CellBio 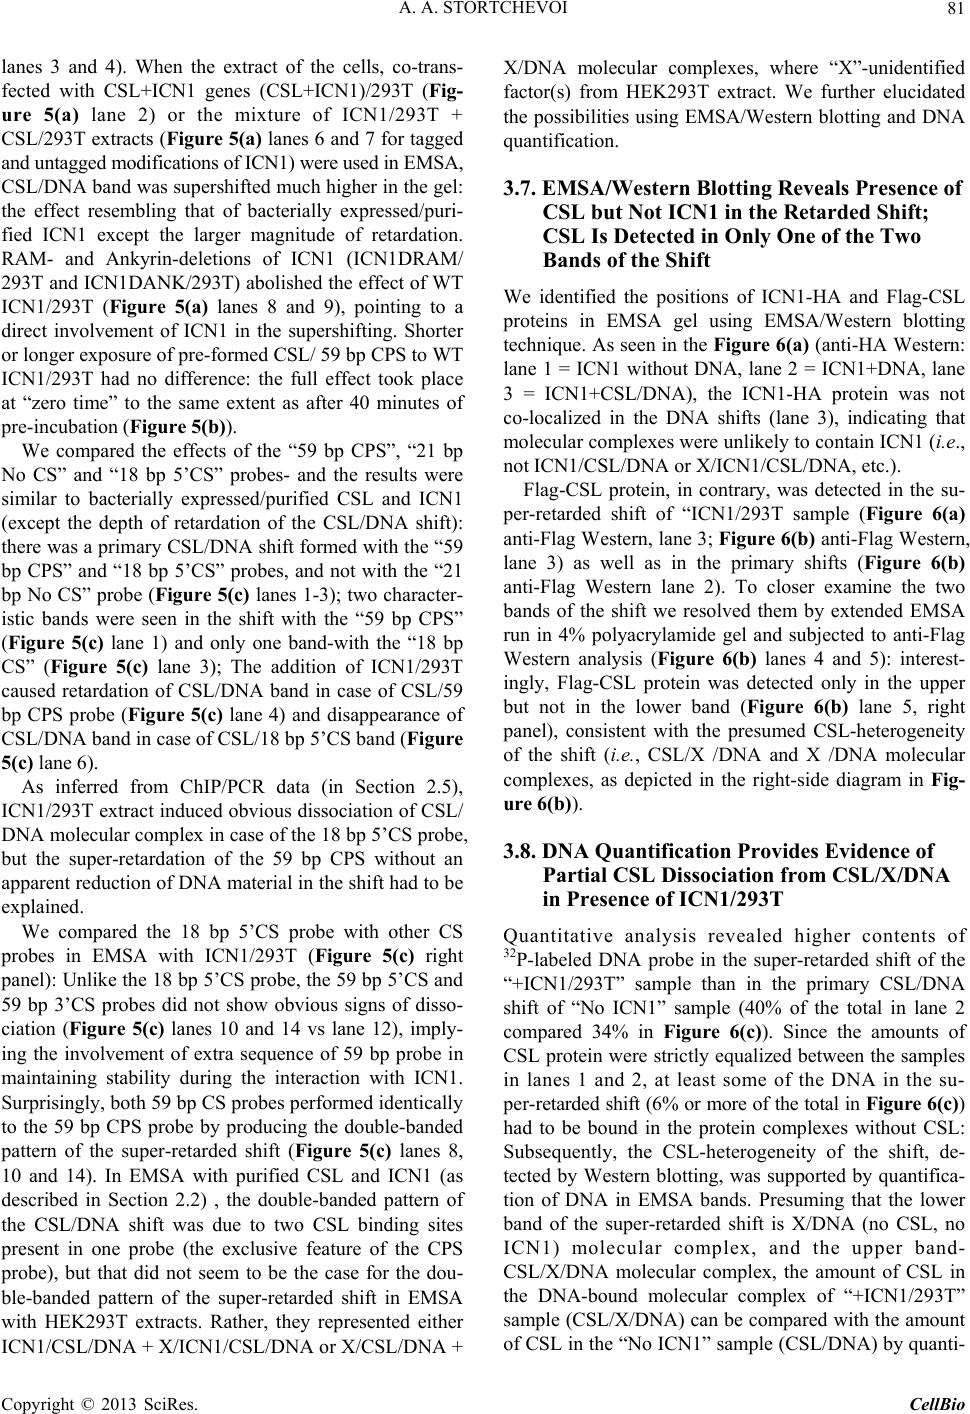 A. A. STORTCHEVOI 81 lanes 3 and 4). When the extract of the cells, co-trans- fected with CSL+ICN1 genes (CSL+ICN1)/293T (Fig- ure 5(a) lane 2) or the mixture of ICN1/293T + CSL/293T extracts (Figure 5(a) lanes 6 and 7 for tagged and untagged modifications of ICN1) were used in EMSA, CSL/DNA band was supershifted much higher in the gel: the effect resembling that of bacterially expressed/puri- fied ICN1 except the larger magnitude of retardation. RAM- and Ankyrin-deletions of ICN1 (ICN1DRAM/ 293T and ICN1DANK/293T) abolished the effect of WT ICN1/293T (Figure 5(a) lanes 8 and 9), pointing to a direct involvement of ICN1 in the supershifting. Shorter or longer exposure of pre-formed CSL/ 59 bp CPS to WT ICN1/293T had no difference: the full effect took place at “zero time” to the same extent as after 40 minutes of pre-incubation (Figure 5(b)). We compared the effects of the “59 bp CPS”, “21 bp No CS” and “18 bp 5’CS” probes- and the results were similar to bacterially expressed/purified CSL and ICN1 (except the depth of retardation of the CSL/DNA shift): there was a primary CSL/DNA shift formed with the “59 bp CPS” and “18 bp 5’CS” probes, and not with the “21 bp No CS” probe (Figure 5(c) lanes 1-3); two character- istic bands were seen in the shift with the “59 bp CPS” (Figure 5(c) lane 1) and only one band-with the “18 bp CS” (Figure 5(c) lane 3); The addition of ICN1/293T caused retardation of CSL/DNA band in case of CSL/59 bp CPS probe (Figure 5(c) lane 4) and disappearance of CSL/DNA band in case of CSL/18 bp 5’CS band (Figure 5(c) lane 6). As inferred from ChIP/PCR data (in Section 2.5), ICN1/293T extract induced obvious dissociation of CSL/ DNA molecular complex in case of the 18 bp 5’CS probe, but the super-retardation of the 59 bp CPS without an apparent reduction of DNA material in the shift had to be explained. We compared the 18 bp 5’CS probe with other CS probes in EMSA with ICN1/293T (Figure 5(c) right panel): Unlike the 18 bp 5’CS probe, the 59 bp 5’CS and 59 bp 3’CS probes did not show obvious signs of disso- ciation (Figure 5(c) lanes 10 and 14 vs lane 12), imply- ing the involvement of extra sequence of 59 bp probe in maintaining stability during the interaction with ICN1. Surprisingly, both 59 bp CS probes performed identically to the 59 bp CPS probe by producing the double-banded pattern of the super-retarded shift (Figure 5(c) lanes 8, 10 and 14). In EMSA with purified CSL and ICN1 (as described in Section 2.2) , the double-banded pattern of the CSL/DNA shift was due to two CSL binding sites present in one probe (the exclusive feature of the CPS probe), but that did not seem to be the case for the dou- ble-banded pattern of the super-retarded shift in EMSA with HEK293T extracts. Rather, they represented either ICN1/CSL/DNA + X/ICN1/CSL/DNA or X/CSL/DNA + X/DNA molecular complexes, where “X”-unidentified factor(s) from HEK293T extract. We further elucidated the possibilities using EMSA/Western blotting and DNA quantification. 3.7. EMSA/Western Blotting Reveals Presence of CSL but Not ICN1 in the Retarded Shift; CSL Is Detected in Only One of the Two Bands of the Shift We identified the positions of ICN1-HA and Flag-CSL proteins in EMSA gel using EMSA/Western blotting technique. As seen in the Figure 6(a) (anti-HA Western: lane 1 = ICN1 without DNA, lane 2 = ICN1+DNA, lane 3 = ICN1+CSL/DNA), the ICN1-HA protein was not co-localized in the DNA shifts (lane 3), indicating that molecular complexes were unlikely to contain ICN1 (i.e., not ICN1/CSL/DNA or X/ICN1/CSL/DNA, etc.). Flag-CSL protein, in contrary, was detected in the su- per-retarded shift of “ICN1/293T sample (Figure 6(a) anti-Flag Western, lane 3; Figure 6(b) anti-Flag Western, lane 3) as well as in the primary shifts (Figure 6(b) anti-Flag Western lane 2). To closer examine the two bands of the shift we resolved them by extended EMSA run in 4% polyacrylamide gel and subjected to anti-Flag Western analysis (Figure 6(b) lanes 4 and 5): interest- ingly, Flag-CSL protein was detected only in the upper but not in the lower band (Figure 6(b) lane 5, right panel), consistent with the presumed CSL-heterogeneity of the shift (i.e., CSL/X /DNA and X /DNA molecular complexes, as depicted in the right-side diagram in Fig- ure 6(b)). 3.8. DNA Quantification Provides Evidence of Partial CSL Dissociation from CSL/X/DNA in Presence of ICN1/293T Quantitative analysis revealed higher contents of 32P-labeled DNA probe in the super-retarded shift of the “+ICN1/293T” sample than in the primary CSL/DNA shift of “No ICN1” sample (40% of the total in lane 2 compared 34% in Figure 6(c)). Since the amounts of CSL protein were strictly equalized between the samples in lanes 1 and 2, at least some of the DNA in the su- per-retarded shift (6% or more of the total in Figure 6(c)) had to be bound in the protein complexes without CSL: Subsequently, the CSL-heterogeneity of the shift, de- tected by Western blotting, was supported by quantifica- tion of DNA in EMSA bands. Presuming that the lower band of the super-retarded shift is X/DNA (no CSL, no ICN1) molecular complex, and the upper band- CSL/X/DNA molecular complex, the amount of CSL in the DNA-bound molecular complex of “+ICN1/293T” sample (CSL/X/DNA) can be compared with the amount of CSL in the “No ICN1” sample (CSL/DNA) by quanti- Copyright © 2013 SciRes. CellBio 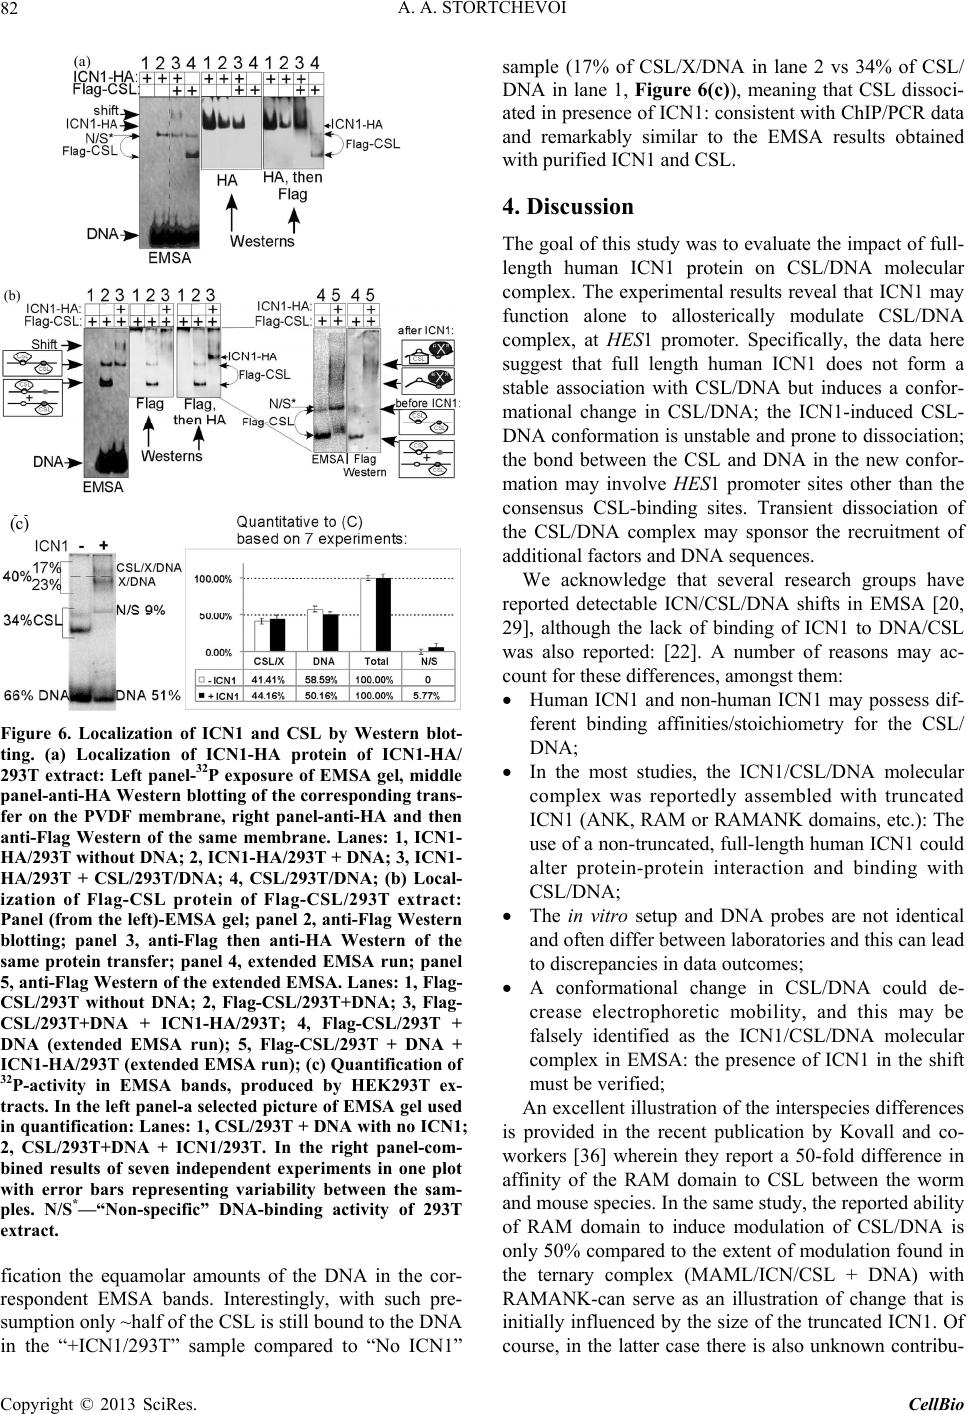 A. A. STORTCHEVOI 82 (a) (b) (c) Figure 6. Localization of ICN1 and CSL by Western blot- ting. (a) Localization of ICN1-HA protein of ICN1-HA/ 293T extract: Left panel-32P exposure of EMSA gel, middle panel-anti-HA Western blotting of the corresponding trans in the “+ICN1/293T” sample compared to “No ICN1” mple (17% of CSL/X/DNA in lane 2 vs 34% of CSL/ sults reveal that ICN1 may o allosterically modulate CSL/DNA 1 promoter. Specifically, the data here : ith truncated rotein-protein interaction and binding with mobility, and this may be the same study, the reported ability of - fer on the PVDF membrane, right panel-anti-HA and then anti-Flag Western of the same membrane. Lanes: 1, ICN1- HA/293T without DNA; 2, ICN1-HA/293T + DNA; 3, ICN1- HA/293T + CSL/293T/DNA; 4, CSL/293T/DNA; (b) Local- ization of Flag-CSL protein of Flag-CSL/293T extract: Panel (from the left)-EMSA gel; panel 2, anti-Flag Western blotting; panel 3, anti-Flag then anti-HA Western of the same protein transfer; panel 4, extended EMSA run; panel 5, anti-Flag Western of the extended EMSA. Lanes: 1, Flag- CSL/293T without DNA; 2, Flag-CSL/293T+DNA; 3, Flag- CSL/293T+DNA + ICN1-HA/293T; 4, Flag-CSL/293T + DNA (extended EMSA run); 5, Flag-CSL/293T + DNA + ICN1-HA/293T (extended EMSA run); (c) Quantification of 32P-activity in EMSA bands, produced by HEK293T ex- tracts. In the left panel-a selected picture of EMSA gel used in quantification: Lanes: 1, CSL/293T + DNA with no ICN1; 2, CSL/293T+DNA + ICN1/293T. In the right panel-com- bined results of seven independent experiments in one plot with error bars representing variability between the sam- ples. N/S*—“Non-specific” DNA-binding activity of 293T extract. fication the equamolar amounts of the DNA in the cor- respondent EMSA bands. Interestingly, with such pre- sumption only ~half of the CSL is still bound to the DNA sa DNA in lane 1, Figure 6(c)), meaning that CSL dissoci- ated in presence of ICN1: consistent with ChIP/PCR data and remarkably similar to the EMSA results obtained with purified ICN1 and CSL. 4. Discussion The goal of this study was to evaluate the impact of full- length human ICN1 protein on CSL/DNA molecular complex. The experimental re function alone t complex, at HES suggest that full length human ICN1 does not form a stable association with CSL/DNA but induces a confor- mational change in CSL/DNA; the ICN1-induced CSL- DNA conformation is unstable and prone to dissociation; the bond between the CSL and DNA in the new confor- mation may involve HES1 promoter sites other than the consensus CSL-binding sites. Transient dissociation of the CSL/DNA complex may sponsor the recruitment of additional factors and DNA sequences. We acknowledge that several research groups have reported detectable ICN/CSL/DNA shifts in EMSA [20, 29], although the lack of binding of ICN1 to DNA/CSL was also reported: [22]. A number of reasons may ac- count for these differences, amongst them Human ICN1 and non-human ICN1 may possess dif- ferent binding affinities/stoichiometry for the CSL/ DNA; In the most studies, the ICN1/CSL/DNA molecular complex was reportedly assembled w ICN1 (ANK, RAM or RAMANK domains, etc.): The use of a non-truncated, full-length human ICN1 could alter p CSL/DNA; The in vitro setup and DNA probes are not identical and often differ between laboratories and this can lead to discrepancies in data outcomes; A conformational change in CSL/DNA could de- crease electrophoretic falsely identified as the ICN1/CSL/DNA molecular complex in EMSA: the presence of ICN1 in the shift must be verified; An excellent illustration of the interspecies differences is provided in the recent publication by Kovall and co- workers [36] wherein they report a 50-fold difference in affinity of the RAM domain to CSL between the worm and mouse species. In RAM domain to induce modulation of CSL/DNA is only 50% compared to the extent of modulation found in the ternary complex (MAML/ICN/CSL + DNA) with RAMANK-can serve as an illustration of change that is initially influenced by the size of the truncated ICN1. Of course, in the latter case there is also unknown contribu- Copyright © 2013 SciRes. CellBio 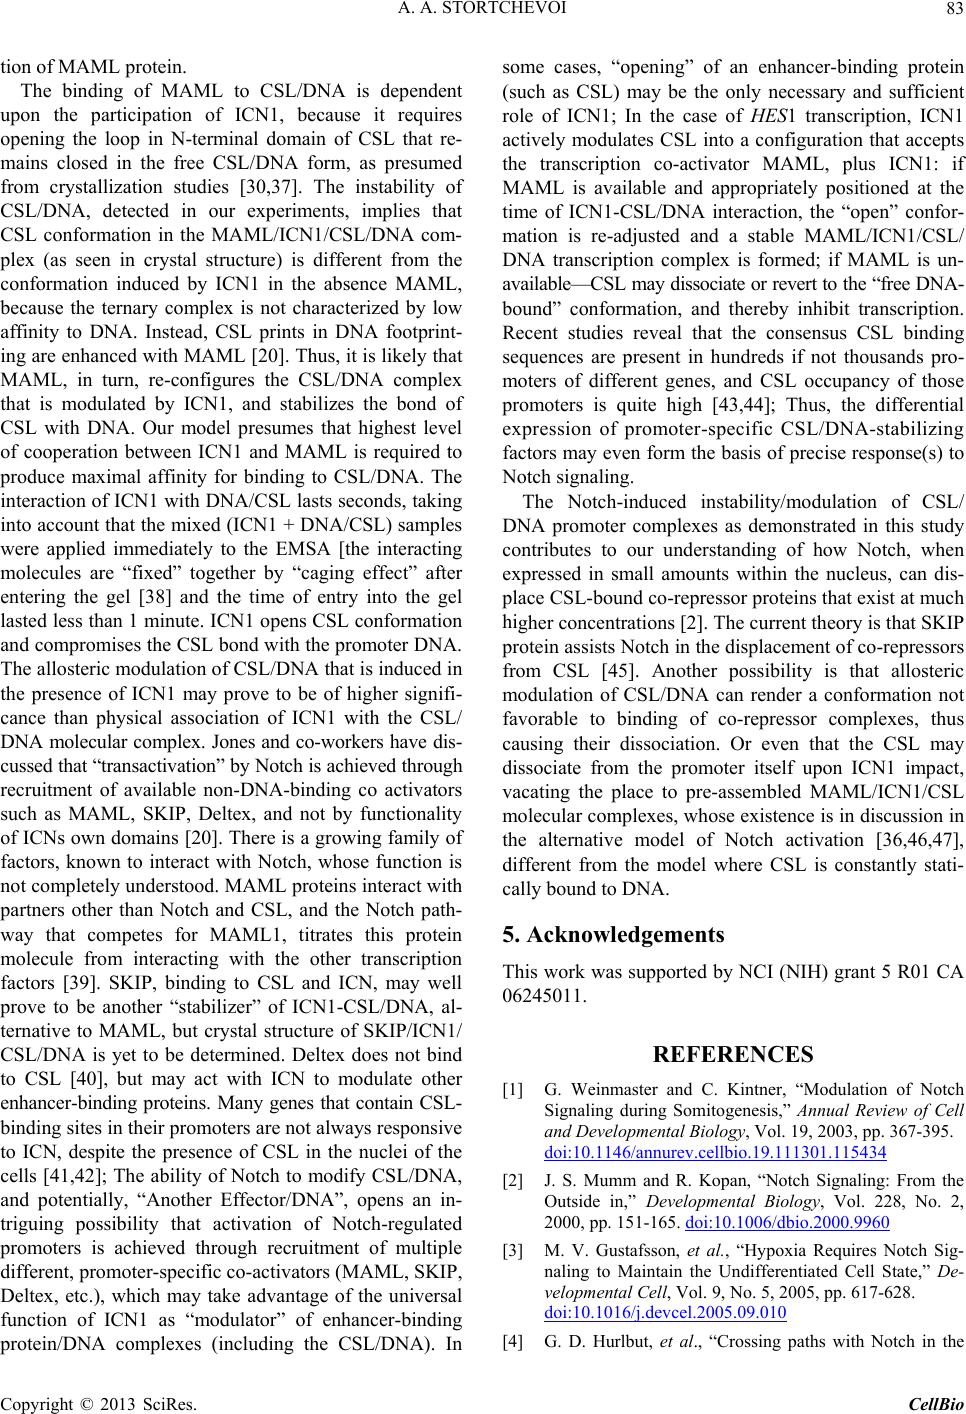 A. A. STORTCHEVOI 83 tion of MAML protein. The binding of MAML to CSL/DNA is dependent upon the participation of ICN1, because it requires opening the loop in N-terminal domain of CSL that re- mains closed in the free CSL/DNA form, as presumed from crystallization studies [30,37]. The instability of C co-repressor proteins that exist at much hi NCES ng during Somitogenesis,” Annual Review of Cell tal Biology, Vol. 19, 2003, pp. 367-395. doi:10.1146/annurev.cellbio.19.111301.115434 SL/DNA, detected in our experiments, implies that CSL conformation in the MAML/ICN1/CSL/DNA com- plex (as seen in crystal structure) is different from the conformation induced by ICN1 in the absence MAML, because the ternary complex is not characterized by low affinity to DNA. Instead, CSL prints in DNA footprint- ing are enhanced with MAML [20]. Thus, it is likely that MAML, in turn, re-configures the CSL/DNA complex that is modulated by ICN1, and stabilizes the bond of CSL with DNA. Our model presumes that highest level of cooperation between ICN1 and MAML is required to produce maximal affinity for binding to CSL/DNA. The interaction of ICN1 with DNA/CSL lasts seconds, taking into account that the mixed (ICN1 + DNA/CSL) samples were applied immediately to the EMSA [the interacting molecules are “fixed” together by “caging effect” after entering the gel [38] and the time of entry into the gel lasted less than 1 minute. ICN1 opens CSL conformation and compromises the CSL bond with the promoter DNA. The allosteric modulation of CSL/DNA that is induced in the presence of ICN1 may prove to be of higher signifi- cance than physical association of ICN1 with the CSL/ DNA molecular complex. Jones and co-workers have dis- cussed that “transactivation” by Notch is achieved through recruitment of available non-DNA-binding co activators such as MAML, SKIP, Deltex, and not by functionality of ICNs own domains [20]. There is a growing family of factors, known to interact with Notch, whose function is not completely understood. MAML proteins interact with partners other than Notch and CSL, and the Notch path- way that competes for MAML1, titrates this protein molecule from interacting with the other transcription factors [39]. SKIP, binding to CSL and ICN, may well prove to be another “stabilizer” of ICN1-CSL/DNA, al- ternative to MAML, but crystal structure of SKIP/ICN1/ CSL/DNA is yet to be determined. Deltex does not bind to CSL [40], but may act with ICN to modulate other enhancer-binding proteins. Many genes that contain CSL- binding sites in their promoters are not always responsive to ICN, despite the presence of CSL in the nuclei of the cells [41,42]; The ability of Notch to modify CSL/DNA, and potentially, “Another Effector/DNA”, opens an in- triguing possibility that activation of Notch-regulated promoters is achieved through recruitment of multiple different, promoter-specific co-activators (MAML, SKIP, Deltex, etc.), which may take advantage of the universal function of ICN1 as “modulator” of enhancer-binding protein/DNA complexes (including the CSL/DNA). In some cases, “opening” of an enhancer-binding protein (such as CSL) may be the only necessary and sufficient role of ICN1; In the case of HES1 transcription, ICN1 actively modulates CSL into a configuration that accepts the transcription co-activator MAML, plus ICN1: if MAML is available and appropriately positioned at the time of ICN1-CSL/DNA interaction, the “open” confor- mation is re-adjusted and a stable MAML/ICN1/CSL/ DNA transcription complex is formed; if MAML is un- available—CSL may dissociate or revert to the “free DNA- bound” conformation, and thereby inhibit transcription. Recent studies reveal that the consensus CSL binding sequences are present in hundreds if not thousands pro- moters of different genes, and CSL occupancy of those promoters is quite high [43,44]; Thus, the differential expression of promoter-specific CSL/DNA-stabilizing factors may even form the basis of precise response(s) to Notch signaling. The Notch-induced instability/modulation of CSL/ DNA promoter complexes as demonstrated in this study contributes to our understanding of how Notch, when expressed in small amounts within the nucleus, can dis- place CSL-bound gher concentrations [2]. The current theory is that SKIP protein assists Notch in the displacement of co-repressors from CSL [45]. Another possibility is that allosteric modulation of CSL/DNA can render a conformation not favorable to binding of co-repressor complexes, thus causing their dissociation. Or even that the CSL may dissociate from the promoter itself upon ICN1 impact, vacating the place to pre-assembled MAML/ICN1/CSL molecular complexes, whose existence is in discussion in the alternative model of Notch activation [36,46,47], different from the model where CSL is constantly stati- cally bound to DNA. 5. Acknowledgements This work was supported by NCI (NIH) grant 5 R01 CA 06245011. REFERE [1] G. Weinmaster and C. Kintner, “Modulation of Notch Signali and Developmen [2] J. S. Mumm aignaling: From the nd R. Kopan, “Notch S Outside in,” Developmental Biology, Vol. 228, No. 2, 2000, pp. 151-165. doi:10.1006/dbio.2000.9960 [3] M. V. Gustafsson, et al., “Hypoxia Requires Notch Sig- naling to Maintain the Undifferentiated Cell St ate,” De- velopmental Cell, Vol. 9, No. 5, 2005, pp. 617-628. doi:10.1016/j.devcel.2005.09.010 [4] G. D. Hurlbut, et al., “Crossing paths with Notch in the Copyright © 2013 SciRes. CellBio 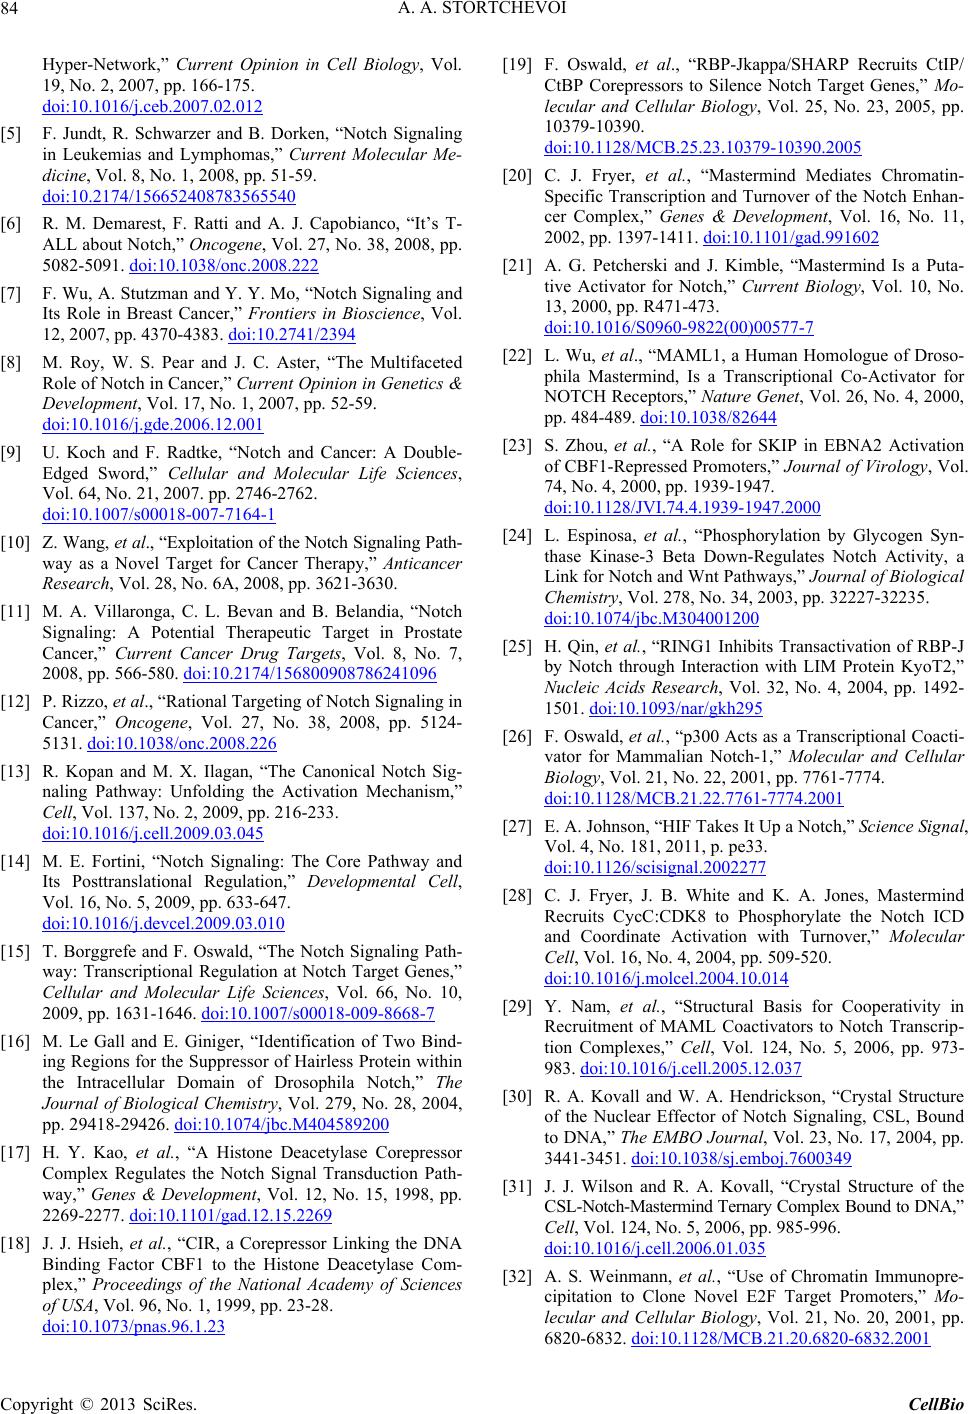 A. A. STORTCHEVOI 84 Hyper-Network,” Current Opinion in Cell Biology, Vol. 19, No. 2, 2007, pp. 166-175. doi:10.1016/j.ceb.2007.02.012 [5] F. Jundt, R. Schwarzer and B. Dorken, “Notch Signaling 40 in Leukemias and Lymphomas,” Current Molecular Me- dicine, Vol. 8, No. 1, 2008, pp. 51-59. doi:10.2174/1566524087835655 . J. Capobianco, “It’s T- [6] R. M. Demarest, F. Ratti and A ALL about Notch,” Oncogene, Vol. 27, No. 38, 2008, pp. 5082-5091. doi:10.1038/onc.2008.222 [7] F. Wu, A. Stutzman and Y. Y. Mo, “No Its Role in Breast Cancer,” Frontier tch Signaling s in Bioscience, Vol and . 12, 2007, pp. 4370-4383. doi:10.2741/2394 [8] M. Roy, W. S. Pear and J. C. Aster, “The Multifaceted Role of Notch in Cancer,” Current Opinion in Genetics & Development, Vol. 17, No. 1, 2007, pp. 52-59. doi:10.1016/j.gde.2006.12.001 [9] U. Koch and F. Radtke, “Notch and Cancer: A Double- Edged Sword,” Cellular and Molecular Life Sciences, Vol. 64, No. 21, 2007. pp. 2746-2762. doi:10.1007/s00018-007-7164-1 [10] Z. Wang, et al., “Exploitation of the Notch Signaling Path- Belandia, “Notch utic Target in Prostate way as a Novel Target for Cancer Therapy,” Anticancer Research, Vol. 28, No. 6A, 2008, pp. 3621-3630. [11] M. A. Villaronga, C. L. Bevan and B. Signaling: A Potential Therape Cancer,” Current Cancer Drug Targets, Vol. 8, No. 7, 2008, pp. 566-580. doi:10.2174/156800908786241096 [12] P. Rizzo, et al., “Rational Targeting of Notch Signaling in Cancer,” Oncogene, Vol. 27, No. 38, 2008, pp. 5124- 5131. doi:10.1038/onc.2008.226 [13] R. Kopan and M. X. Ilagan, “The Canonical Notch Sig- naling Pathway: Unfolding the Activation Mechanism,” Cell, Vol. 137, No. 2, 2009, pp. 216-233. doi:10.1016/j.cell.2009.03.045 [14] M. E. Fortini, “Notch Signaling: The Core Pathway and Its Posttranslational Regulation,” Developmental Cell, Vol. 16, No. 5, 2009, pp. 633-647. doi:10.1016/j.devcel.2009.03.010 [15] T. Borggrefe and F. Oswald, “The Notch Signaling Path- 0018-009-8668 way: Transcriptional Regulation at Notch Target Genes,” Cellular and Molecular Life Sciences, Vol. 66, No. 10, 2009, pp. 1631-1646. doi:10.1007/s0 -7 [16] M. Le Gall and E. Giniger, “Identification of Two Bind- ing Regions for the Suppressor of Hairless Protein within the Intracellular Domain of Drosophila Notch,” The Journal of Biological Chemistry, Vol. 279, No. 28, 2004, pp. 29418-29426. doi:10.1074/jbc.M404589200 [17] H. Y. Kao, et al., “A Histone Deacetylase Corepressor Complex Regulates the Notch Signal Transduction Path- way,” Genes & Development, Vol. 12, No. 15, 1998, pp. 2269-2277. doi:10.1101/gad.12.15.2269 [18] J. J. Hsieh, et al., “CIR, a Corepressor Linking the DNA Binding Factor CBF1 to the Histone Deacetylase Com- plex,” Proceedings of the National Academy of Sciences of USA, Vol. 96, No. 1, 1999, pp. 23-28. doi:10.1073/pnas.96.1.23 [19] F. Oswald, et al., “RBP-Jkappa/SHARP Recruits CtIP/ CtBP Corepressors to Silence Notch Target Genes,” Mo- lecular and Cellular Biology, Vol. 25, No. 23, 2005, pp. 10379-10390. doi:10.1128/MCB.25.23.10379-10390.2005 1411. doi:10.1101/gad.991602 [20] C. J. Fryer, et al., “Mastermind Mediates Chromatin- Specific Transcription and Turnover of the Notch Enhan- cer Complex,” Genes & Development, Vol. 16, No. 11, 2002, pp. 1397- d Is a Puta-[21] A. G. Petcherski and J. Kimble, “Mastermin tive Activator for Notch,” Current Biology, Vol. 10, No. 13, 2000, pp. R471-473. doi:10.1016/S0960-9822(00)00577-7 [22] L. Wu, et al., “MAML1, a Human Homologue of Droso- 82644 phila Mastermind, Is a Transcriptional Co-Activator for NOTCH Receptors,” Nature Genet, Vol. 26, No. 4, 2000, pp. 484-489. doi:10.1038/ EBNA2 Activation [23] S. Zhou, et al., “A Role for SKIP in of CBF1-Repressed Promoters,” Journal of Virology, Vol. 74, No. 4, 2000, pp. 1939-1947. doi:10.1128/JVI.74.4.1939-1947.2000 [24] L. Espinosa, et al., “Phosphorylation by Glycogen Syn- , pp. 32227-32235. thase Kinase-3 Beta Down-Regulates Notch Activity, a Link for Notch and Wnt Pathways,” Journal of Biological Chemistry, Vol. 278, No. 34, 2003 doi:10.1074/jbc.M304001200 [25] H. Qin, et al., “RING1 Inhibits Transactivation of RBP-J by Notch through Interaction with LIM Protein KyoT2,” Nucleic Acids Research, Vol. 32, No. 4, 2004, pp. 1492- 1501. doi:10.1093/nar/gkh295 [26] F. Oswald, et al., “p300 Acts as a Transcriptional Coacti- vator for Mammalian Notch-1,” Molecular and Cellular Biology, Vol. 21, No. 22, 2001, pp. 7761-7774. doi:10.1128/MCB.21.22.7761-7774.2001 [27] E. A. Johnson, “HIF Takes It Up a Notch,” Science Signal, Vol. 4, No. 181, 2011, p. pe33. doi:10.1126/scisignal.2002277 [28] C. J. Fryer, J. B. White and K. A. Jones, Ma Recruits CycC:CDK8 to Phosphorylate t stermind he Notch ICD 9-520. 4 and Coordinate Activation with Turnover,” Molecular Cell, Vol. 16, No. 4, 2004, pp. 50 doi:10.1016/j.molcel.2004.10.01 [29] Y. Nam, et al., “Structural Basis for Cooperativity in Recruitment of MAML Coactivators to Notch Transcrip- tion Complexes,” Cell, Vol. 124, No. 5, 2006, pp. 973- 983. doi:10.1016/j.cell.2005.12.037 [30] R. A. Kovall and W. A. Hendrickson, “Crystal Structure of the Nuclear Effector of Notch Signaling, CSL, Bound to DNA,” The EMBO Journal, Vol. 23, No. 17, 2004, pp. 3441-3451. doi:10.1038/sj.emboj.7600349 [31] J. J. Wilson and R. A. Kovall, “Crystal Structure of the CSL-Notch-Mastermind Ternary Complex Bound to DNA,” Cell, Vol. 124, No. 5, 2006, pp. 985-996. doi:10.1016/j.cell.2006.01.035 [32] A. S. Weinmann, et al., “Use of Chromatin Immunopre- 6832.2001 cipitation to Clone Novel E2F Target Promoters,” Mo- lecular and Cellular Biology, Vol. 21, No. 20, 2001, pp. 6820-6832. doi:10.1128/MCB.21.20.6820- Copyright © 2013 SciRes. CellBio  A. A. STORTCHEVOI Copyright © 2013 SciRes. CellBio 85 J.W. Posakony, “Discrete[33] D. T. Nellesen, E.C. Lai and Enhancer Elements Mediate Selective Responsiveness of Enhancer of Split Complex Genes to Common Transcrip- tional Activators,” Developmental Biology, Vol. 213, No. 1, 1999, pp. 33-53. doi:10.1006/dbio.1999.9324 [34] A. M. Bailey and J. W. Posakony, “Suppressor of Hair- less Directly Activates Transcription of Enhancer of Split Complex Genes in Response to Notch Receptor Activ- ity,” Genes and Development, Vol. 9, No. 21, 1995, pp. 2609-2622. doi:10.1101/gad.9.21.2609 [35] S. Jeffries, D. J. Robbins and A. J. Capobianco, “Charac- terization of a High-Molecular-Weight Notch Complex in the Nucleus of Notch(ic)-Transformed RKE Cells and in a Human T-Cell Leukemia Cell Line,” Molecular and Cellular Biology, Vol. 22, No. 11, 2002, pp. 3927-3241. doi:10.1128/MCB.22.11.3927-3941.2002 [36] D. R. Friedmann, J. J. Wilson and R. A. Kovall, “RAM- Induced Allostery Facilitates Assembly of a Notch Path- way Active Transcription Complex,” The Journal of Bio- logical Chemistry, Vol. 283, No. 21, 2008, pp. 14781- 14791. doi:10.1074/jbc.M709501200 [37] R. A. Kovall, “Structures of CSL, Notch and Mastermind Proteins: Piecing Together an Active Transcription Com- plex,” Current Opinion in Structural Biology, Vol. 17, No. 1, 2007, pp. 117-127. doi:10.1016/j.sbi.2006.11.004 [38] M. Fried and D. M. Crothers, “Equilibria and Kinetics of Lac Repressor-Operator Interactions by Polyacrylamide Gel Electrophoresis,” Nucleic Acids Research, Vol. 9, No. 23, 1981, pp. 6505-6525. doi:10.1093/nar/9.23.6505 [39] A. S. McElhinny, J. L. Li and L. Wu, “Mastermind-Like Transcriptional Co-Activators: Emerging Roles in Regu- lating Cross Talk among Multiple Signaling Pathways,” Oncogene, Vol. 27, No. 38, 2008, pp. 5138-5147. doi:10.1038/onc.2008.228 [40] N. Yamamoto, et al., “Role of Deltex-1 as a Transcrip- tional Regulator Downstream of the Notch Receptor,” The Journal of Biological Chemistry, Vol. 276, No. 48, 2001, pp. 45031-45040. doi:10.1074/jbc.M105245200 [41] J. W. Cave, et al., “A DNA Transcription Code for Cell-Specific Gene Activation by Notch Signaling,” Cur- rent Biology, Vol. 15, No. 2, 2005, pp. 94-104. doi:10.1016/j.cub.2004.12.070 [42] A. Neves and J. R. Priess, “The REF-1 Family of bHLH Transcription Factors Pattern C. elegans Embryos through Notch-Dependent and Notch-Independent Pathways,” De- velopmental Cell, Vol. 8, No. 6, 2005, pp. 867-879. doi:10.1016/j.devcel.2005.03.012 [43] L. M. Persson and A. C. Wilson, “Wide-Scale Use Notch Signaling Factor CSL/RBP of -Jkappa in RTA-Medi- ated Activation of Kaposi’s Sarcoma-Associated Herpes- virus Lytic Genes,” Journal of Virology, Vol. 84, No. 3, 2009, pp. 1334-1347. doi:10.1128/JVI.01301-09 [44] H. Hamidi, et al., “Identification of Novel Targets of CSL-Dependent Notch Signaling in Hematopoiesis,” PLoS ONE, Vol. 6, No. 5, 2011, p. e20022. doi:10.1371/journal.pone.0020022 [45] S. Zhou, et al., “SKIP, a CBF1-Associated Pr acts with the Ankyrin Repeat Dom otein, Inter- ain of NotchIC to Fa- cilitate NotchIC Function,” Molecular and Cellular Bi- ology, Vol. 20, No. 7, 2000, pp. 2400-2410. doi:10.1128/MCB.20.7.2400-2410.2000 [46] A. Krejci and S. Bray, “Notch Activation Transient and Selective Binding of Su(H Stimulates )/CSL to Target Enhancers,” Genes & Development, Vol. 21, No. 11, 2007, pp. 1322-1327. doi:10.1101/gad.424607 [47] Y. Nam, et al., “Cooperative Assembly of Higher-Order Notch Complexes Functions as a Switch to Induce Tran- scription,” Proceedings of the National Academy of Sci- ences of the United States of America, Vol. 104, No. 7, 2007, pp. 2103-2108. doi:10.1073/pnas.0611092104  A. A. STORTCHEVOI 86 Supplement 1) ICN1 and CSL recombinant gene sequences used for expression in HEK293T cells and E. coli strain BL21DE3. N-terminal ICN1 sequence (Flag- epitope) added when cloned in pcDNA3.1: HindIII BamHI AAGCTTCCACCATGGATTACAAGGATGACGACGATAAGGGATCC M D Y K D D D D K G S N-terminal ICN1 sequence (with 6xHis epitope) added when cloned in pET28a: 3/1 33/11 atg ggc agc agc cat cat cat cat cat cac agc agc ggc ctg gtg ccg cgc ggc agc cat Met gly ser ser his his his his his his ser ser gly leu val pro arg gly ser his 63/21 93/31 BamHI atg gct agc atg act ggt gga cag caa atg ggt cgc gga tcc met ala ser met thr gly gly gln gln met gly arg gly ser Sequence Range: 1 to 2482 10 20 30 40 50 GGATCCGGAGGCATGGGCTCCCGCAAGCGCCGGCGGCAGCATGGCCAGCT CCTAGGCCTCCGTACCCGAGGGCGTTCGCGGCCGCCGTCGTACCGGTCGA G S G G M G S R K R R R Q H G Q L> _____________TRANSLATION OF ICN1 [A]______________> 60 70 80 90 100 CTGGTTCCCTGAGGGCTTCAAAGTGTCTGAGGCCAGCAAGAAGAAGCGGC GACCAAGGGACTCCCGAAGTTTCACAGACTCCGGTCGTTCTTCTTCGCCG W F P E G F K V S E A S K K K R> _____________TRANSLATION OF ICN1 [A]______________> 110 120 130 140 150 GGGAGCCCCTCGGCGAGGACTCCGTGGGCCTCAAGCCCCTGAAGAACGCT CCCTCGGGGAGCCGCTCCTGAGGCACCCGGAGTTCGGGGACTTCTTGCGA R E P L G E D S V G L K P L K N A> _____________TRANSLATION OF ICN1 [A]______________> 160 170 180 190 200 TCAGACGGTGCCCTCATGGACGACAACCAGAATGAGTGGGGGGACGAGGA AGTCTGCCACGGGAGTACCTGCTGTTGGTCTTACTCACCCCCCTGCTCCT S D G A L M D D N Q N E W G D E D> _____________TRANSLATION OF ICN1 [A]______________> 210 220 230 240 250 CCTGGAGACCAAGAAGTTCCGGTTCGAGGAGCCCGTGGTTCTGCCTGACC GGACCTCTGGTTCTTCAAGGCCAAGCTCCTCGGGCACCAAGACGGACTGG L E T K K F R F E E P V V L P D> _____________TRANSLATION OF ICN1 [A]______________> 260 270 280 290 300 TGGACGACCAGACAGACCACCGGCAGTGGACTCAGCAGCACCTGGATGCC ACCTGCTGGTCTGTCTGGTGGCCGTCACCTGAGTCGTCGTGGACCTACGG L D D Q T D H R Q W T Q Q H L D A> _____________TRANSLATION OF ICN1 [A]______________> 310 320 330 340 350 GCTGACCTGCGCATGTCTGCCATGGCCCCCACACCGCCCCAGGGTGAGGT Copyright © 2013 SciRes. CellBio  A. A. STORTCHEVOI 87 CGACTGGACGCGTACAGACGGTACCGGGGGTGTGGCGGGGTCCCACTCCA A D L R M S A M A P T P P Q G E V> _____________TRANSLATION OF ICN1 [A]______________> 360 370 380 390 400 TGACGCCGACTGCATGGACGTCAATGTCCGCGGGCCTGATGGCTTCACCC ACTGCGGCTGACGTACCTGCAGTTACAGGCGCCCGGACTACCGAAGTGGG D A D C M D V N V R G P D G F T> _____________TRANSLATION OF ICN1 [A]______________> 410 420 430 440 450 CGCTCATGATCGCCTCCTGCAGCGGGGGCGGCCTGGAGACGGGCAACAGC GCGAGTACTAGCGGAGGACGTCGCCCCCGCCGGACCTCTGCCCGTTGTCG P L M I A S C S G G G L E T G N S> _____________TRANSLATION OF ICN1 [A]______________> 460 470 480 490 500 GAGGAAGAGGAGGACGCGCCGGCCGTCATCTCCGACTTCATCTACCAGGG CTCCTTCTCCTCCTGCGCGGCCGGCAGTAGAGGCTGAAGTAGATGGTCCC E E E E D A P A V I S D F I Y Q G> _____________TRANSLATION OF ICN1 [A]______________> 510 520 530 540 550 CGCCAGCCTGCACAACCAGACAGACCGCACGGGCGAGACCGCCTTGCACC GCGGTCGGACGTGTTGGTCTGTCTGGCGTGCCCGCTCTGGCGGAACGTGG A S L H N Q T D R T G E T A L H> _____________TRANSLATION OF ICN1 [A]______________> 560 570 580 590 600 TGGCCGCCCGCTACTCACGCTCTGATGCCGCCAAGCGCCTGCTGGAGGCC ACCGGCGGGCGATGAGTGCGAGACTACGGCGGTTCGCGGACGACCTCCGG L A A R Y S R S D A A K R L L E A> _____________TRANSLATION OF ICN1 [A]______________> 610 620 630 640 650 AGCGCAGATGCCAACATCCAGGACAACATGGGCCGCACCCCGCTGCATGC TCGCGTCTACGGTTGTAGGTCCTGTTGTACCCGGCGTGGGGCGACGTACG S A D A N I Q D N M G R T P L H A> _____________TRANSLATION OF ICN1 [A]______________> 660 670 680 690 700 GGCTGTGTCTGCCGACGCACAAGGTGTCTTCCAGATCCTGATCCGGAACC CCGACACAGACGGCTGCGTGTTCCACAGAAGGTCTAGGACTAGGCCTTGG A V S A D A Q G V F Q I L I R N> _____________TRANSLATION OF ICN1 [A]______________> 710 720 730 740 750 GAGCCACAGACCTGGATGCCCGCATGCATGATGGCACGACGCCACTGATC CTCGGTGTCTGGACCTACGGGCGTACGTACTACCGTGCTGCGGTGACTAG R A T D L D A R M H D G T T P L I> _____________TRANSLATION OF ICN1 [A]______________> 760 770 780 790 800 CTGGCTGCCCGCCTGGCCGTGGAGGGCATGCTGGAGGACCTCATCAACTC Copyright © 2013 SciRes. CellBio  A. A. STORTCHEVOI 88 GACCGACGGGCGGACCGGCACCTCCCGTACGACCTCCTGGAGTAGTTGAG L A A R L A V E G M L E D L I N S> _____________TRANSLATION OF ICN1 [A]______________> 810 820 830 840 850 ACACGCCGACGTCAACGCCGTAGATGACCTGGGCAAGTCCGCCCTGCACT TGTGCGGCTGCAGTTGCGGCATCTACTGGACCCGTTCAGGCGGGACGTGA H A D V N A V D D L G K S A L H> _____________TRANSLATION OF ICN1 [A]______________> 860 870 880 890 900 GGGCCGCCGCCGTGAACAATGTGGATGCCGCAGTTGTGCTCCTGAAGAAC CCCGGCGGCGGCACTTGTTACACCTACGGCGTCAACACGAGGACTTCTTG W A A A V N N V D A A V V L L K N> _____________TRANSLATION OF ICN1 [A]______________> 910 920 930 940 950 GGGGCTAACAAAGATATGCAGAACAACAGGGAGGAGACACCCCTGTTTCT CCCCGATTGTTTCTATACGTCTTGTTGTCCCTCCTCTGTGGGGACAAAGA G A N K D M Q N N R E E T P L F L> _____________TRANSLATION OF ICN1 [A]______________> 960 970 980 990 1000 GGCCGCCCGGGAGGGCAGCTACGAGACCGCCAAGGTGCTGCTGGACCACT CCGGCGGGCCCTCCCGTCGATGCTCTGGCGGTTCCACGACGACCTGGTGA A A R E G S Y E T A K V L L D H> _____________TRANSLATION OF ICN1 [A]______________> 1010 1020 1030 1040 1050 TTGCCAACCGGGACATCACGGATCATATGGACCGCCTGCCGCGCGACATC AACGGTTGGCCCTGTAGTGCCTAGTATACCTGGCGGACGGCGCGCTGTAG F A N R D I T D H M D R L P R D I> _____________TRANSLATION OF ICN1 [A]______________> 1060 1070 1080 1090 1100 GCACAGGAGCGCATGCATCACGACATCGTGAGGCTGCTGGACGAGTACAA CGTGTCCTCGCGTACGTAGTGCTGTAGCACTCCGACGACCTGCTCATGTT A Q E R M H H D I V R L L D E Y N> _____________TRANSLATION OF ICN1 [A]______________> 1110 1120 1130 1140 1150 CCTGGTGCGCAGCCCGCAGCTGCACGGAGCCCCGCTGGGGGGCACGCCCA GGACCACGCGTCGGGCGTCGACGTGCCTCGGGGCGACCCCCCGTGCGGGT L V R S P Q L H G A P L G G T P> _____________TRANSLATION OF ICN1 [A]______________> 1160 1170 1180 1190 1200 CCCTGTCGCCCCCGCTCTGCTCGCCCAACGGCTACCTGGGCAGCCTCAAG GGGACAGCGGGGGCGAGACGAGCGGGTTGCCGATGGACCCGTCGGAGTTC T L S P P L C S P N G Y L G S L K> _____________TRANSLATION OF ICN1 [A]______________> 1210 1220 1230 1240 1250 CCCGGCGTGCAGGGCAAGAAGGTCCGCAAGCCCAGCAGCAAAGGCCTGGC Copyright © 2013 SciRes. CellBio  A. A. STORTCHEVOI 89 GGGCCGCACGTCCCGTTCTTCCAGGCGTTCGGGTCGTCGTTTCCGGACCG P G V Q G K K V R K P S S K G L A> _____________TRANSLATION OF ICN1 [A]______________> 1260 1270 1280 1290 1300 CTGTGGAAGCAAGGAGGCCAAGGACCTCAAGGCACGGAGGAAGAAGTCCC GACACCTTCGTTCCTCCGGTTCCTGGAGTTCCGTGCCTCCTTCTTCAGGG C G S K E A K D L K A R R K K S> _____________TRANSLATION OF ICN1 [A]______________> 1310 1320 1330 1340 1350 AGGATGGCAAGGGCTGCCTGCTGGACAGCTCCGGCATGCTCTCGCCCGTG TCCTACCGTTCCCGACGGACGACCTGTCGAGGCCGTACGAGAGCGGGCAC Q D G K G C L L D S S G M L S P V> _____________TRANSLATION OF ICN1 [A]______________> 1360 1370 1380 1390 1400 GACTCCCTGGAGTCACCCCATGGCTACCTGTCAGACGTGGCCTCGCCGCC CTGAGGGACCTCAGTGGGGTACCGATGGACAGTCTGCACCGGAGCGGCGG D S L E S P H G Y L S D V A S P P> _____________TRANSLATION OF ICN1 [A]______________> 1410 1420 1430 1440 1450 ACTGCTGCCCTCCCCGTTCCAGCAGTCTCCGTCCGTGCCCCTCAACCACC TGACGACGGGAGGGGCAAGGTCGTCAGAGGCAGGCACGGGGAGTTGGTGG L L P S P F Q Q S P S V P L N H> _____________TRANSLATION OF ICN1 [A]______________> 1460 1470 1480 1490 1500 TGCCTGGGATGCCCGACACCCACCTGGGCATCGGGCACCTGAACGTGGCG ACGGACCCTACGGGCTGTGGGTGGACCCGTAGCCCGTGGACTTGCACCGC L P G M P D T H L G I G H L N V A> _____________TRANSLATION OF ICN1 [A]______________> 1510 1520 1530 1540 1550 GCCAAGCCCGAGATGGCGGCGCTGGGTGGGGGCGGCCGGCTGGCCTTTGA CGGTTCGGGCTCTACCGCCGCGACCCACCCCCGCCGGCCGACCGGAAACT A K P E M A A L G G G G R L A F E> _____________TRANSLATION OF ICN1 [A]______________> 1560 1570 1580 1590 1600 GACTGGCCCACCTCGTCTCTCCCACCTGCCTGTGGCCTCTGGCACCAGCA CTGACCGGGTGGAGCAGAGAGGGTGGACGGACACCGGAGACCGTGGTCGT T G P P R L S H L P V A S G T S> _____________TRANSLATION OF ICN1 [A]______________> 1610 1620 1630 1640 1650 CCGTCCTGGGCTCCAGCAGCGGAGGGGCCCTGAATTTCACTGTGGGCGGG GGCAGGACCCGAGGTCGTCGCCTCCCCGGGACTTAAAGTGACACCCGCCC T V L G S S S G G A L N F T V G G> _____________TRANSLATION OF ICN1 [A]______________> 1660 1670 1680 1690 1700 TCCACCAGTTTGAATGGTCAATGCGAGTGGCTGTCCCGGCTGCAGAGCGG Copyright © 2013 SciRes. CellBio  A. A. STORTCHEVOI 90 AGGTGGTCAAACTTACCAGTTACGCTCACCGACAGGGCCGACGTCTCGCC S T S L N G Q C E W L S R L Q S G> _____________TRANSLATION OF ICN1 [A]______________> 1710 1720 1730 1740 1750 CATGGTGCCGAACCAATACAACCCTCTGCGGGGGAGTGTGGCACCAGGCC GTACCACGGCTTGGTTATGTTGGGAGACGCCCCCTCACACCGTGGTCCGG M V P N Q Y N P L R G S V A P G> _____________TRANSLATION OF ICN1 [A]______________> 1760 1770 1780 1790 1800 CCCTGAGCACACAGGCCCCCTCCCTGCAGCATGGCATGGTAGGCCCGCTG GGGACTCGTGTGTCCGGGGGAGGGACGTCGTACCGTACCATCCGGGCGAC P L S T Q A P S L Q H G M V G P L> _____________TRANSLATION OF ICN1 [A]______________> 1810 1820 1830 1840 1850 CACAGTAGCCTTGCTGCCAGCGCCCTGTCCCAGATGATGAGCTACCAGGG GTGTCATCGGAACGACGGTCGCGGGACAGGGTCTACTACTCGATGGTCCC H S S L A A S A L S Q M M S Y Q G> _____________TRANSLATION OF ICN1 [A]______________> 1860 1870 1880 1890 1900 CCTGCCCAGCACCCGGCTGGCCACCCAGCCTCACCTGGTGCAGACCCAGC GGACGGGTCGTGGGCCGACCGGTGGGTCGGAGTGGACCACGTCTGGGTCG L P S T R L A T Q P H L V Q T Q> _____________TRANSLATION OF ICN1 [A]______________> 1910 1920 1930 1940 1950 AGGTGCAGCCACAAAACTTACAGATGCAGCAGCAGAACCTGCAGCCAGCA TCCACGTCGGTGTTTTGAATGTCTACGTCGTCGTCTTGGACGTCGGTCGT Q V Q P Q N L Q M Q Q Q N L Q P A> _____________TRANSLATION OF ICN1 [A]______________> 1960 1970 1980 1990 2000 AACATCCAGCAGCAGCAAAGCCTGCAGCCGCCACCACCACCACCACAGCC TTGTAGGTCGTCGTCGTTTCGGACGTCGGCGGTGGTGGTGGTGGTGTCGG N I Q Q Q Q S L Q P P P P P P Q P> _____________TRANSLATION OF ICN1 [A]______________> 2010 2020 2030 2040 2050 GCACCTTGGCGTGAGCTCAGCAGCCAGCGGCCACCTGGGCCGGAGCTTCC CGTGGAACCGCACTCGAGTCGTCGGTCGCCGGTGGACCCGGCCTCGAAGG H L G V S S A A S G H L G R S F> _____________TRANSLATION OF ICN1 [A]______________> 2060 2070 2080 2090 2100 TGAGTGGAGAGCCGAGCCAGGCAGACGTGCAGCCACTGGGCCCCAGCAGC ACTCACCTCTCGGCTCGGTCCGTCTGCACGTCGGTGACCCGGGGTCGTCG L S G E P S Q A D V Q P L G P S S> _____________TRANSLATION OF ICN1 [A]______________> 2110 2120 2130 2140 2150 CTGGCGGTGCACACTATTCTGCCCCAGGAGAGCCCCGCCCTGCCCACGTC Copyright © 2013 SciRes. CellBio  A. A. STORTCHEVOI 91 GACCGCCACGTGTGATAAGACGGGGTCCTCTCGGGGCGGGACGGGTGCAG L A V H T I L P Q E S P A L P T S> _____________TRANSLATION OF ICN1 [A]______________> 2160 2170 2180 2190 2200 GCTGCCATCCTCGCTGGTCCCACCCGTGACCGCAGCCCAGTTCCTGACGC CGACGGTAGGAGCGACCAGGGTGGGCACTGGCGTCGGGTCAAGGACTGCG L P S S L V P P V T A A Q F L T> _____________TRANSLATION OF ICN1 [A]______________> 2210 2220 2230 2240 2250 CCCCCTCGCAGCACAGCTACTCCTCGCCTGTGGAAAACACCCCCAGCCAC GGGGGAGCGTCGTGTCGATGAGGAGCGGACACCTTTTGTGGGGGTCGGTG P P S Q H S Y S S P V E N T P S H> _____________TRANSLATION OF ICN1 [A]______________> 2260 2270 2280 2290 2300 CAGCTACAGGTGCCTGAGCACCCCTTCCTCACCCCGTCCCCTGAGTCCCC GTCGATGTCCACGGACTCGTGGGGAAGGAGTGGGGCAGGGGACTCAGGGG Q L Q V P E H P F L T P S P E S P> _____________TRANSLATION OF ICN1 [A]______________> 2310 2320 2330 2340 2350 TGACCAGTGGTCCAGCTCGTCCCCGCATTCCAACGTCTCCGACTGGTCCG ACTGGTCACCAGGTCGAGCAGGGGCGTAAGGTTGCAGAGGCTGACCAGGC D Q W S S S S P H S N V S D W S> _____________TRANSLATION OF ICN1 [A]______________> 2360 2370 2380 2390 2400 AGGGCGTCTCCAGCCCTCCCACCAGCATGCAGTCCCAGATCGCCCGCATT TCCCGCAGAGGTCGGGAGGGTGGTCGTACGTCAGGGTCTAGCGGGCGTAA E G V S S P P T S M Q S Q I A R I> _____________TRANSLATION OF ICN1 [A]______________> 2410 2420 2430 2440 2450 CCGGAGGCCTTCAAGTAAACGGCGCGCAGATCCACTAGTAACGGCCGCCA GGCCTCCGGAAGTTCATT P E A F K * 2460 GTGTGCTGGAATTC EcoRI For C-terminal tags 3’- end of ICN1 was modified by deletion of a single “C” nucleotide to create an AflII site next to TAA – STOP codone: …CTTcAAGtaa -> CTTAAGtaa. Then –HA or - 6xHis sequences were added as follows: -HA sequence: AflII XhoI CTTAAGTTACCCATACGATGTTCCTGACTATGCGTAACTCGAG L S Y P Y D V P D Y A stop -6xHis sequence: AflII XhoI CTTAAGTCACCACCACCACCACCACTGACTCGAG L S H H H H H H Stop Copyright © 2013 SciRes. CellBio  A. A. STORTCHEVOI 92 2) Recombinant CSL gene. 10 20 30 40 50 ATGGACTACAAAGACGATGACGACAAGCTTATGGACCACACGGAGGGC TACCTGATGTTTCTGCTACTGCTGTTCGAATACCTGGTGTGCCTCCCG M D Y K D D D D K L M D H T E G> _____TRANSLATION OF FLAGCSLRECOMBINANT [A]______> 60 70 80 90 100 TTGCCCGCGGAGGAGCCGCCTGCGCATGCTCCATCGCCTGGGAAATTTGG AACGGGCGCCTCCTCGGCGGACGCGTACGAGGTAGCGGACCCTTTAAACC L P A E E P P A H A P S P G K F G> ______TRANSLATION OF FLAGCSLRECOMBINANT [A]_______> 110 120 130 140 150 TGAGCGGCCTCCACCTAAACGACTTACTAGGGAAGCTATGCGAAATTATT ACTCGCCGGAGGTGGATTTGCTGAATGATCCCTTCGATACGCTTTAATAA E R P P P K R L T R E A M R N Y> ______TRANSLATION OF FLAGCSLRECOMBINANT [A]_______> 160 170 180 190 200 TAAAAGAGCGAGGGGATCAAACAGTACTTATTCTTCATGCAAAAGTTGCA ATTTTCTCGCTCCCCTAGTTTGTCATGAATAAGAAGTACGTTTTCAACGT L K E R G D Q T V L I L H A K V A> ______TRANSLATION OF FLAGCSLRECOMBINANT [A]_______> 210 220 230 240 250 CAGAAGTCATATGGAAATGAAAAAAGGTTTTTTTGCCCACCTCCTTGTGT GTCTTCAGTATACCTTTACTTTTTTCCAAAAAAACGGGTGGAGGAACACA Q K S Y G N E K R F F C P P P C V> ______TRANSLATION OF FLAGCSLRECOMBINANT [A]_______> 260 270 280 290 300 ATATCTTATGGGCAGCGGATGGAAGAAAAAAAAAGAACAAATGGAACGCG TATAGAATACCCGTCGCCTACCTTCTTTTTTTTTCTTGTTTACCTTGCGC Y L M G S G W K K K K E Q M E R> ______TRANSLATION OF FLAGCSLRECOMBINANT [A]_______> 310 320 330 340 350 ATGGTTGTTCTGAACAAGAGTCTCAACCGTGTGCATTTATTGGGATAGGA TACCAACAAGACTTGTTCTCAGAGTTGGCACACGTAAATAACCCTATCCT D G C S E Q E S Q P C A F I G I G> ______TRANSLATION OF FLAGCSLRECOMBINANT [A]_______> 360 370 380 390 400 AATAGTGACCAAGAAATGCAGCAGCTAAACTTGGAAGGAAAGAACTATTG TTATCACTGGTTCTTTACGTCGTCGATTTGAACCTTCCTTTCTTGATAAC N S D Q E M Q Q L N L E G K N Y C> ______TRANSLATION OF FLAGCSLRECOMBINANT [A]_______> 410 420 430 440 450 CACAGCCAAAACATTGTATATATCTGACTCAGACAAGCGAAAGCACTTCA GTGTCGGTTTTGTAACATATATAGACTGAGTCTGTTCGCTTTCGTGAAGT T A K T L Y I S D S D K R K H F> ______TRANSLATION OF FLAGCSLRECOMBINANT [A]_______> Copyright © 2013 SciRes. CellBio  A. A. STORTCHEVOI 93 460 470 480 490 500 TTTTTTCTGTAAAGATGTTCTATGGCAACAGTGATGACATTGGTGTGTTC AAAAAAGACATTTCTACAAGATACCGTTGTCACTACTGTAACCACACAAG I F S V K M F Y G N S D D I G V F> ______TRANSLATION OF FLAGCSLRECOMBINANT [A]_______> 510 520 530 540 550 CTCAGCAAGCGGATAAAAGTCATCTCCAAACCTTCCAAAAAGAAGCAGTC GAGTCGTTCGCCTATTTTCAGTAGAGGTTTGGAAGGTTTTTCTTCGTCAG L S K R I K V I S K P S K K K Q S> ______TRANSLATION OF FLAGCSLRECOMBINANT [A]_______> 560 570 580 590 600 ATTGAAAAATGCTGACTTATGCATTGCCTCAGGAACAAAGGTGGCTCTGT TAACTTTTTACGACTGAATACGTAACGGAGTCCTTGTTTCCACCGAGACA L K N A D L C I A S G T K V A L> ______TRANSLATION OF FLAGCSLRECOMBINANT [A]_______> 610 620 630 640 650 TTAATCGACTACGATCCCAGACAGTTAGTACCAGATACTTGCATGTAGAA AATTAGCTGATGCTAGGGTCTGTCAATCATGGTCTATGAACGTACATCTT F N R L R S Q T V S T R Y L H V E> ______TRANSLATION OF FLAGCSLRECOMBINANT [A]_______> 660 670 680 690 700 GGAGGTAATTTTCATGCCAGTTCACAGCAGTGGGGAGCCTTTTTTATTCA CCTCCATTAAAAGTACGGTCAAGTGTCGTCACCCCTCGGAAAAAATAAGT G G N F H A S S Q Q W G A F F I H> ______TRANSLATION OF FLAGCSLRECOMBINANT [A]_______> 710 720 730 740 750 TCTCTTGGATGATGATGAATCAGAAGGAGAAGAATTCACAGTCCGAGATG AGAGAACCTACTACTACTTAGTCTTCCTCTTCTTAAGTGTCAGGCTCTAC L L D D D E S E G E E F T V R D> ______TRANSLATION OF FLAGCSLRECOMBINANT [A]_______> 760 770 780 790 800 TCTACATCCATTATGGACAAACATGCAAACTTGTGTGCTCAGTTACTGGC AGATGTAGGTAATACCTGTTTGTACGTTTGAACACACGAGTCAATGACCG V Y I H Y G Q T C K L V C S V T G> ______TRANSLATION OF FLAGCSLRECOMBINANT [A]_______> 810 820 830 840 850 ATGGCACTCCCAAGATTGATAATTATGAAAGTTGATAAGCATACCGCATT TACCGTGAGGGTTCTAACTATTAATACTTTCAACTATTCGTATGGCGTAA M A L P R L I I M K V D K H T A L> ______TRANSLATION OF FLAGCSLRECOMBINANT [A]_______> 860 870 880 890 900 ATTGGATGCAGATGATCCTGTGTCACAACTCCATAAATGTGCATTTTACC TAACCTACGTCTACTAGGACACAGTGTTGAGGTATTTACACGTAAAATGG L D A D D P V S Q L H K C A F Y> ______TRANSLATION OF FLAGCSLRECOMBINANT [A]_______> Copyright © 2013 SciRes. CellBio  A. A. STORTCHEVOI 94 910 920 930 940 950 TTAAGGATACAGAAAGAATGTATTTGTGCCTTTCTCAAGAAAGAATAATT AATTCCTATGTCTTTCTTACATAAACACGGAAAGAGTTCTTTCTTATTAA L K D T E R M Y L C L S Q E R I I> ______TRANSLATION OF FLAGCSLRECOMBINANT [A]_______> 960 970 980 990 1000 CAATTTCAGGCCACTCCATGTCCAAAAGAACCAAATAAAGAGATGATAAA GTTAAAGTCCGGTGAGGTACAGGTTTTCTTGGTTTATTTCTCTACTATTT Q F Q A T P C P K E P N K E M I N> ______TRANSLATION OF FLAGCSLRECOMBINANT [A]_______> 1010 1020 1030 1040 1050 TGATGGCGCTTCCTGGACAATCATTAGCACAGATAAGGCAGAGTATACAT ACTACCGCGAAGGACCTGTTAGTAATCGTGTCTATTCCGTCTCATATGTA D G A S W T I I S T D K A E Y T> ______TRANSLATION OF FLAGCSLRECOMBINANT [A]_______> 1060 1070 1080 1090 1100 TTTATGAGGGAATGGGCCCTGTCCTTGCCCCAGTCACTCCTGTGCCTGTG AAATACTCCCTTACCCGGGACAGGAACGGGGTCAGTGAGGACACGGACAC F Y E G M G P V L A P V T P V P V> ______TRANSLATION OF FLAGCSLRECOMBINANT [A]_______> 1110 1120 1130 1140 1150 GTAGAGAGCCTTCAGTTGAATGGCGGTGGGGACGTAGCAATGCTTGAACT CATCTCTCGGAAGTCAACTTACCGCCACCCCTGCATCGTTACGAACTTGA V E S L Q L N G G G D V A M L E L> ______TRANSLATION OF FLAGCSLRECOMBINANT [A]_______> 1160 1170 1180 1190 1200 TACAGGACAGAATTTCACTCCAAATTTACGAGTGTGGTTTGGGGATGTAG ATGTCCTGTCTTAAAGTGAGGTTTAAATGCTCACACCAAACCCCTACATC T G Q N F T P N L R V W F G D V> ______TRANSLATION OF FLAGCSLRECOMBINANT [A]_______> 1210 1220 1230 1240 1250 AAGCTGAAACTATGTACAGGTGTGGAGAGAGTATGCTCTGTGTCGTCCCA TTCGACTTTGATACATGTCCACACCTCTCTCATACGAGACACAGCAGGGT E A E T M Y R C G E S M L C V V P> ______TRANSLATION OF FLAGCSLRECOMBINANT [A]_______> 1260 1270 1280 1290 1300 GACATTTCTGCATTCCGAGAAGGTTGGAGATGGGTCCGGCAACCAGTCCA CTGTAAAGACGTAAGGCTCTTCCAACCTCTACCCAGGCCGTTGGTCAGGT D I S A F R E G W R W V R Q P V Q> ______TRANSLATION OF FLAGCSLRECOMBINANT [A]_______> 1310 1320 1330 1340 1350 GGTTCCAGTAACTTTGGTCCGAAATGATGGAATCATTTATTCCACCAGCC CCAAGGTCATTGAAACCAGGCTTTACTACCTTAGTAAATAAGGTGGTCGG V P V T L V R N D G I I Y S T S> ______TRANSLATION OF FLAGCSLRECOMBINANT [A]_______> Copyright © 2013 SciRes. CellBio 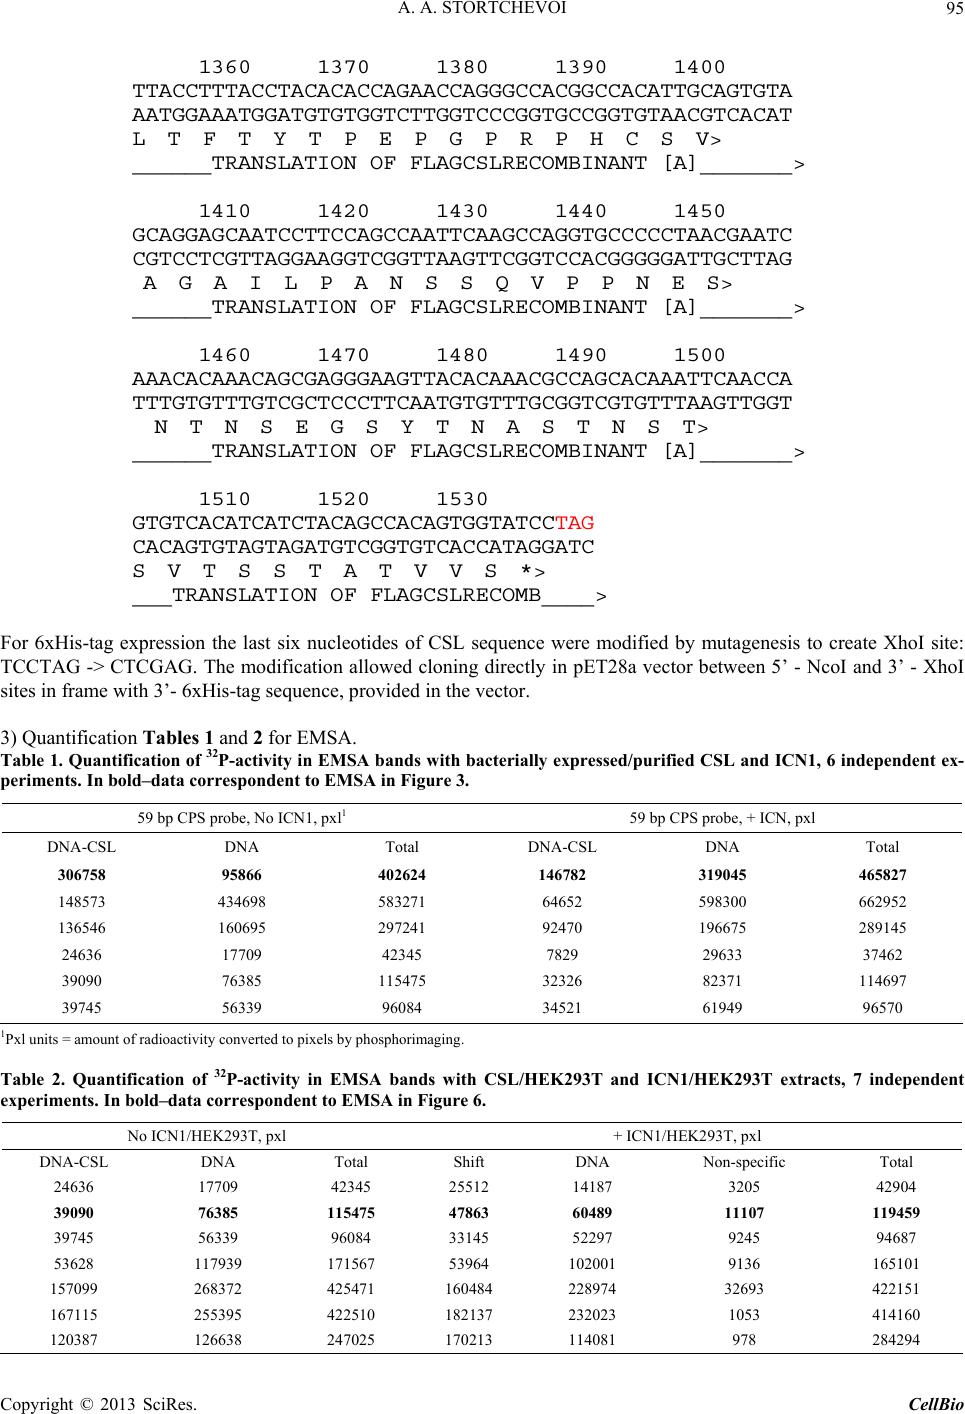 A. A. STORTCHEVOI Copyright © 2013 SciRes. CellBio 95 1360 1370 1380 1390 1400 TTACCTTTACCTACACACCAGAACCAGGGCCACGGCCACATTGCAGTGTA AATGGAAATGGATGTGTGGTCTTGGTCCCGGTGCCGGTGTAACGTCACAT L T F T Y T P E P G P R P H C S V> ______TRANSLATION OF FLAGCSLRECOMBINANT [A]_______> 1410 1420 1430 1440 1450 GCAGGAGCAATCCTTCCAGCCAATTCAAGCCAGGTGCCCCCTAACGAATC CGTCCTCGTTAGGAAGGTCGGTTAAGTTCGGTCCACGGGGGATTGCTTAG A G A I L P A N S S Q V P P N E S> ______TRANSLATION OF FLAGCSLRECOMBINANT [A]_______> 1460 1470 1480 1490 1500 AAACACAAACAGCGAGGGAAGTTACACAAACGCCAGCACAAATTCAACCA TTTGTGTTTGTCGCTCCCTTCAATGTGTTTGCGGTCGTGTTTAAGTTGGT N T N S E G S Y T N A S T N S T> ______TRANSLATION OF FLAGCSLRECOMBINANT [A]_______> 1510 1520 1530 GTGTCACATCATCTACAGCCACAGTGGTATCCTAG CACAGTGTAGTAGATGTCGGTGTCACCATAGGATC S V T S S T A T V V S *> ___TRANSLATION OF FLAGCSLRECOMB____> For 6xHis-tag expression the last six nucleotides of CSL sequence were modified by mutagenesis to create XhoI site: TCCTAG -> CTCGAG. The modification allowed cloning directly in pET28a vector between 5’ - NcoI and 3’ - XhoI sites in frame with 3’- 6xHis-tag sequence, provided in the vector. 3) Quantification Ta bles 1 and 2 for EMSA. Table 1. Quantification of 32P-activity in EMSA bands with bacterially expressed/purified CSL and ICN1, 6 independe nt ex- periments. In bold–data correspondent to EM SA in F i gur e 3. 59 bp CPS probe, No ICN1, pxl1 59 bp CPS probe, + ICN, pxl DNA-CSL DNA Total DNA-CSL DNA Total 306758 95866 402624 146782 319045 465827 148573 434698 583271 64652 598300 662952 136546 160695 297241 92470 196675 289145 24636 17709 42345 7829 29633 37462 39090 76385 115475 32326 82371 114697 39745 56339 96084 34521 61949 96570 1Pxl units = amount of radioactivity converted to pixels by phosphorimaging. Table 2. Quantification of 32P-activity in EMSA bands with CSL/HEK293T and ICN1/HEK293T extracts, 7 independent experiments. In bold–data c o r re sponde nt to EM SA in F i gure 6. No ICN1/HEK293T, pxl + ICN1/HEK293T, pxl DNA-CSL DNA Total Shift DNA Non-specific Total 24636 17709 42345 25512 14187 3205 42904 39090 76385 115475 47863 60489 11107 119459 39745 56339 96084 33145 52297 9245 94687 53628 117939 171567 53964 102001 9136 165101 157099 268372 425471 160484 228974 32693 422151 167115 255395 422510 182137 232023 1053 414160 120387 126638 247025 170213 114081 978 284294
|