Y.-S. HWANG, H.-G. MIN
Copyright © 2013 SciRes.
42
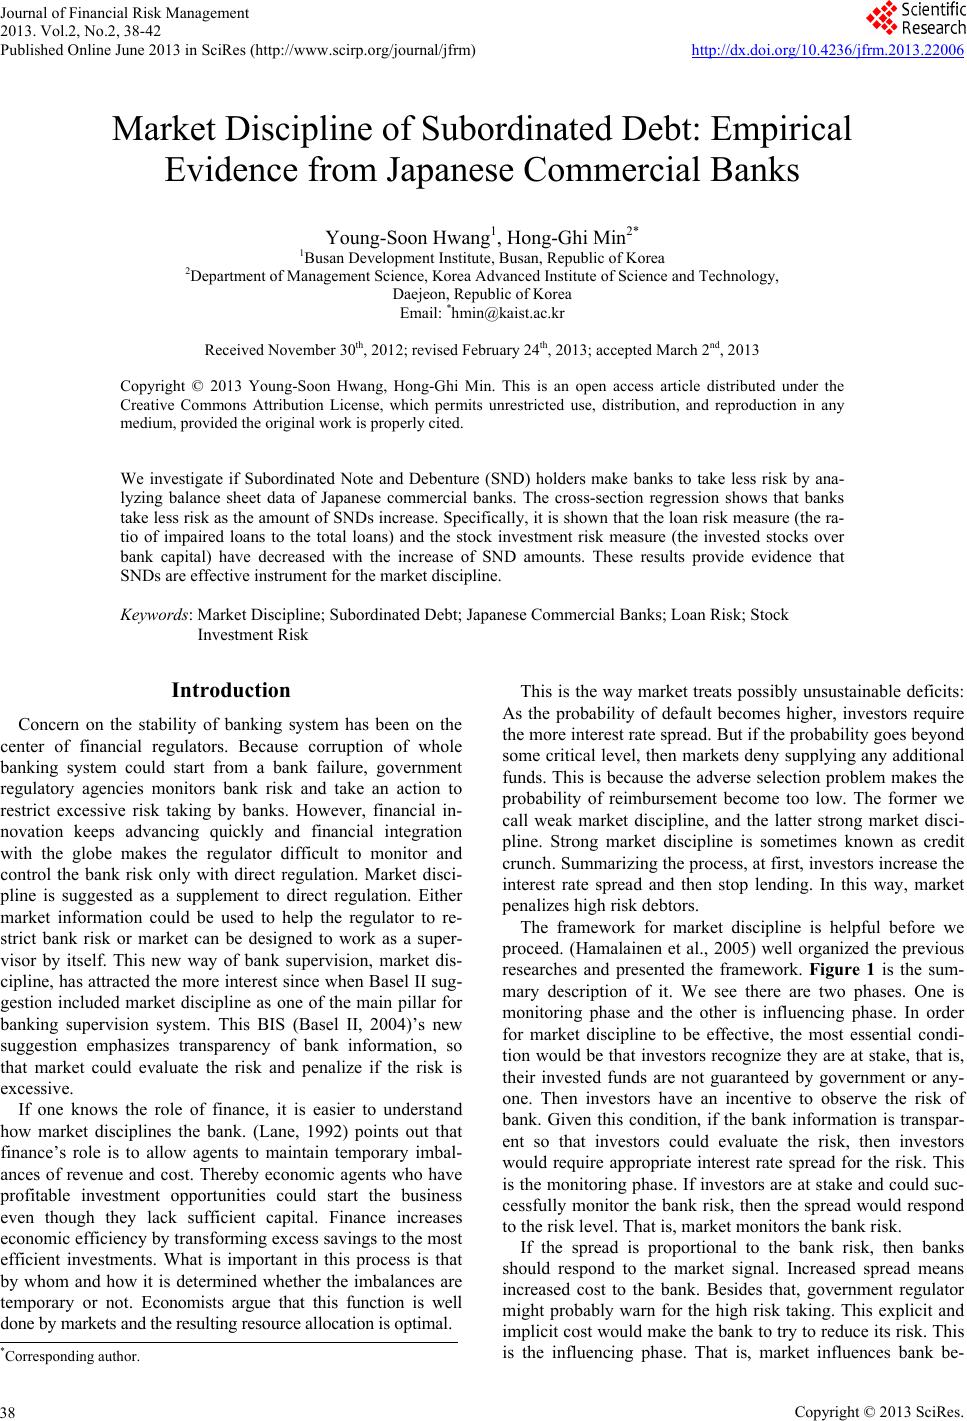
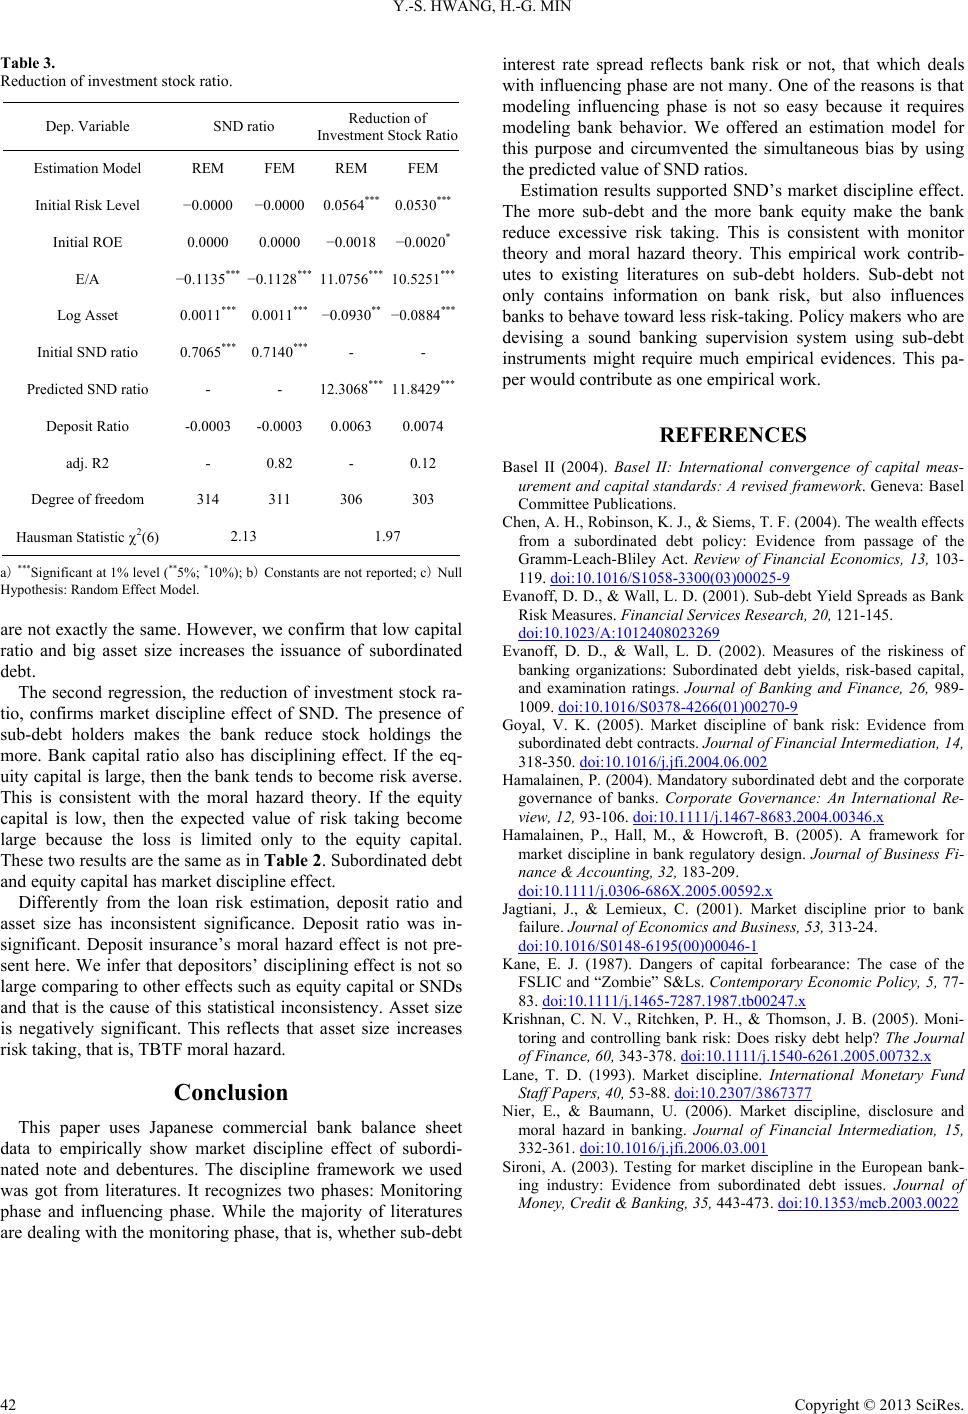
Table 3.
Reduction of investment stock ratio.
Dep. Variable SND ratio Reduction of
Investment Stock Ratio
Estimation Model REM FEM REM FEM
Initial Risk Level −0.0000 −0.0000 0.0564*** 0.0530***
Initial ROE 0.0000 0.0000 −0.0018 −0.0020*
E/A −0.1135*** −0.1128*** 11.0756*** 10.5251***
Log Asset 0.0011*** 0.0011*** −0.0930** −0.0884***
Initial SND ratio 0.7065*** 0.7140*** - -
Predicted SND ratio - - 12.3068*** 11.8429***
Deposit Ratio -0.0003 -0.0003 0.0063 0.0074
adj. R2 - 0.82 - 0.12
Degree of freedom 314 311 306 303
Hausman Statistic 2(6) 2.13 1.97
a) ***Significant at 1% level (**5%; *10%); b) Constants are not reported; c) Null
Hypothesis: Random Effect Model.
are not exactly the same. However, we confirm that low capital
ratio and big asset size increases the issuance of subordinated
debt.
The second regression, the reduction of investment stock ra-
tio, confirms market discipline effect of SND. The presence of
sub-debt holders makes the bank reduce stock holdings the
more. Bank capital ratio also has disciplining effect. If the eq-
uity capital is large, then the bank tends to become risk averse.
This is consistent with the moral hazard theory. If the equity
capital is low, then the expected value of risk taking become
large because the loss is limited only to the equity capital.
These two results are the same as in Table 2. Subordinated debt
and equity capital has market discipline effect.
Differently from the loan risk estimation, deposit ratio and
asset size has inconsistent significance. Deposit ratio was in-
significant. Deposit insurance’s moral hazard effect is not pre-
sent here. We infer that depositors’ disciplining effect is not so
large comparing to other effects such as equity capital or SNDs
and that is the cause of this statistical inconsistency. Asset size
is negatively significant. This reflects that asset size increases
risk taking, that is, TBTF moral hazard.
Conclusion
This paper uses Japanese commercial bank balance sheet
data to empirically show market discipline effect of subordi-
nated note and debentures. The discipline framework we used
was got from literatures. It recognizes two phases: Monitoring
phase and influencing phase. While the majority of literatures
are dealing with the monitoring phase, that is, whether sub-debt
interest rate spread reflects bank risk or not, that which deals
with influencing phase are not many. One of the reasons is that
modeling influencing phase is not so easy because it requires
modeling bank behavior. We offered an estimation model for
this purpose and circumvented the simultaneous bias by using
the predicted value of SND ratios.
Estimation results supported SND’s market discipline effect.
The more sub-debt and the more bank equity make the bank
reduce excessive risk taking. This is consistent with monitor
theory and moral hazard theory. This empirical work contrib-
utes to existing literatures on sub-debt holders. Sub-debt not
only contains information on bank risk, but also influences
banks to behave toward less risk-taking. Policy makers who are
devising a sound banking supervision system using sub-debt
instruments might require much empirical evidences. This pa-
per would contribute as one empirical work.
REFERENCES
Basel II (2004). Basel II: International convergence of capital meas-
urement and capital standards: A revised framework. Geneva: Basel
Committee Publications.
Chen, A. H., Robinson, K. J., & Siems, T. F. (2004). The wealth effects
from a subordinated debt policy: Evidence from passage of the
Gramm-Leach-Bliley Act. Review of Financial Economics, 13, 103-
119. doi:10.1016/S1058-3300(03)00025-9
Evanoff, D. D., & Wall, L. D. (2001). Sub-debt Yield Spreads as Bank
Risk Measures. Financial Services Research, 20 , 121-145.
doi:10.1023/A:1012408023269
Evanoff, D. D., & Wall, L. D. (2002). Measures of the riskiness of
banking organizations: Subordinated debt yields, risk-based capital,
and examination ratings. Journal of Banking and Finance, 26, 989-
1009. doi:10.1016/S0378-4266(01)00270-9
Goyal, V. K. (2005). Market discipline of bank risk: Evidence from
subordinated debt contracts. Journal of Financial Intermediation, 14,
318-350. doi:10.1016/j.jfi.2004.06.002
Hamalainen, P. (2004). Mandatory subordinated debt and the corporate
governance of banks. Corporate Governance: An International Re-
view, 12, 93-106. doi:10.1111/j.1467-8683.2004.00346.x
Hamalainen, P., Hall, M., & Howcroft, B. (2005). A framework for
market discipline in bank regulatory design. Journal of Business Fi-
nance & Accounting, 32, 183-209.
doi:10.1111/j.0306-686X.2005.00592.x
Jagtiani, J., & Lemieux, C. (2001). Market discipline prior to bank
failure. Journal of Ec o n o mi c s a n d Business, 53, 313-24.
doi:10.1016/S0148-6195(00)00046-1
Kane, E. J. (1987). Dangers of capital forbearance: The case of the
FSLIC and “Zombie” S&Ls. Contemporary Economic Policy, 5, 77-
83. doi:10.1111/j.1465-7287.1987.tb00247.x
Krishnan, C. N. V., Ritchken, P. H., & Thomson, J. B. (2005). Moni-
toring and controlling bank risk: Does risky debt help? The Journal
of Finance, 60, 343-378. doi:10.1111/j.1540-6261.2005.00732.x
Lane, T. D. (1993). Market discipline. International Monetary Fund
Staff Papers, 40, 53-88. doi:10.2307/3867377
Nier, E., & Baumann, U. (2006). Market discipline, disclosure and
moral hazard in banking. Journal of Financial Intermediation, 15,
332-361. doi:10.1016/j.jfi.2006.03.001
Sironi, A. (2003). Testing for market discipline in the European bank-
ing industry: Evidence from subordinated debt issues. Journal of
Money, Credit & Banking, 35, 443-473. doi:10.1353/mcb.2003.0022