Paper Menu >>
Journal Menu >>
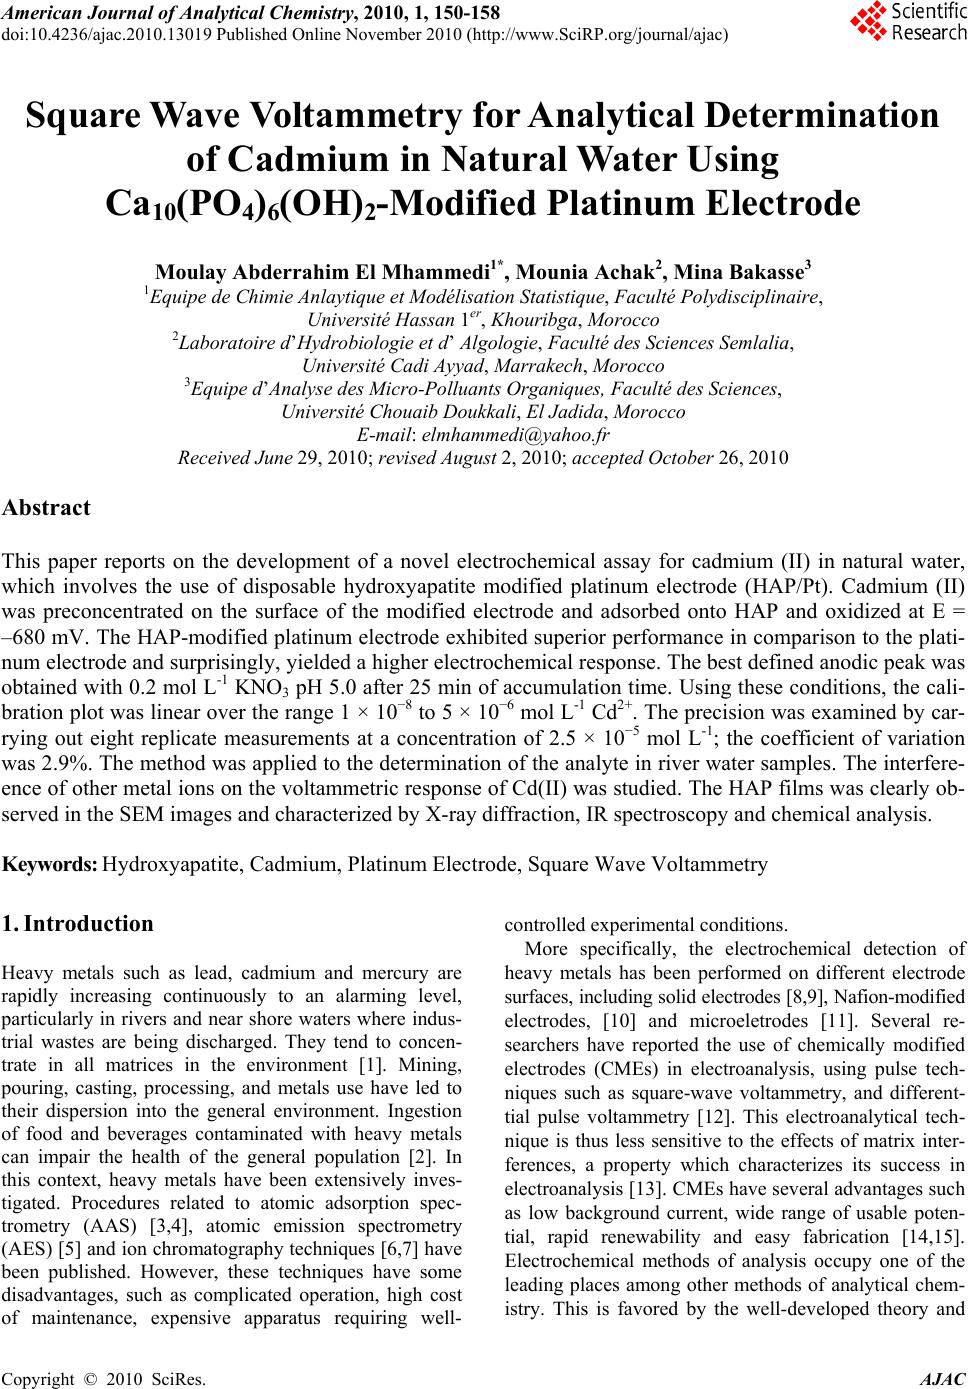 American Journal of Anal yt ical Chemistry, 2010, 1, 150-158 doi:10.4236/ajac.2010.13019 Published Online November 2010 (http://www.SciRP.org/journal/ajac) Copyright © 2010 SciRes. AJAC Square Wave Voltammetry for Analytical Determination of Cadmium in Natural Water Using Ca10(PO4)6(OH)2-Modified Platinum Electr ode Moulay Abderrahim El Mhammedi1*, Mounia Achak2, Mina Bakasse3 1Equipe de Chimie Anlaytique et Modélisation Statistique, Faculté Polydisciplinaire, Université Hassan 1er, Khouribga, Morocco 2Laboratoire d’Hydrobiologie et d’ Algologie, Faculté des Sciences Semlalia, Université Cadi Ayyad, Marrakech, Morocco 3Equipe d’Analyse des Micro-Polluants Organiques, Faculté des Sciences, Université Chouaib Doukkali, El Jadida, Morocco E-mail: elmhammedi@yahoo.fr Received June 29, 2010; revised August 2, 2010; accepted October 26, 2010 Abstract This paper reports on the development of a novel electrochemical assay for cadmium (II) in natural water, which involves the use of disposable hydroxyapatite modified platinum electrode (HAP/Pt). Cadmium (II) was preconcentrated on the surface of the modified electrode and adsorbed onto HAP and oxidized at E = –680 mV. The HAP-modified platinum electrode exhibited superior performance in comparison to the plati- num electrode and surprisingly, yielded a higher electrochemical response. The best defined anodic peak was obtained with 0.2 mol L-1 KNO3 pH 5.0 after 25 min of accumulation time. Using these conditions, the cali- bration plot was linear over the range 1 × 10⁻⁸ to 5 × 10⁻⁶ mol L-1 Cd2+. The precision was examined by car- rying out eight replicate measurements at a concentration of 2.5 × 10⁻⁵ mol L-1; the coefficient of variation was 2.9%. The method was applied to the determination of the analyte in river water samples. The interfere- ence of other metal ions on the voltammetric response of Cd(II) was studied. The HAP films was clearly ob- served in the SEM images and characterized by X-ray diffraction, IR spectroscopy and chemical analysis. Keywords: Hydroxyapatite, Cadmium, Platinum Electrode, Square Wave Voltammetry 1. Introduction Heavy metals such as lead, cadmium and mercury are rapidly increasing continuously to an alarming level, particularly in rivers and near shore waters where indus- trial wastes are being discharged. They tend to concen- trate in all matrices in the environment [1]. Mining, pouring, casting, processing, and metals use have led to their dispersion into the general environment. Ingestion of food and beverages contaminated with heavy metals can impair the health of the general population [2]. In this context, heavy metals have been extensively inves- tigated. Procedures related to atomic adsorption spec- trometry (AAS) [3,4], atomic emission spectrometry (AES) [5] and ion chromatography techniques [6,7] have been published. However, these techniques have some disadvantages, such as complicated operation, high cost of maintenance, expensive apparatus requiring well- controlled experimental conditions. More specifically, the electrochemical detection of heavy metals has been performed on different electrode surfaces, including solid electrodes [8,9], Nafion-modified electrodes, [10] and microeletrodes [11]. Several re- searchers have reported the use of chemically modified electrodes (CMEs) in electroanalysis, using pulse tech- niques such as square-wave voltammetry, and different- tial pulse voltammetry [12]. This electroanalytical tech- nique is thus less sensitive to the effects of matrix inter- ferences, a property which characterizes its success in electroanalysis [13]. CMEs have several advantages such as low background current, wide range of usable poten- tial, rapid renewability and easy fabrication [14,15]. Electrochemical methods of analysis occupy one of the leading places among other methods of analytical chem- istry. This is favored by the well-developed theory and 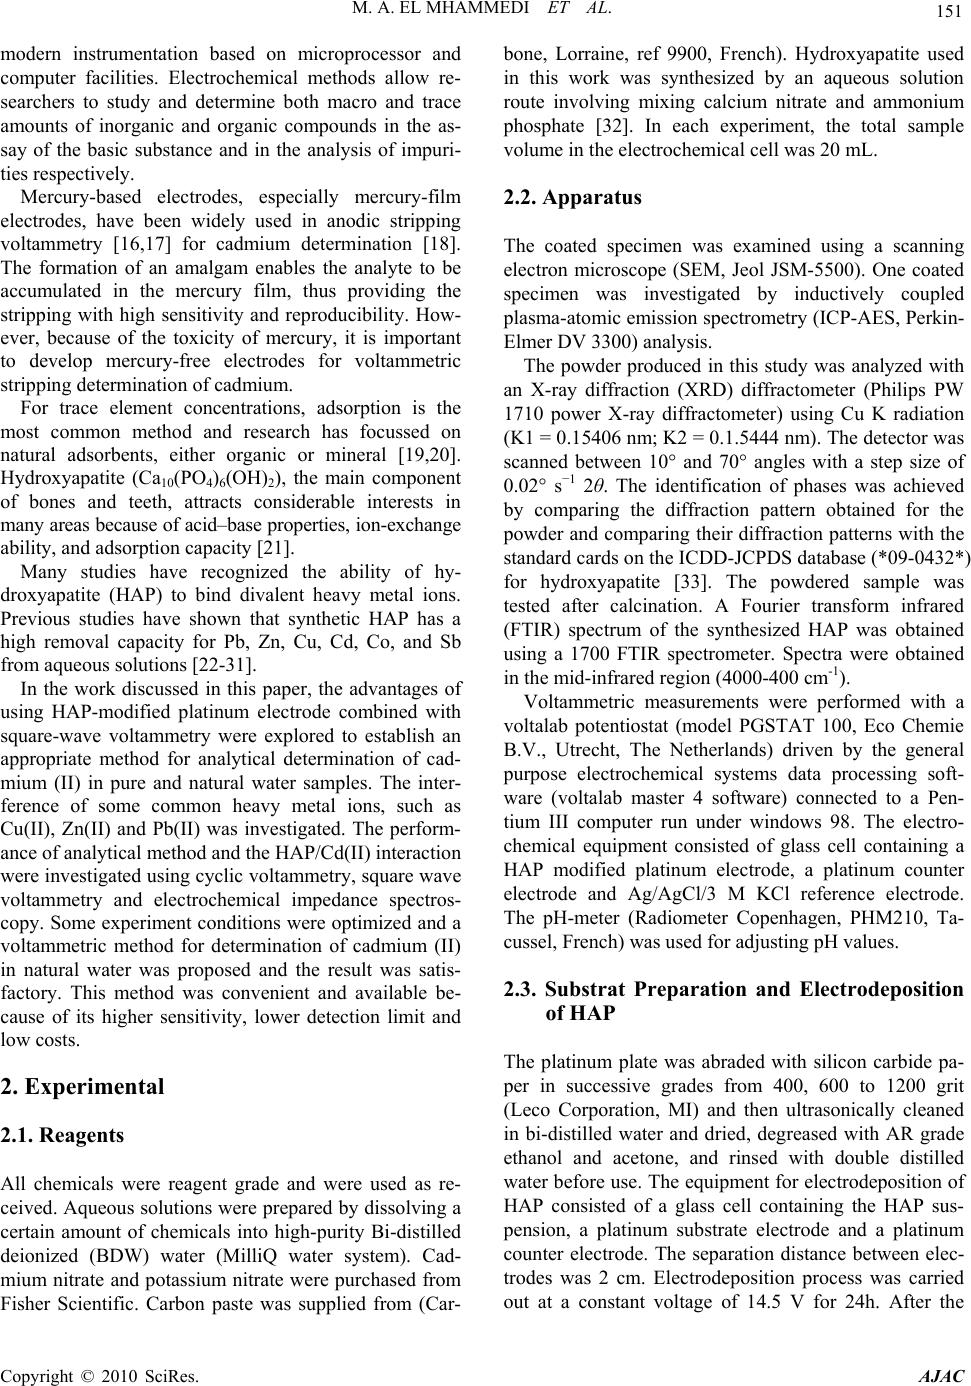 M. A. EL MHAMMEDI ET AL. 151 modern instrumentation based on microprocessor and computer facilities. Electrochemical methods allow re- searchers to study and determine both macro and trace amounts of inorganic and organic compounds in the as- say of the basic substance and in the analysis of impuri- ties respectively. Mercury-based electrodes, especially mercury-film electrodes, have been widely used in anodic stripping voltammetry [16,17] for cadmium determination [18]. The formation of an amalgam enables the analyte to be accumulated in the mercury film, thus providing the stripping with high sensitivity and reproducibility. How- ever, because of the toxicity of mercury, it is important to develop mercury-free electrodes for voltammetric stripping determination of cadmium. For trace element concentrations, adsorption is the most common method and research has focussed on natural adsorbents, either organic or mineral [19,20]. Hydroxyapatite (Ca10(PO4)6(OH)2), the main component of bones and teeth, attracts considerable interests in many areas because of acid–base properties, ion-exchange ability, and adsorption capacity [21]. Many studies have recognized the ability of hy- droxyapatite (HAP) to bind divalent heavy metal ions. Previous studies have shown that synthetic HAP has a high removal capacity for Pb, Zn, Cu, Cd, Co, and Sb from aqueous solutions [22-31]. In the work discussed in this paper, the advantages of using HAP-modified platinum electrode combined with square-wave voltammetry were explored to establish an appropriate method for analytical determination of cad- mium (II) in pure and natural water samples. The inter- ference of some common heavy metal ions, such as Cu(II), Zn(II) and Pb(II) was investigated. The perform- ance of analytical method and the HAP/Cd(II) interaction were investigated using cyclic voltammetry, square wave voltammetry and electrochemical impedance spectros- copy. Some experiment conditions were optimized and a voltammetric method for determination of cadmium (II) in natural water was proposed and the result was satis- factory. This method was convenient and available be- cause of its higher sensitivity, lower detection limit and low costs. 2. Experimental 2.1. Reagents All chemicals were reagent grade and were used as re- ceived. Aqueous solutions were prepared by dissolving a certain amount of chemicals into high-purity Bi-distilled deionized (BDW) water (MilliQ water system). Cad- mium nitrate and potassium nitrate were purchased from Fisher Scientific. Carbon paste was supplied from (Car- bone, Lorraine, ref 9900, French). Hydroxyapatite used in this work was synthesized by an aqueous solution route involving mixing calcium nitrate and ammonium phosphate [32]. In each experiment, the total sample volume in the electrochemical cell was 20 mL. 2.2. Apparatus The coated specimen was examined using a scanning electron microscope (SEM, Jeol JSM-5500). One coated specimen was investigated by inductively coupled plasma-atomic emission spectrometry (ICP-AES, Perkin- Elmer DV 3300) analysis. The powder produced in this study was analyzed with an X-ray diffraction (XRD) diffractometer (Philips PW 1710 power X-ray diffractometer) using Cu K radiation (K1 = 0.15406 nm; K2 = 0.1.5444 nm). The detector was scanned between 10° and 70° angles with a step size of 0.02° s−1 2θ. The identification of phases was achieved by comparing the diffraction pattern obtained for the powder and comparing their diffraction patterns with the standard cards on the ICDD-JCPDS database (*09-0432*) for hydroxyapatite [33]. The powdered sample was tested after calcination. A Fourier transform infrared (FTIR) spectrum of the synthesized HAP was obtained using a 1700 FTIR spectrometer. Spectra were obtained in the mid-infrared region (4000-400 cm-1). Voltammetric measurements were performed with a voltalab potentiostat (model PGSTAT 100, Eco Chemie B.V., Utrecht, The Netherlands) driven by the general purpose electrochemical systems data processing soft- ware (voltalab master 4 software) connected to a Pen- tium III computer run under windows 98. The electro- chemical equipment consisted of glass cell containing a HAP modified platinum electrode, a platinum counter electrode and Ag/AgCl/3 M KCl reference electrode. The pH-meter (Radiometer Copenhagen, PHM210, Ta- cussel, French) was used for adjusting pH values. 2.3. Substrat Preparation and Electrodeposition of HAP The platinum plate was abraded with silicon carbide pa- per in successive grades from 400, 600 to 1200 grit (Leco Corporation, MI) and then ultrasonically cleaned in bi-distilled water and dried, degreased with AR grade ethanol and acetone, and rinsed with double distilled water before use. The equipment for electrodeposition of HAP consisted of a glass cell containing the HAP sus- pension, a platinum substrate electrode and a platinum counter electrode. The separation distance between elec- trodes was 2 cm. Electrodeposition process was carried out at a constant voltage of 14.5 V for 24h. After the Copyright © 2010 SciRes. AJAC  152 M. A. EL MHAMMEDI ET AL. electrodeposition process, the coated platinum substrate was removed from the suspension and was dried at room temperature. 2.4. Physico-chemical Characterization of Electrodeposit Scanning electron microscopy (SEM) was used to ob- serve the morphology of samples. The coating formed on platinum support was characterized by X-ray diffraction (XRD) and Fourier transform infrared spectroscopy (FTIR). ICP-AES permitted also the quantitative deter- mination of Ca and P. 2.5. Analytical Procedure The electrode was first immersed in a preconcentration solution containing the cadmium ions, where the accu- mulation of cadmium ions was achieved chemically by binding to hydroxyapatite at open circuit. The electrode was then removed from the accumulation cell, rinsed with water, and transferred to the separate voltammetric cell containing only a supporting electrolyte (0.2 mol L-1 KNO3). The same procedure was carried out in sample analysis and all electrochemical experiments were car- ried out at room temperature. The HAP modified platinum electrode (HAP/Pt) was characterized by impedance spectroscopy (EIS). This measurement was carried out with the same electro- chemical system described above before and after im- mersion in solution containing cadmium (II) ions. The frequencies between 100 kHz and 10 MHz can be mea- sured with AC amplitude of 5-10 mV at 0 mV. Computer programs automatically controlled the measurements performed at rest potentials after 30 min of exposure. The impedance diagrams are given in the Nyquist repre- sentation. The charge-transfer resistance (Rt) values are calculated from the difference in impedance at lower and higher frequencies, as suggested by Tsurus et al. [34]. The double-layer capacitance (Cdl) and the frequency at which the imaginary component of the impedance is maximal (−Zmax) are found as represented in the equa- tion: Cdl = 1/Rt were = 2fmax (1) After accumulation step, the electrodeposit layer was analyzed at carbon paste electrode (CPE) by cyclic voltammetry. The carbon paste was prepared by hand mixing of high purity graphite powder with HAP in weight ratio 1:1. Experiments were conducted using the square-wave- voltammetry technique by deposition of the target cad- mium (II) at open circuit. The accumulated metal was then anodically oxidised at the potential ranging from –1.0 to –0.4 V using a step potential of 25 mV; ampli- tude 5 mV and duration 5 sec at scan rate 1 mV s-1. After the optimization of the voltammetric parameters, analytical curves were obtained in pure electrolyte by the standard addition method for cadmium (II). The standard deviation of the mean current ( ) was measured at the oxidation potential of cadmium for seven voltammo- grams of the blank solution in pure electrolytes for the determination of the quantification limit (QL, 3 ) and the detection limit (DL, 10 ) together with the slope of the straight line of the analytical curves. The method of standard additions was used for analysis of real samples, by spiking with appropriate amounts of standard Cd(II) solution. All measurements were taken at room tempera- ture. 3. Results and Discussion 3.1. Electrode Synthesis Figure 1 shows SEM micrograph of the calcium phos- phate coating obtained at a potential of E = 14.5V. It was observed that the powder layer exhibited a porous micro- structure with micropores which were relatively well separated and homogeneously distributed over the sur- face. The Ca/P ratio deduced from ICP-AES analysis is: Ca/P = 1.67. This Ca/P ratio value corresponds to a sto- chiometrc Ca-hydroxyapatite. This was confirmed by the XRD pattern (Figure 2) which shows the typical diffrac- tion peaks at 25.8°~31.6°~32.1°~32.7° and 34° corre- sponding to the Ca-HAP as indicated in Joint Committee on Powder Diffraction Standards card no. 09-0432. It should be noted that the development of refined HAP was not the only prime objective of the present work but Figure 1. Scanning electron micrograph of apatite/plati- um. n Copyright © 2010 SciRes. AJAC  M. A. EL MHAMMEDI ET AL. Copyright © 2010 SciRes. AJAC 153 Figure 2. IR spectra of the apatite deposed on the platinum surfaces after analysis at 900°C for 3 h. to develop an adsorbent calcium phosphate coating with high activity. The IR spectra of the investigated HAP powder (Fig- ure 3) shows the typical absorption bands related to the modes of phosphate (470 cm−1; 565 cm−1; 960 cm−1; 1035 cm−1), hydroxyl (3570 cm−1) and water (1635 cm−1; 3410 cm−1). 3.2. Voltammetric Characteristics Figure 4 shows the uptake of cadmium (II) by the HAP-modified platinum electrode (HAP/Pt). The volt ammograms were obtained by using cyclic voltammetry (CV) at an effective scan rate of 100 mV s-1. The base curve, which shows no peak, was obtained with HAP/Pt before preconcentration step in Cd(II) solution. As it can be seen from Figure 4(b), the peak current appeared after the preconcentration step, manifesting the uptake of Cd(II) by HAP-modified platinum electrode from bulk solution. 3.3. Electrochemical Impedance Spectroscopy Figure 5 shows the impedance diagram for HAP-modified platinum electrode (HAP/Pt) before and after preconcen- tration step in 3 10-4 mol L-1 cadmium (II) solution. Similar Nyquist diagrams were obtained in 0.2 mol L-1 KNO3 electrolyte. The parameters associated with the diagrams impedance are given in Table 1, as it can be seen from the figure, the Nyquist plots contain depressed semi-circles with the centre under the real axis; this kind of phenomenon is known as dispersing effect. It appears clearly from these data that the capacitance at the inter- face increases when the HAP/Pt is exposed to cadmium (II). This observation is in agreement with the literature in the case of adsorption phenomenon at the electrode surface. Our result gives another evidence for Cd(II) ad- sorption on the HAP layer as part of an integrated proc- ess leading to the electrolytic reduction of the heavy metal at the modified surface. The observed decrease of the charge-transfer resistance means also that the modi- fied electrode becomes more conductive, which can be explained by the presence of cadmium on the electrode surface. Figure 3. XRD of hydroxyapatite layer on platinum sur- faces, calcined at 900°C for 3 h. 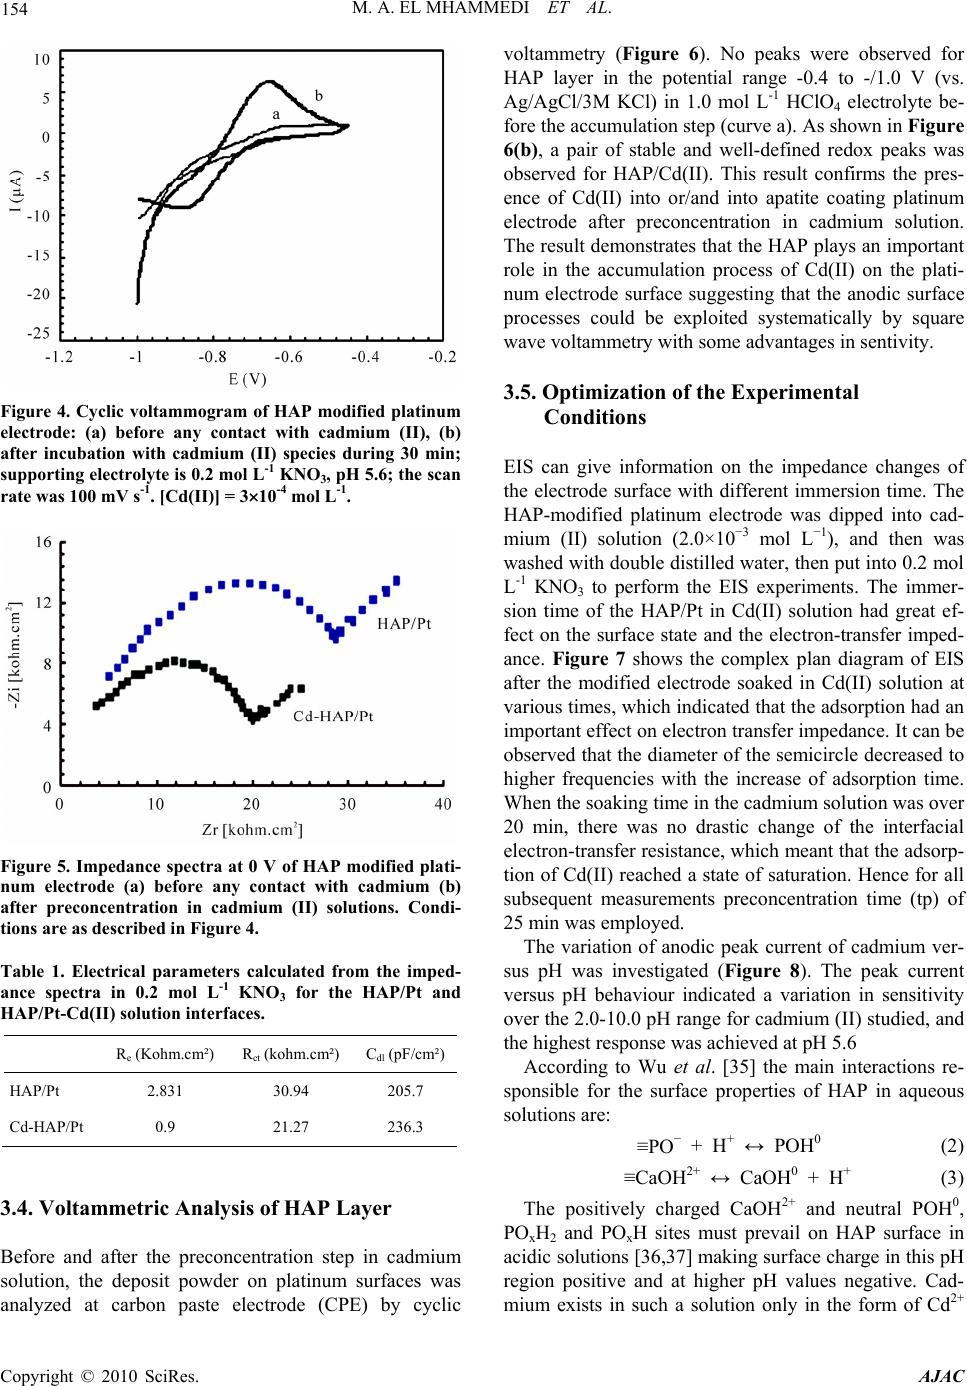 154 M. A. EL MHAMMEDI ET AL. Figure 4. Cyclic voltammogram of HAP modified platinum electrode: (a) before any contact with cadmium (II), (b) after incubation with cadmium (II) species during 30 min; supporting electrolyte is 0.2 mol L-1 KNO3, pH 5.6; the scan rate was 100 mV s-1. [Cd(II)] = 310-4 mol L-1. Figure 5. Impedance spectra at 0 V of HAP modified plati- num electrode (a) before any contact with cadmium (b) after preconcentration in cadmium (II) solutions. Condi- tions are as described in Figure 4. Table 1. Electrical parameters calculated from the imped- ance spectra in 0.2 mol L-1 KNO3 for the HAP/Pt and HAP/Pt-Cd(II) solution interfaces. R e (Kohm.cm²) Rct (kohm.cm²) Cdl (pF/cm²) HAP/Pt 2.831 30.94 205.7 Cd-HAP/Pt 0.9 21.27 236.3 3.4. Voltammetric Analysis of HAP Layer Before and after the preconcentration step in cadmium solution, the deposit powder on platinum surfaces was analyzed at carbon paste electrode (CPE) by cyclic voltammetry (Figure 6). No peaks were observed for HAP layer in the potential range -0.4 to -/1.0 V (vs. Ag/AgCl/3M KCl) in 1.0 mol L-1 HClO4 electrolyte be- fore the accumulation step (curve a). As shown in Figure 6(b), a pair of stable and well-defined redox peaks was observed for HAP/Cd(II). This result confirms the pres- ence of Cd(II) into or/and into apatite coating platinum electrode after preconcentration in cadmium solution. The result demonstrates that the HAP plays an important role in the accumulation process of Cd(II) on the plati- num electrode surface suggesting that the anodic surface processes could be exploited systematically by square wave voltammetry with some advantages in sentivity. 3.5. Optimization of the Experimental Conditions EIS can give information on the impedance changes of the electrode surface with different immersion time. The HAP-modified platinum electrode was dipped into cad- mium (II) solution (2.0×10⁻³ mol L−1), and then was washed with double distilled water, then put into 0.2 mol L-1 KNO3 to perform the EIS experiments. The immer- sion time of the HAP/Pt in Cd(II) solution had great ef- fect on the surface state and the electron-transfer imped- ance. Figure 7 shows the complex plan diagram of EIS after the modified electrode soaked in Cd(II) solution at various times, which indicated that the adsorption had an important effect on electron transfer impedance. It can be observed that the diameter of the semicircle decreased to higher frequencies with the increase of adsorption time. When the soaking time in the cadmium solution was over 20 min, there was no drastic change of the interfacial electron-transfer resistance, which meant that the adsorp- tion of Cd(II) reached a state of saturation. Hence for all subsequent measurements preconcentration time (tp) of 25 min was employed. The variation of anodic peak current of cadmium ver- sus pH was investigated (Figure 8). The peak current versus pH behaviour indicated a variation in sensitivity over the 2.0-10.0 pH range for cadmium (II) studied, and the highest response was achieved at pH 5.6 According to Wu et al. [35] the main interactions re- sponsible for the surface properties of HAP in aqueous solutions are: ≡PO− + H+ ↔ POH0 (2) ≡CaOH2+ ↔ CaOH0 + H+ (3) The positively charged CaOH2+ and neutral POH0, POxH2 and POxH sites must prevail on HAP surface in acidic solutions [36,37] making surface charge in this pH region positive and at higher pH values negative. Cad- mium exists in such a solution only in the form of Cd2+ Copyright © 2010 SciRes. AJAC 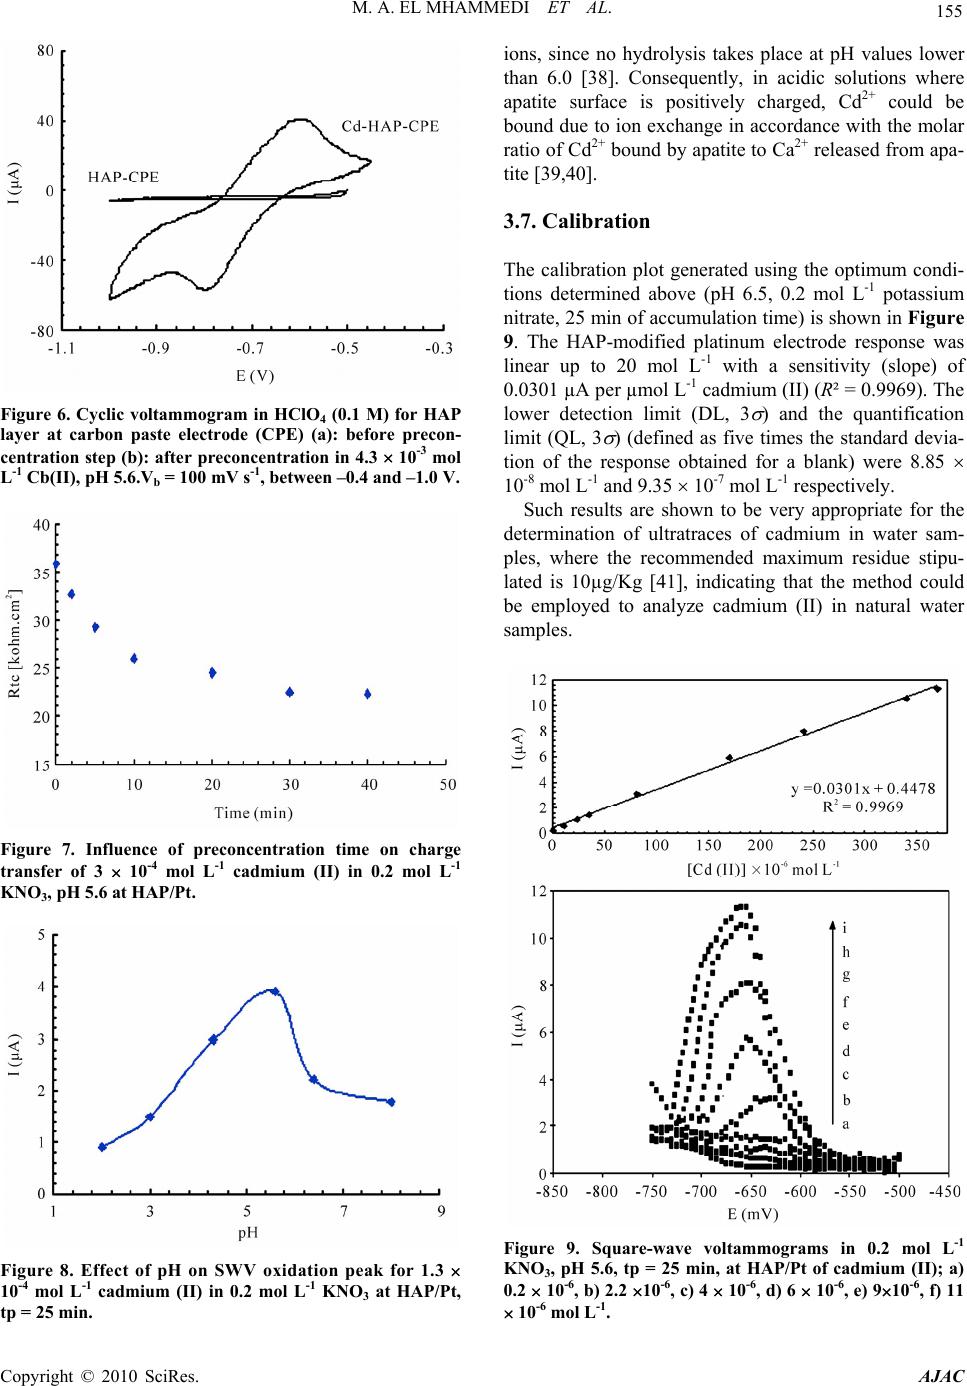 M. A. EL MHAMMEDI ET AL. 155 Figure 6. Cyclic voltammogram in HClO4 (0.1 M) for HAP layer at carbon paste electrode (CPE) (a): before precon- centration step (b): after preconcentration in 4.3 10-3 mol L-1 Cb(II), pH 5.6.Vb = 100 mV s-1, between –0.4 and –1.0 V. Figure 7. Influence of preconcentration time on charge transfer of 3 10-4 mol L-1 cadmium (II) in 0.2 mol L-1 KNO3, pH 5.6 at HAP/Pt. Figure 8. Effect of pH on SWV oxidation peak for 1.3 10-4 mol L-1 cadmium (II) in 0.2 mol L-1 KNO3 at HAP/Pt, tp = 25 min. ions, since no hydrolysis takes place at pH values lower than 6.0 [38]. Consequently, in acidic solutions where apatite surface is positively charged, Cd2+ could be bound due to ion exchange in accordance with the molar ratio of Cd2+ bound by apatite to Ca2+ released from apa- tite [39,40]. 3.7. Calibration The calibration plot generated using the optimum condi- tions determined above (pH 6.5, 0.2 mol L-1 potassium nitrate, 25 min of accumulation time) is shown in Figure 9. The HAP-modified platinum electrode response was linear up to 20 mol L-1 with a sensitivity (slope) of 0.0301 µA per µmol L-1 cadmium (II) (R² = 0.9969). The lower detection limit (DL, 3 ) and the quantification limit (QL, 3 ) (defined as five times the standard devia- tion of the response obtained for a blank) were 8.85 10-8 mol L-1 and 9.35 10-7 mol L-1 respectively. Such results are shown to be very appropriate for the determination of ultratraces of cadmium in water sam- ples, where the recommended maximum residue stipu- lated is 10µg/Kg [41], indicating that the method could be employed to analyze cadmium (II) in natural water samples. Figure 9. Square-wave voltammograms in 0.2 mol L-1 KNO3, pH 5.6, tp = 25 min, at HAP/Pt of cadmium (II); a) 0.2 10-6, b) 2.2 10-6, c ) 4 10-6, d) 6 10-6, e) 910-6, f) 11 10-6 mol L-1. Copyright © 2010 SciRes. AJAC 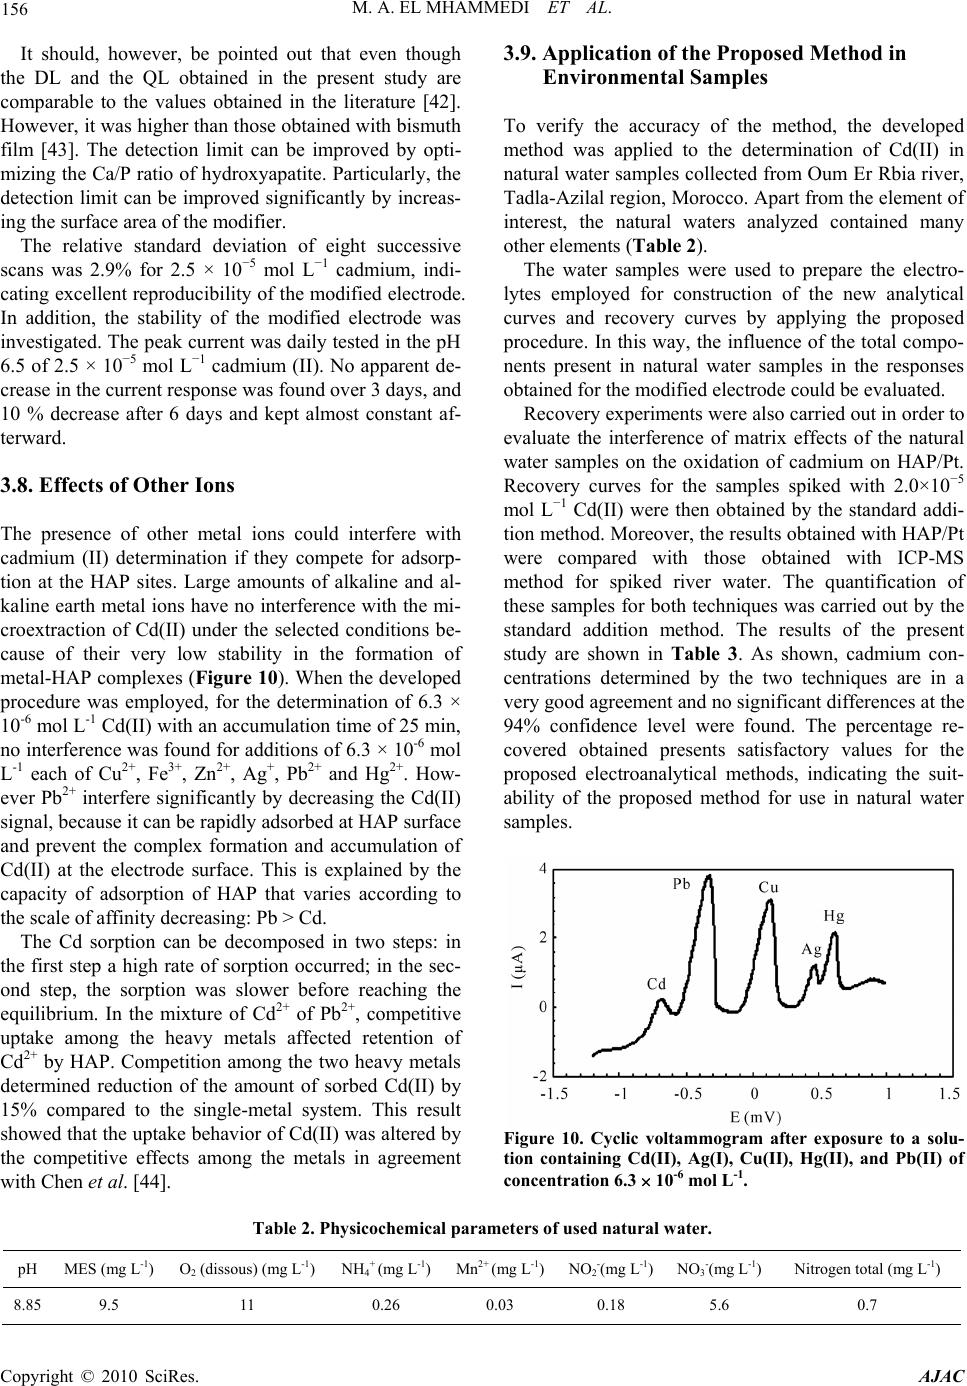 M. A. EL MHAMMEDI ET AL. Copyright © 2010 SciRes. AJAC 156 3.9. Application of the Proposed Method in Environmental Samples It should, however, be pointed out that even though the DL and the QL obtained in the present study are comparable to the values obtained in the literature [42]. However, it was higher than those obtained with bismuth film [43]. The detection limit can be improved by opti- mizing the Ca/P ratio of hydroxyapatite. Particularly, the detection limit can be improved significantly by increas- ing the surface area of the modifier. To verify the accuracy of the method, the developed method was applied to the determination of Cd(II) in natural water samples collected from Oum Er Rbia river, Tadla-Azilal region, Morocco. Apart from the element of interest, the natural waters analyzed contained many other elements (Table 2). The relative standard deviation of eight successive scans was 2.9% for 2.5 × 10⁻⁵ mol L−1 cadmium, indi- cating excellent reproducibility of the modified electrode. In addition, the stability of the modified electrode was investigated. The peak current was daily tested in the pH 6.5 of 2.5 × 10⁻⁵ mol L−1 cadmium (II). No apparent de- crease in the current response was found over 3 days, and 10 % decrease after 6 days and kept almost constant af- terward. The water samples were used to prepare the electro- lytes employed for construction of the new analytical curves and recovery curves by applying the proposed procedure. In this way, the influence of the total compo- nents present in natural water samples in the responses obtained for the modified electrode could be evaluated. Recovery experiments were also carried out in order to evaluate the interference of matrix effects of the natural water samples on the oxidation of cadmium on HAP/Pt. Recovery curves for the samples spiked with 2.0×10⁻⁵ mol L−1 Cd(II) were then obtained by the standard addi- tion method. Moreover, the results obtained with HAP/Pt were compared with those obtained with ICP-MS method for spiked river water. The quantification of these samples for both techniques was carried out by the standard addition method. The results of the present study are shown in Table 3. As shown, cadmium con- centrations determined by the two techniques are in a very good agreement and no significant differences at the 94% confidence level were found. The percentage re- covered obtained presents satisfactory values for the proposed electroanalytical methods, indicating the suit- ability of the proposed method for use in natural water samples. 3.8. Effects of Other Ions The presence of other metal ions could interfere with cadmium (II) determination if they compete for adsorp- tion at the HAP sites. Large amounts of alkaline and al- kaline earth metal ions have no interference with the mi- croextraction of Cd(II) under the selected conditions be- cause of their very low stability in the formation of metal-HAP complexes (Figure 10). When the developed procedure was employed, for the determination of 6.3 × 10⁻⁶ mol L-1 Cd(II) with an accumulation time of 25 min, no interference was found for additions of 6.3 × 10⁻⁶ mol L-1 each of Cu2+, Fe3+, Zn2+, Ag+, Pb2+ and Hg2+. How- ever Pb2+ interfere significantly by decreasing the Cd(II) signal, because it can be rapidly adsorbed at HAP surface and prevent the complex formation and accumulation of Cd(II) at the electrode surface. This is explained by the capacity of adsorption of HAP that varies according to the scale of affinity decreasing: Pb > Cd. The Cd sorption can be decomposed in two steps: in the first step a high rate of sorption occurred; in the sec- ond step, the sorption was slower before reaching the equilibrium. In the mixture of Cd2+ of Pb2+, competitive uptake among the heavy metals affected retention of Cd2+ by HAP. Competition among the two heavy metals determined reduction of the amount of sorbed Cd(II) by 15% compared to the single-metal system. This result showed that the uptake behavior of Cd(II) was altered by the competitive effects among the metals in agreement with Chen et al. [44]. Figure 10. Cyclic voltammogram after exposure to a solu- tion containing Cd(II), Ag(I), Cu(II), Hg(II), and Pb(II) of concentration 6.3 10-6 mol L-1. Table 2. Physicochemical parameters of used natural water. pH MES (mg L-1) O2 (dissous) (mg L-1) NH4+ (mg L-1)Mn2+ (mg L-1)NO2-(mg L-1)NO3-(mg L-1) Nitrogen total (mg L-1) 8.85 9.5 11 0.26 0.03 0.18 5.6 0.7 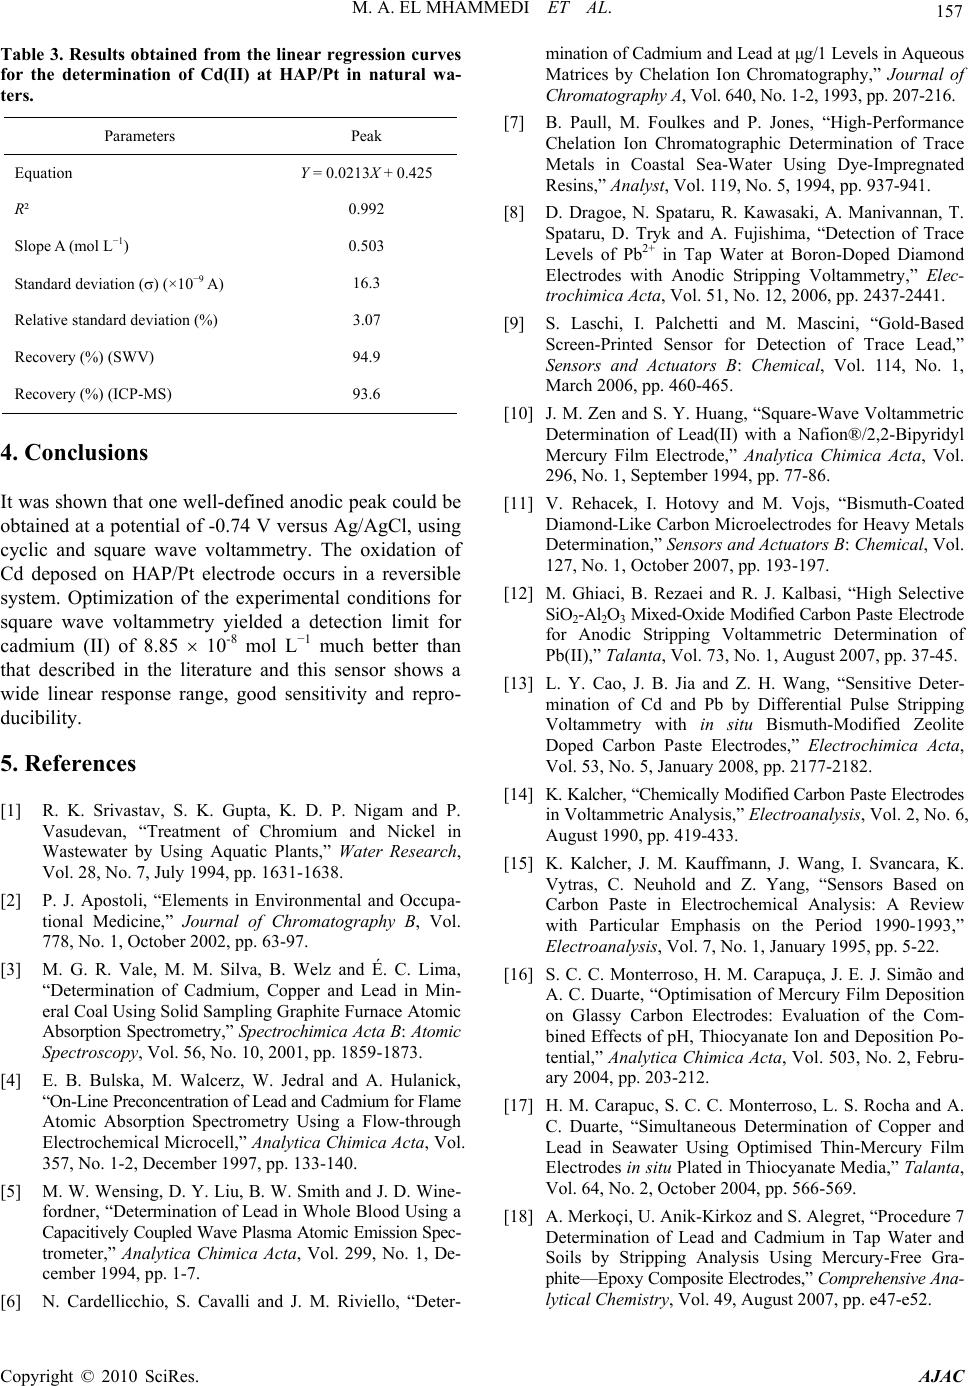 M. A. EL MHAMMEDI ET AL. Copyright © 2010 SciRes. AJAC 157 Table 3. Results obtained from the linear regression curves for the determination of Cd(II) at HAP/Pt in natural wa- ters. Parameters Peak Equation Y = 0.0213X + 0.425 R² 0.992 Slope A (mol L−1) 0.503 Standard deviation () (×10−9 A) 16.3 Relative standard deviation (%) 3.07 Recovery (%) (SWV) 94.9 Recovery (%) (ICP-MS) 93.6 4. Conclusions It was shown that one well-defined anodic peak could be obtained at a potential of -0.74 V versus Ag/AgCl, using cyclic and square wave voltammetry. The oxidation of Cd deposed on HAP/Pt electrode occurs in a reversible system. Optimization of the experimental conditions for square wave voltammetry yielded a detection limit for cadmium (II) of 8.85 10-8 mol L−1 much better than that described in the literature and this sensor shows a wide linear response range, good sensitivity and repro- ducibility. 5. References [1] R. K. Srivastav, S. K. Gupta, K. D. P. Nigam and P. Vasudevan, “Treatment of Chromium and Nickel in Wastewater by Using Aquatic Plants,” Water Research, Vol. 28, No. 7, July 1994, pp. 1631-1638. [2] P. J. Apostoli, “Elements in Environmental and Occupa- tional Medicine,” Journal of Chromatography B, Vol. 778, No. 1, October 2002, pp. 63-97. [3] M. G. R. Vale, M. M. Silva, B. Welz and É. C. Lima, “Determination of Cadmium, Copper and Lead in Min- eral Coal Using Solid Sampling Graphite Furnace Atomic Absorption Spectrometry,” Spectrochimica Acta B: Atomic Spectroscopy, Vol. 56, No. 10, 2001, pp. 1859-1873. [4] E. B. Bulska, M. Walcerz, W. Jedral and A. Hulanick, “On-Line Preconcentration of Lead and Cadmium for Flame Atomic Absorption Spectrometry Using a Flow-through Electrochemical Microcell,” Analytica Chimica Acta, Vol. 357, No. 1-2, December 1997, pp. 133-140. [5] M. W. Wensing, D. Y. Liu, B. W. Smith and J. D. Wine- fordner, “Determination of Lead in Whole Blood Using a Capacitively Coupled Wave Plasma Atomic Emission Spec- trometer,” Analytica Chimica Acta, Vol. 299, No. 1, De- cember 1994, pp. 1-7. [6] N. Cardellicchio, S. Cavalli and J. M. Riviello, “Deter- mination of Cadmium and Lead at μg/1 Levels in Aqueous Matrices by Chelation Ion Chromatography,” Journal of Chromatography A, Vol. 640, No. 1-2, 1993, pp. 207-216. [7] B. Paull, M. Foulkes and P. Jones, “High-Performance Chelation Ion Chromatographic Determination of Trace Metals in Coastal Sea-Water Using Dye-Impregnated Resins,” Analyst, Vol. 119, No. 5, 1994, pp. 937-941. [8] D. Dragoe, N. Spataru, R. Kawasaki, A. Manivannan, T. Spataru, D. Tryk and A. Fujishima, “Detection of Trace Levels of Pb2+ in Tap Water at Boron-Doped Diamond Electrodes with Anodic Stripping Voltammetry,” Elec- trochimica Acta, Vol. 51, No. 12, 2006, pp. 2437-2441. [9] S. Laschi, I. Palchetti and M. Mascini, “Gold-Based Screen-Printed Sensor for Detection of Trace Lead,” Sensors and Actuators B: Chemical , Vol. 114, No. 1, March 2006, pp. 460-465. [10] J. M. Zen and S. Y. Huang, “Square-Wave Voltammetric Determination of Lead(II) with a Nafion®/2,2-Bipyridyl Mercury Film Electrode,” Analytica Chimica Acta, Vol. 296, No. 1, September 1994, pp. 77-86. [11] V. Rehacek, I. Hotovy and M. Vojs, “Bismuth-Coated Diamond-Like Carbon Microelectrodes for Heavy Metals Determination,” Sensors and Actuators B: Chemical, Vol. 127, No. 1, October 2007, pp. 193-197. [12] M. Ghiaci, B. Rezaei and R. J. Kalbasi, “High Selective SiO2-Al2O3 Mixed-Oxide Modified Carbon Paste Electrode for Anodic Stripping Voltammetric Determination of Pb(II),” Talanta, Vol. 73, No. 1, August 2007, pp. 37-45. [13] L. Y. Cao, J. B. Jia and Z. H. Wang, “Sensitive Deter- mination of Cd and Pb by Differential Pulse Stripping Voltammetry with in situ Bismuth-Modified Zeolite Doped Carbon Paste Electrodes,” Electrochimica Acta, Vol. 53, No. 5, January 2008, pp. 2177-2182. [14] K. Kalcher, “Chemically Modified Carbon Paste Electrodes in Voltammetric Analysis,” Electroanalysis, Vol. 2, No. 6, August 1990, pp. 419-433. [15] K. Kalcher, J. M. Kauffmann, J. Wang, I. Svancara, K. Vytras, C. Neuhold and Z. Yang, “Sensors Based on Carbon Paste in Electrochemical Analysis: A Review with Particular Emphasis on the Period 1990-1993,” Electroanalysis, Vol. 7, No. 1, January 1995, pp. 5-22. [16] S. C. C. Monterroso, H. M. Carapuça, J. E. J. Simão and A. C. Duarte, “Optimisation of Mercury Film Deposition on Glassy Carbon Electrodes: Evaluation of the Com- bined Effects of pH, Thiocyanate Ion and Deposition Po- tential,” Analytica Chimica Acta, Vol. 503, No. 2, Febru- ary 2004, pp. 203-212. [17] H. M. Carapuc, S. C. C. Monterroso, L. S. Rocha and A. C. Duarte, “Simultaneous Determination of Copper and Lead in Seawater Using Optimised Thin-Mercury Film Electrodes in situ Plated in Thiocyanate Media,” Talanta, Vol. 64, No. 2, October 2004, pp. 566-569. [18] A. Merkoçi, U. Anik-Kirkoz and S. Alegret, “Procedure 7 Determination of Lead and Cadmium in Tap Water and Soils by Stripping Analysis Using Mercury-Free Gra- phite—Epoxy Composite Electrodes,” Comprehensive Ana- lytical Chemistry, Vol. 49, August 2007, pp. e47-e52.  158 M. A. EL MHAMMEDI ET AL. [19] A. Denzli, B. Garipcan, S. Emir, S. Patir and R. Say, “Heavy Metal Ion Adsorption Properties of Methacry- lamidocysteine-Containing Porous Poly (Hydroxyethyl Methacrylate) Chelating Beads,” Adsorption Science and Technology, Vol. 207, No. 7, 2002, pp. 607-617. [20] E. Deydier, R. Guilet and P. Sharrock, “Beneficial Use of Meat and Bone Meal Combustion Residue: ‘An Efficient Low Cost Material to Remove Lead from Aqueous Ef- fluent’,” Journal of Hazardous Materials, Vol. 101, No. 1, July 2003, pp. 55-64. [21] K. Mori, K. Yamaguchi, T. Hara, T. Mizugaki, K. Ebitani and K. Kaneda, “Controlled Synthesis of Hydroxyapatite- Supported Palladium Complexes as Highly Efficient Hete- rogeneous Catalysts,” Journal of the American Chemical Society, Vol. 124, No. 39, 2002, pp. 11572-11573. [22] T. Suzuki, T. Hatsushika and M. Michihiro, “Synthetic Hydroxyapatites as Inorganic Cation Exchangers. Part 2,” Journal of the Chemical Society, Faraday Transactions, Vol. 1, No. 78, 1982, pp. 3605-3611. [23] Q. Y. Ma, T. J. Logan, S. J. Traina and J. A. Ryan, “Effects of Aqueous Al, Cd, Cu, Fe(II), Ni, and Zn on Pb Immobilization by Hydroxyapatite,” Environmental Science & Technology, Vol. 28, No. 7, July 1994, pp. 1219-1228. [24] Y. Xu, F. W. Schwartz and S. J. Traina, “Sorption of Zn2+ and Cd2+ on Hydroxyapatite Surfaces,” Environmental Science & Technology, Vol. 28, No. 8, August 1994, pp. 1472-1480. [25] A. G. Leyva, J. Marrero, P. Smichowski and D. Cicerone, “Sorption of Antimony onto Hydroxyapatite,” Environ- mental Science & Technology, Vol. 35, No. 18, August 2001, pp. 3669-3675. [26] J. A. G. del Río, P. J. Morando and D. S. Cicerone, “Natural Materials for Treatment of Industrial Effluents: Comparative Study of the Retention of Cd, Zn and Co by Calcite and Hydroxyapatite. Part I: Batch Experiments,” Journal of Environmental Management, Vol. 71, No. 2, June 2004, pp. 169-177. [27] M. Peld, K. Tõnsuaadu and V. Bender, “Sorption and Desorption of Cd2+ and Zn2+ Ions in Apatite-Aqueous Systems,” Environmental Science & Technology, Vol. 38, No. 21, September 2004, pp. 5626-5631. [28] A. Corami, S. Mignardi and V. Ferrini, “Copper and Zinc Decontamination from Single- and Binary-Metal Solutions Using Hydroxyapatite,” Journal of Hazardous Materials, Vol. 146, No. 1-2, July 2007, pp. 164-170. [29] I. Smiciklas, S. Dimovic, I. Plecaš and M. Mitric, “Re- moval of Co2+ from Aqueous Solutions by Hydroxyapa- tite,” Water Research, Vol. 40, No. 12, 2006, pp. 2267-2274. [30] A. Yasukawa, T. Yokoyama, K. Kandori and T. Ishikawa, “Reaction of Calcium Hydroxyapatite with Cd2+ and Pb2+ ions,” Colloids and Surfaces A: Physicochemical and En- gineering Aspects, Vol. 299, No. 1-3, 2007, pp. 203-208. [31] R. R. Sheha, “Sorption Behavior of Zn(II) Ions on Syn- thesized Hydroxyapatites,” Journal of Colloid and Inter- face Science, Vol. 310, No. 1, June 2007, pp. 18-26. [32] M. A. El Mhammedi, M. Achak, M. Bakasse and A. Chtaini, “Physico-Chemical Characterization of Electrochemical Deposit of Ca10(PO4)6(OH)2 on Copper Surfaces,” Ap- plied Surface Science, Vol. 253, No. 14, May 2007, pp. 5925-5930. [33] Hydroxyapatite [Ca5(PO4)3(OH)] Joint Committee on Powder Diffraction Standards, Card No. 09-432. [34] T. Tsurus and S. Haruyama, “Corrosion Monitor Based on Impedance Method. II. Construction and Its Application to Homogeneous Corrosion,” Journal of Japan Society of Corrosion Engineering. Vol. 27, 1978, pp. 573-579. [35] L. Wu, W. Forsling and P. W. Schindler, “Surface Com- plexation of Calcium Minerals in Aqueous Solution: 1. Surface Protonation at Fluorapatite—Water Interfaces,” Journal of Colloid and Interface Science, Vol. 147, No. 1, November 1991, pp. 178-185. [36] M. Jarlbring, D. E. Sandstrom, O. N. Abtzukin and W. Forsling, “Characterization of Active Phosphorus Surface Sites at Synthetic Carbonate-Free Fluorapatite Using Sin- gle-Pulse 1H, 31P, and 31P CP MAS NMR,” Langmuir, Vol. 22, No. 10, May 2006, pp. 4787-4792. [37] E. Sandstrom, M. Jarlbring, O. N. Abtzukin and W. Fors- ling, “A Spectroscopic Study of Calcium Surface Sites and Adsorbed Iron Species at Aqueous Fluorapatite by Means of 1H and 31P MAS NMR,” Langmuir, Vol. 22, No. 26, December 2006, pp. 11060-11064. [38] I. D. Smiciklas, S. K. Milonjic, P. Pfendt and S. Raicevic, “The Point of Zero Charge and Sorption of Cadmium (II) and Strontium (II) Ions on Synthetic Hydroxyapatite,” Separation and Purification Technology, Vol. 18, No. 3, May 2000, pp. 185-194. [39] Y. Takeuchi, T. Suzuki and H. Arai, “A Study of Equilib- rium and Mass Transfer in Processes for Removal of Heavy-Metal Ions by Hydroxyapatite,” Journal of Chemi- cal Engineering of Japan, Vol. 21, No. 1, February 1988, pp. 98-100. [40] J. Jeanjean, S. McGrellis and J. C. Rouchaud, “A Crys- tallographic Study of the Sorption of Cadmium on Cal- cium Hydroxyapatites: Incidence of Cationic Vacancies,” Academic Press Inc., Cambridge, Vol. 126, November 1996, pp. 195-201. [41] B. O. Fowler, “Infrared Studies of Apatites. I. Vibrational Assignments for Calcium, Strontium, and. Barium Hy- droxyapatites Utilizing Isotopic Substitution,” Inorganic Chemistry, Vol. 13, No. 1, January 1974, pp. 194-207. [42] C. Hu, K. Wu, X. Dai and S. Hu, “Simultaneous Deter- mination of Lead(II) and Cadmium(II) at a Diacetyl- dioxime Modified Carbon Paste Electrode by Differential Pulse Stripping Voltammetry,” Talanta, Vol. 60, No. 1, May 2003, pp. 17-24. [43] C. Kokkinos, A. Economou, I. Raptis and C. E. Efstathiou, “Lithographically Fabricated Disposable Bismuth-Film Electrodes for the Trace Determination of Pb(II) and Cd(II) by Anodic Stripping Voltammetry,” Electrochimica Acta, Vol. 53, No. 16, June 2008, pp. 5294-5299. [44] X. Chen, J. V. Wright, J. L. Conca and L. M. Peurrung, “Effects of pH on Heavy Metal Sorption on Mineral Apatite,” Environmental Science & Technology, Vol. 31, No. 3, February 1997, pp. 624-631. Copyright © 2010 SciRes. AJAC |