Paper Menu >>
Journal Menu >>
 American Journal of Anal yt ical Chemistry, 2010, 1, 135-143 doi:10.4236/ajac.2010.13017 Published Online November 2010 (http://www.SciRP.org/journal/ajac) Copyright © 2010 SciRes. AJAC Rapid and Sensitive Carvedilol Assay in Human Plasma Using a High-Performance Liquid Chromatography with Mass/Mass Spectrometer Detection Employed for a Bioequivalence Study Soo-Hwan Kim, Sang Hun Lee, Hye Jung Lee* Hopkins Bio Research Center, Inc., Seoul, South Korea E-mail: hjlee@hopkins.co.kr Received July 15, 2010; revised October 25, 2010; accepted November 5, 2010 Abstract A method for the determination of carvedilol in human plasma was developed using a high-performance liq- uid chromatography with tandem mass spectrometer (HPLC-MS/MS). Plasma samples were deproteinized using acetonitrile and the supernatant was directly injected onto the HPLC column without any preparative steps. Chromatography was performed on a reversed-phase (C18) column with isocratic mobile phase for 2 min. The calibration curve was linear over the range of 2 to100 ng/ml (R2 > 0.9998) and the lower limit of quantitation (LLOQ) was 2 ng/ml. This method showed acceptable precision and accuracy, good recovery from the plasma matrix, and stability during the analytical procedures. When its application to the bio- equivalence test of two carvedilol 25 mg tablet formulations in male healthy 28 volunteers, this validated analysis method was appropriate resulting in the bioequivalence of two formulations: no statistically signifi- cant difference was observed between the logarithmic transformed area under curve (AUC) and maximum plasma concentration (Cmax) values of the two formulations. The 90% confidence interval for the ratio of the above mentioned two parameters were within the bioequivalence limit of 0.80-1.25. These results suggested that the HPLC-MS/MS analysis method developed was suitable for the carvedilol analysis in human plasma. Keywords: Carvedilol, Bioequivalence, HPLC-MS/MS, Validation 1. Introduction Carvedilol, (±)-1-carbazol-4-yloxy-3-{[2-(O-methoxy-phe- noxy)ethyl]amino}-2-propanol (Scheme 1(a)), is a non- selective lipophilic β1- and β2- adrenoreceptor antagonist with antioxidant and antiproliferative effects. It has vasodilating properties that are attributed mainly to its blocking activity at α1- receptors [1-4]. Carvedilol is used in the treatment of mild to moderate hypertension and angina pectoris [5] and is often used in combination with other drugs [6]. Carvedilol has been quantified in biological fluids us- ing high-performance liquid chromatography (HPLC) with fluorescence [1-2,6-11] or electrochemical detector [12], mass spectrometry [13-15], hydrophilic interaction liquid chromatography (HILIC) with tandem mass spec- trometry [16], capillary electrophoresis-ultra violet de- tector [17] and gas chromatography (GC)-MS detector [18]. The clean-up procedures for the extraction of carvedilol from biological matrix has been carried out by protein precipitation [8-9,13,15], solid-phase extraction (SPE) [2,6,12], liquid-liquid extraction (LLE) [10,14,18], combinations of protein precipitation with SPE [7] or combinations of LLE with back-extraction [1,11]. How- ever, these methods used a large volume of biological fluids (0.15-1.0 ml plasma or 2-5 ml urine), time-con- suming pre-treat procedures for LLE, SPE or derivatiza- tion steps and required a long run-time (20 min) to obtain high sensitivity. Besides, these methods employed a large injection volume (20-100 μl) or low pH buffers (pH 2-2.5), which affect system stability. In addition, low pH causes degradation of carvedilol [15]. We developed a rapid, simple and specific method for quantitative analysis of carvedilol in human plasma em- ploying HPLC-MS/MS with protein precipitation proce- dure. This validated analysis method was applied to as- 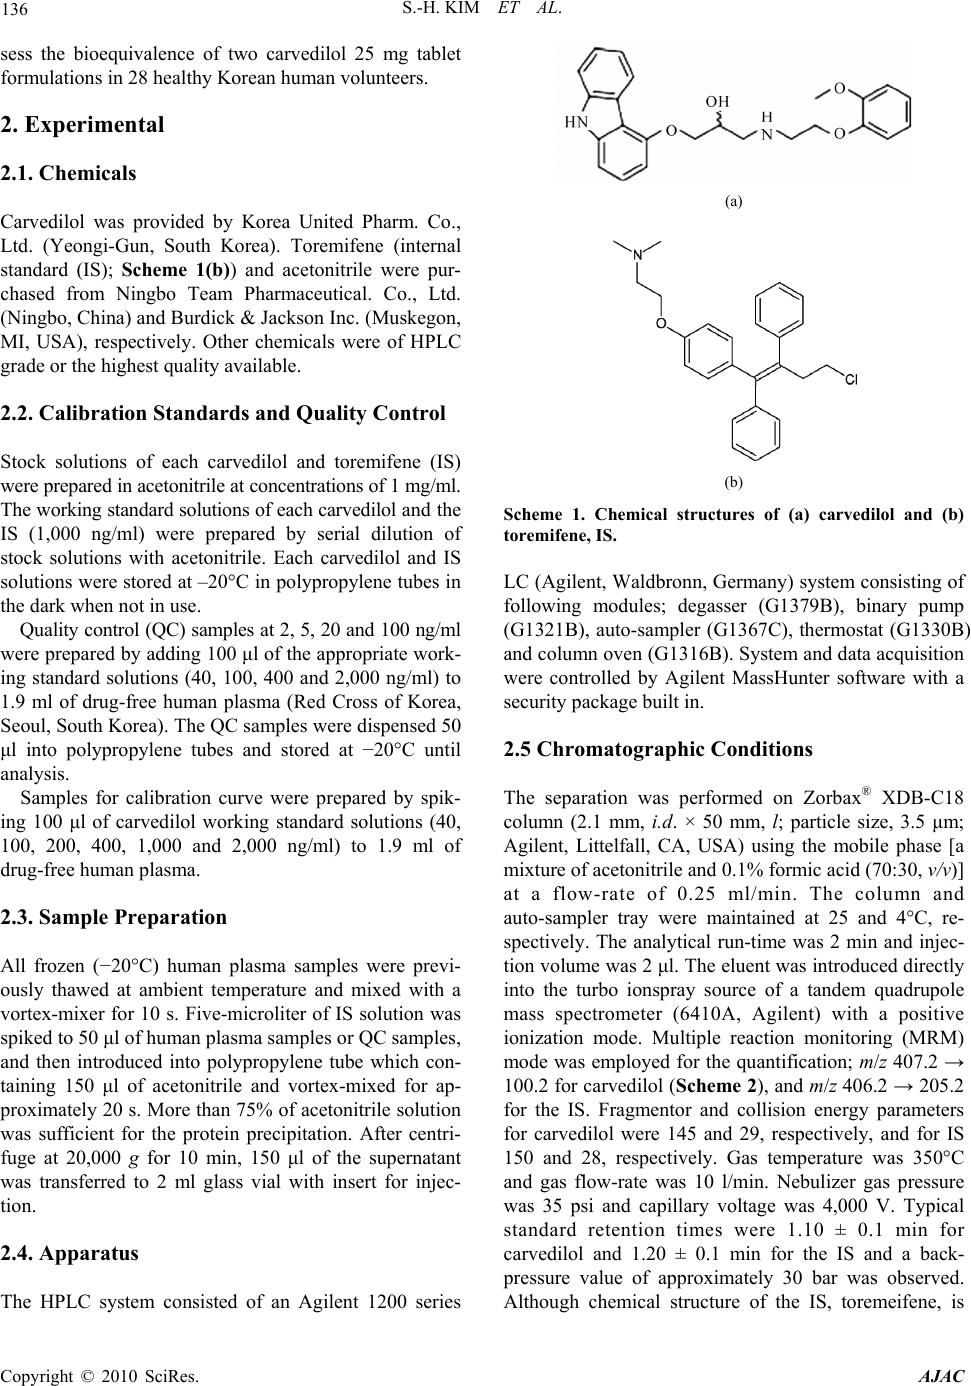 136 S.-H. KIM ET AL. sess the bioequivalence of two carvedilol 25 mg tablet formulations in 28 healthy Korean human volunteers. 2. Experimental 2.1. Chemicals Carvedilol was provided by Korea United Pharm. Co., Ltd. (Yeongi-Gun, South Korea). Toremifene (internal standard (IS); Scheme 1(b)) and acetonitrile were pur- chased from Ningbo Team Pharmaceutical. Co., Ltd. (Ningbo, China) and Burdick & Jackson Inc. (Muskegon, MI, USA), respectively. Other chemicals were of HPLC grade or the highest quality available. 2.2. Calibration Standards and Quality Control Stock solutions of each carvedilol and toremifene (IS) were prepared in acetonitrile at concentrations of 1 mg/ml. The working standard solutions of each carvedilol and the IS (1,000 ng/ml) were prepared by serial dilution of stock solutions with acetonitrile. Each carvedilol and IS solutions were stored at –20°C in polypropylene tubes in the dark when not in use. Quality control (QC) samples at 2, 5, 20 and 100 ng/ml were prepared by adding 100 μl of the appropriate work- ing standard solutions (40, 100, 400 and 2,000 ng/ml) to 1.9 ml of drug-free human plasma (Red Cross of Korea, Seoul, South Korea). The QC samples were dispensed 50 μl into polypropylene tubes and stored at −20°C until analysis. Samples for calibration curve were prepared by spik- ing 100 μl of carvedilol working standard solutions (40, 100, 200, 400, 1,000 and 2,000 ng/ml) to 1.9 ml of drug-free human plasma. 2.3. Sample Preparation All frozen (−20°C) human plasma samples were previ- ously thawed at ambient temperature and mixed with a vortex-mixer for 10 s. Five-microliter of IS solution was spiked to 50 μl of human plasma samples or QC samples, and then introduced into polypropylene tube which con- taining 150 μl of acetonitrile and vortex-mixed for ap- proximately 20 s. More than 75% of acetonitrile solution was sufficient for the protein precipitation. After centri- fuge at 20,000 g for 10 min, 150 μl of the supernatant was transferred to 2 ml glass vial with insert for injec- tion. 2.4. Apparatus The HPLC system consisted of an Agilent 1200 series (a) (b) Scheme 1. Chemical structures of (a) carvedilol and (b) toremifene, IS. LC (Agilent, Waldbronn, Germany) system consisting of following modules; degasser (G1379B), binary pump (G1321B), auto-sampler (G1367C), thermostat (G1330B) and column oven (G1316B). System and data acquisition were controlled by Agilent MassHunter software with a security package built in. 2.5 Chromatographic Conditions The separation was performed on Zorbax® XDB-C18 column (2.1 mm, i.d. × 50 mm, l; particle size, 3.5 μm; Agilent, Littelfall, CA, USA) using the mobile phase [a mixture of acetonitrile and 0.1% formic acid (70:30, v/v)] at a flow-rate of 0.25 ml/min. The column and auto-sampler tray were maintained at 25 and 4°C, re- spectively. The analytical run-time was 2 min and injec- tion volume was 2 μl. The eluent was introduced directly into the turbo ionspray source of a tandem quadrupole mass spectrometer (6410A, Agilent) with a positive ionization mode. Multiple reaction monitoring (MRM) mode was employed for the quantification; m/z 407.2 → 100.2 for carvedilol (Scheme 2), and m/z 406.2 → 205.2 for the IS. Fragmentor and collision energy parameters for carvedilol were 145 and 29, respectively, and for IS 150 and 28, respectively. Gas temperature was 350°C and gas flow-rate was 10 l/min. Nebulizer gas pressure was 35 psi and capillary voltage was 4,000 V. Typical standard retention times were 1.10 ± 0.1 min for carvedilol and 1.20 ± 0.1 min for the IS and a back- pressure value of approximately 30 bar was observed. Although chemical structure of the IS, toremeifene, is Copyright © 2010 SciRes. AJAC 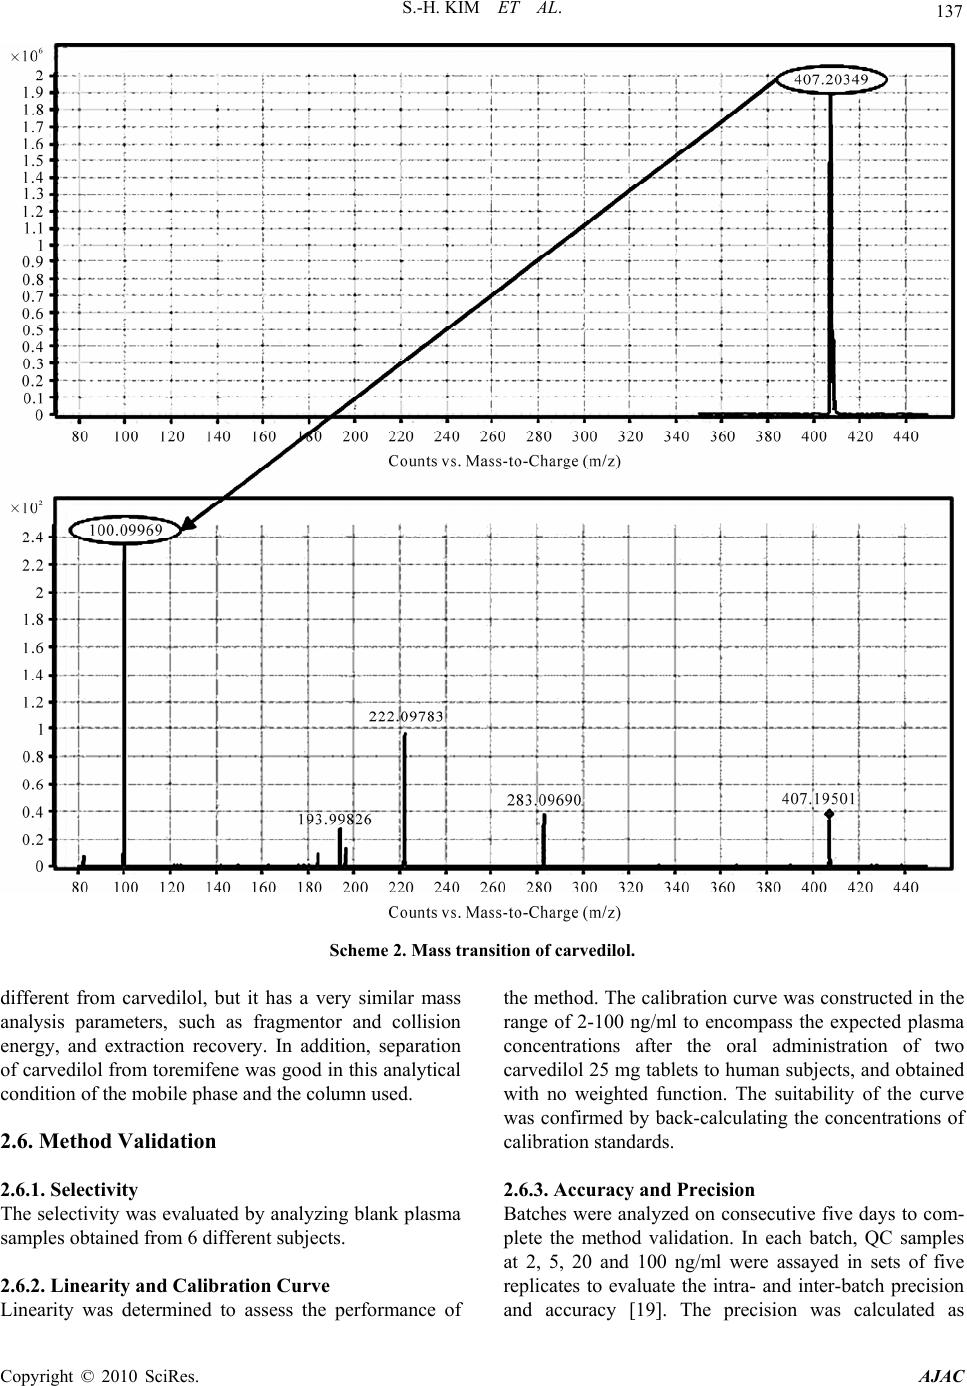 S.-H. KIM ET AL. Copyright © 2010 SciRes. AJAC 137 Scheme 2. Mass transition of carvedilol. different from carvedilol, but it has a very similar mass analysis parameters, such as fragmentor and collision energy, and extraction recovery. In addition, separation of carvedilol from toremifene was good in this analytical condition of the mobile phase and the column used. 2.6. Method Validation 2.6.1. Selectivity The selectivity was evaluated by analyzing blank plasma samples obtained from 6 different subjects. 2.6.2. Linearity and Calibration Curve Linearity was determined to assess the performance of the method. The calibration curve was constructed in the range of 2-100 ng/ml to encompass the expected plasma concentrations after the oral administration of two carvedilol 25 mg tablets to human subjects, and obtained with no weighted function. The suitability of the curve was confirmed by back-calculating the concentrations of calibration standards. 2.6.3. Accuracy and Precision Batches were analyzed on consecutive five days to com- plete the method validation. In each batch, QC samples at 2, 5, 20 and 100 ng/ml were assayed in sets of five replicates to evaluate the intra- and inter-batch precision and accuracy [19]. The precision was calculated as 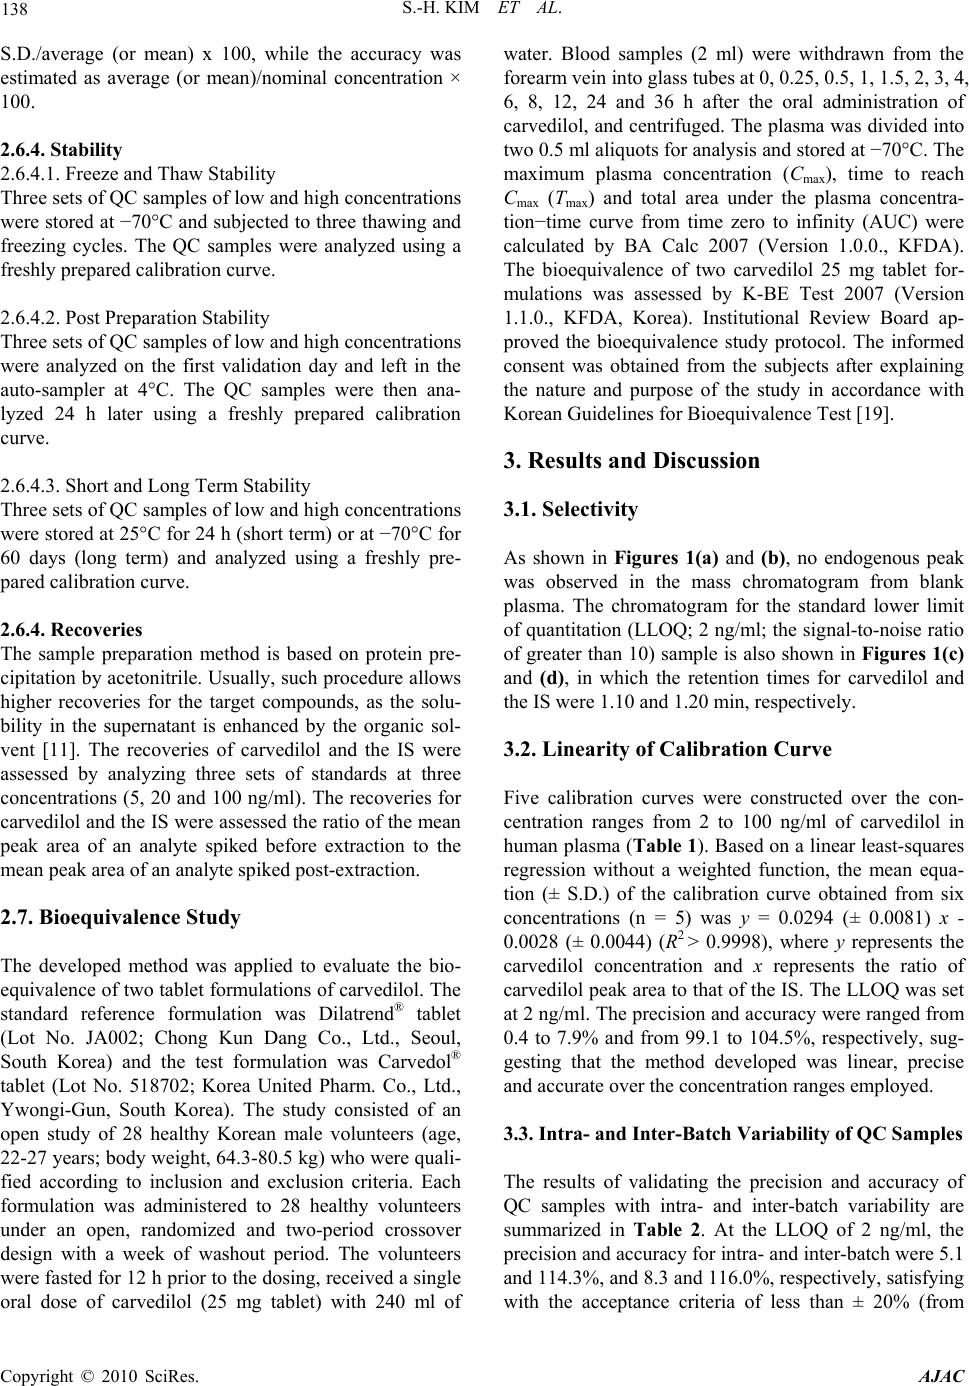 138 S.-H. KIM ET AL. S.D./average (or mean) x 100, while the accuracy was estimated as average (or mean)/nominal concentration × 100. 2.6.4. Stability 2.6.4.1. Freeze and Thaw Stability Three sets of QC samples of low and high concentrations were stored at −70°C and subjected to three thawing and freezing cycles. The QC samples were analyzed using a freshly prepared calibration curve. 2.6.4.2. Post Preparation Stability Three sets of QC samples of low and high concentrations were analyzed on the first validation day and left in the auto-sampler at 4°C. The QC samples were then ana- lyzed 24 h later using a freshly prepared calibration curve. 2.6.4.3. Short and Long Term Stability Three sets of QC samples of low and high concentrations were stored at 25°C for 24 h (short term) or at −70°C for 60 days (long term) and analyzed using a freshly pre- pared calibration curve. 2.6.4. Recoveries The sample preparation method is based on protein pre- cipitation by acetonitrile. Usually, such procedure allows higher recoveries for the target compounds, as the solu- bility in the supernatant is enhanced by the organic sol- vent [11]. The recoveries of carvedilol and the IS were assessed by analyzing three sets of standards at three concentrations (5, 20 and 100 ng/ml). The recoveries for carvedilol and the IS were assessed the ratio of the mean peak area of an analyte spiked before extraction to the mean peak area of an analyte spiked post-extraction. 2.7. Bioequivalence Study The developed method was applied to evaluate the bio- equivalence of two tablet formulations of carvedilol. The standard reference formulation was Dilatrend® tablet (Lot No. JA002; Chong Kun Dang Co., Ltd., Seoul, South Korea) and the test formulation was Carvedol® tablet (Lot No. 518702; Korea United Pharm. Co., Ltd., Ywongi-Gun, South Korea). The study consisted of an open study of 28 healthy Korean male volunteers (age, 22-27 years; body weight, 64.3-80.5 kg) who were quali- fied according to inclusion and exclusion criteria. Each formulation was administered to 28 healthy volunteers under an open, randomized and two-period crossover design with a week of washout period. The volunteers were fasted for 12 h prior to the dosing, received a single oral dose of carvedilol (25 mg tablet) with 240 ml of water. Blood samples (2 ml) were withdrawn from the forearm vein into glass tubes at 0, 0.25, 0.5, 1, 1.5, 2, 3, 4, 6, 8, 12, 24 and 36 h after the oral administration of carvedilol, and centrifuged. The plasma was divided into two 0.5 ml aliquots for analysis and stored at −70°C. The maximum plasma concentration (Cmax), time to reach Cmax (Tmax) and total area under the plasma concentra- tion−time curve from time zero to infinity (AUC) were calculated by BA Calc 2007 (Version 1.0.0., KFDA). The bioequivalence of two carvedilol 25 mg tablet for- mulations was assessed by K-BE Test 2007 (Version 1.1.0., KFDA, Korea). Institutional Review Board ap- proved the bioequivalence study protocol. The informed consent was obtained from the subjects after explaining the nature and purpose of the study in accordance with Korean Guidelines for Bioequivalence Test [19]. 3. Results and Discussion 3.1. Selectivity As shown in Figures 1(a) and (b), no endogenous peak was observed in the mass chromatogram from blank plasma. The chromatogram for the standard lower limit of quantitation (LLOQ; 2 ng/ml; the signal-to-noise ratio of greater than 10) sample is also shown in Figures 1(c) and (d), in which the retention times for carvedilol and the IS were 1.10 and 1.20 min, respectively. 3.2. Linearity of Calibration Curve Five calibration curves were constructed over the con- centration ranges from 2 to 100 ng/ml of carvedilol in human plasma (Table 1). Based on a linear least-squares regression without a weighted function, the mean equa- tion (± S.D.) of the calibration curve obtained from six concentrations (n = 5) was y = 0.0294 (± 0.0081) x - 0.0028 (± 0.0044) (R2 > 0.9998), where y represents the carvedilol concentration and x represents the ratio of carvedilol peak area to that of the IS. The LLOQ was set at 2 ng/ml. The precision and accuracy were ranged from 0.4 to 7.9% and from 99.1 to 104.5%, respectively, sug- gesting that the method developed was linear, precise and accurate over the concentration ranges employed. 3.3. Intra- and Inter-Batch Variability of QC Samples The results of validating the precision and accuracy of QC samples with intra- and inter-batch variability are summarized in Table 2. At the LLOQ of 2 ng/ml, the precision and accuracy for intra- and inter-batch were 5.1 and 114.3%, and 8.3 and 116.0%, respectively, satisfying ith the acceptance criteria of less than ± 20% (from w Copyright © 2010 SciRes. AJAC 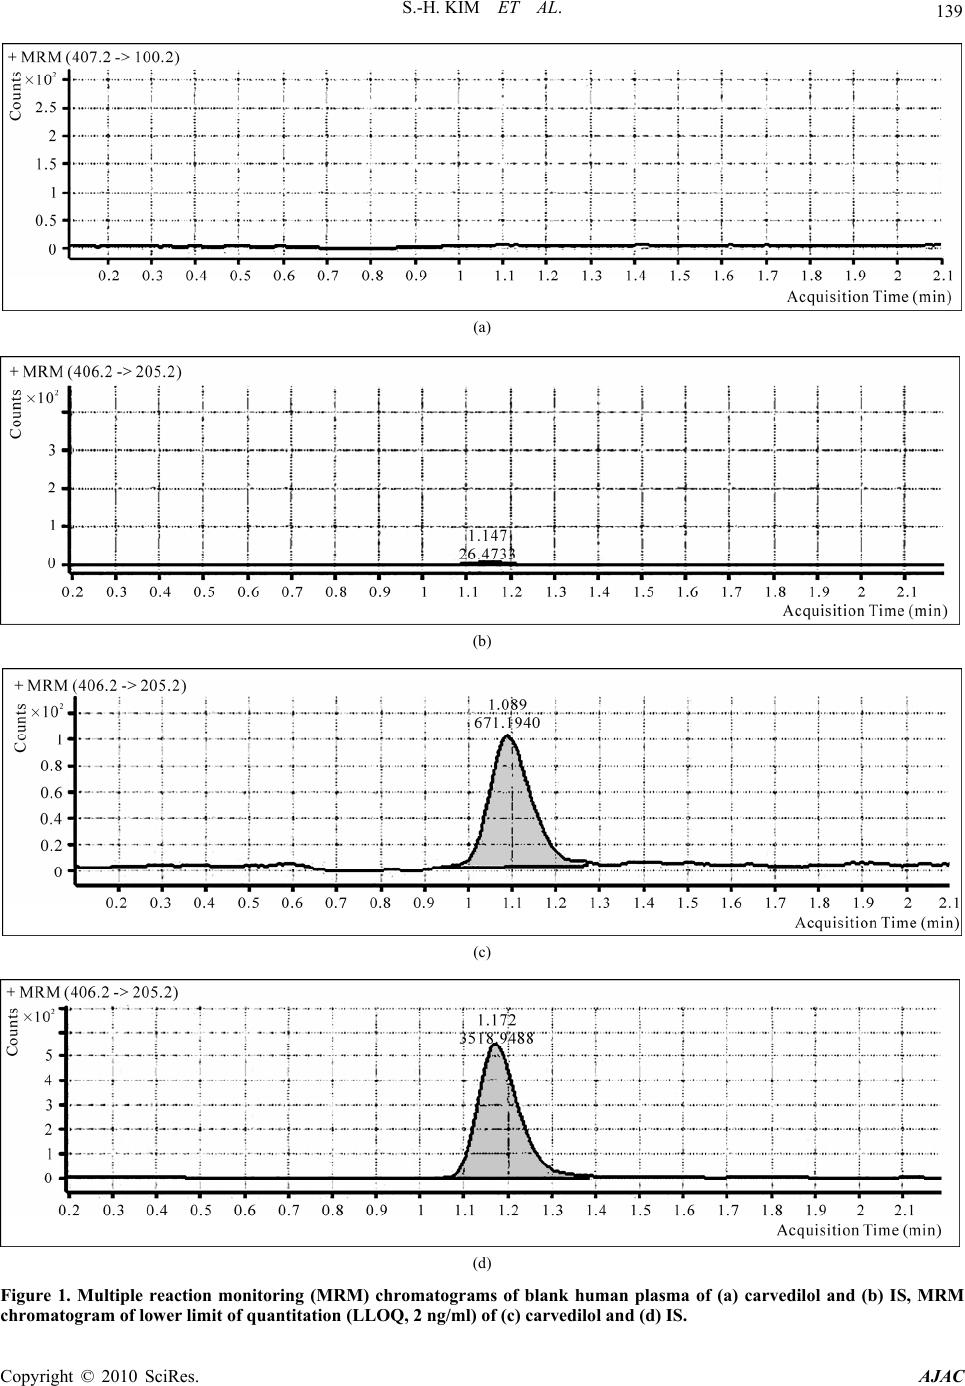 S.-H. KIM ET AL. Copyright © 2010 SciRes. AJAC 139 (a) (b) (c) (d) Figure 1. Multiple reaction monitoring (MRM) chromatograms of blank human plasma of (a) carvedilol and (b) IS, MRM chromatogram of lower limit of quantitation (LLOQ, 2 ng/ml) of (c) carvedilol and (d) IS. 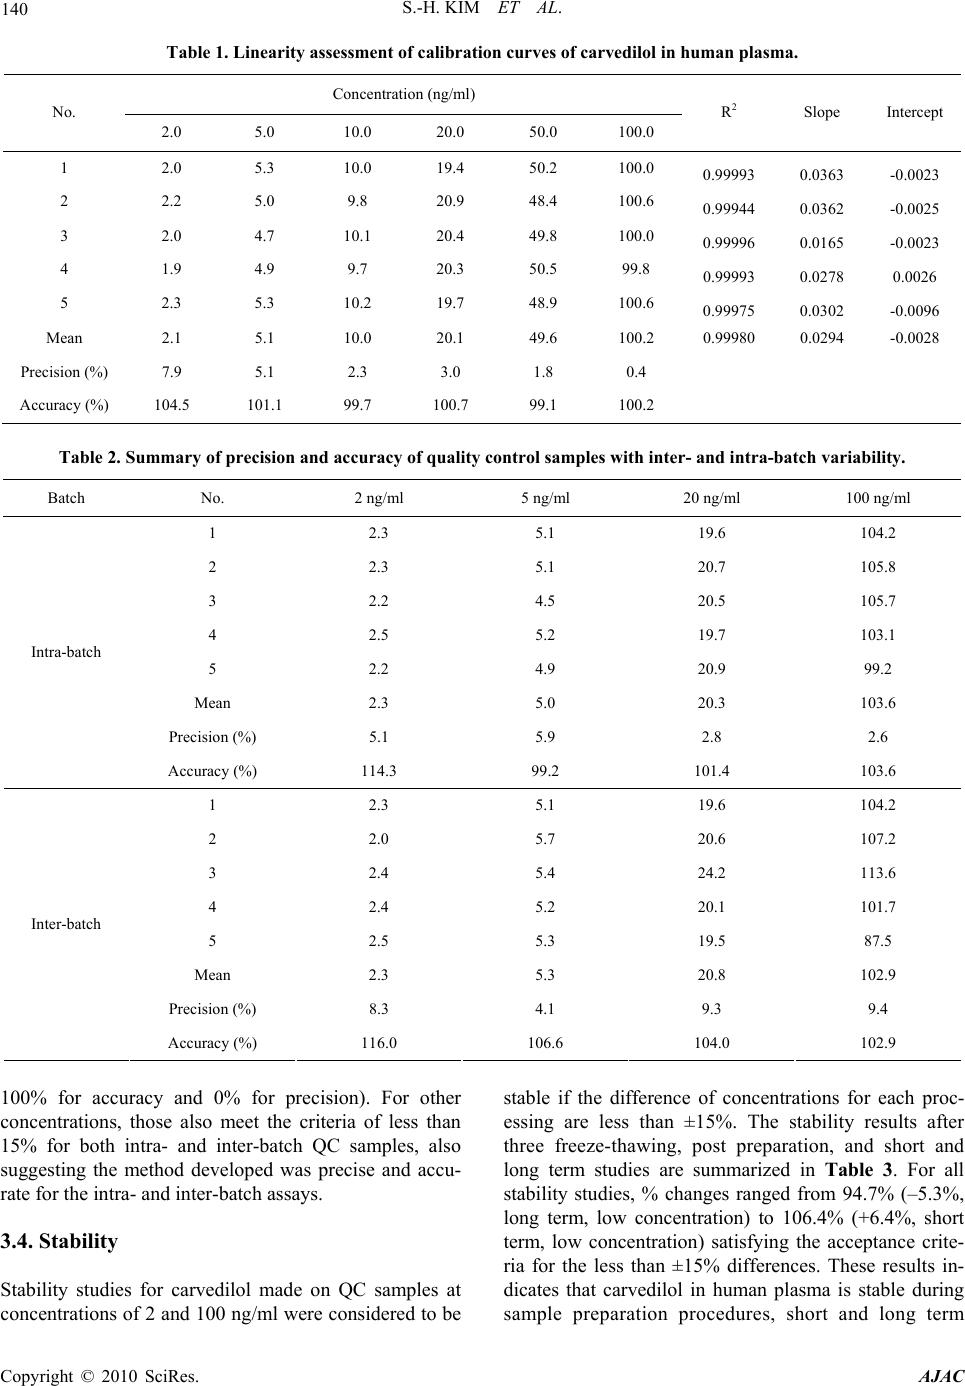 140 S.-H. KIM ET AL. Table 1. Linearity assessment of calibration curves of carvedilol in human plasma. Concentration (ng/ml) No. 2.0 5.0 10.0 20.0 50.0 100.0 R2 Slope Intercept 1 2.0 5.3 10.0 19.4 50.2 100.0 0.99993 0.0363 -0.0023 2 2.2 5.0 9.8 20.9 48.4 100.6 0.99944 0.0362 -0.0025 3 2.0 4.7 10.1 20.4 49.8 100.0 0.99996 0.0165 -0.0023 4 1.9 4.9 9.7 20.3 50.5 99.8 0.99993 0.0278 0.0026 5 2.3 5.3 10.2 19.7 48.9 100.6 0.99975 0.0302 -0.0096 Mean 2.1 5.1 10.0 20.1 49.6 100.2 0.99980 0.0294 -0.0028 Precision (%) 7.9 5.1 2.3 3.0 1.8 0.4 Accuracy (%) 104.5 101.1 99.7 100.7 99.1 100.2 Table 2. Summary of precision and accuracy of quality control samples with inter- and intra-batch variability. Batch No. 2 ng/ml 5 ng/ml 20 ng/ml 100 ng/ml 1 2.3 5.1 19.6 104.2 2 2.3 5.1 20.7 105.8 3 2.2 4.5 20.5 105.7 4 2.5 5.2 19.7 103.1 5 2.2 4.9 20.9 99.2 Mean 2.3 5.0 20.3 103.6 Precision (%) 5.1 5.9 2.8 2.6 Intra-batch Accuracy (%) 114.3 99.2 101.4 103.6 1 2.3 5.1 19.6 104.2 2 2.0 5.7 20.6 107.2 3 2.4 5.4 24.2 113.6 4 2.4 5.2 20.1 101.7 5 2.5 5.3 19.5 87.5 Mean 2.3 5.3 20.8 102.9 Precision (%) 8.3 4.1 9.3 9.4 Inter-batch Accuracy (%) 116.0 106.6 104.0 102.9 100% for accuracy and 0% for precision). For other concentrations, those also meet the criteria of less than 15% for both intra- and inter-batch QC samples, also suggesting the method developed was precise and accu- rate for the intra- and inter-batch assays. 3.4. Stability Stability studies for carvedilol made on QC samples at concentrations of 2 and 100 ng/ml were considered to be stable if the difference of concentrations for each proc- essing are less than ±15%. The stability results after three freeze-thawing, post preparation, and short and long term studies are summarized in Table 3. For all stability studies, % changes ranged from 94.7% (–5.3%, long term, low concentration) to 106.4% (+6.4%, short term, low concentration) satisfying the acceptance crite- ria for the less than ±15% differences. These results in- dicates that carvedilol in human plasma is stable during sample preparation procedures, short and long term Copyright © 2010 SciRes. AJAC 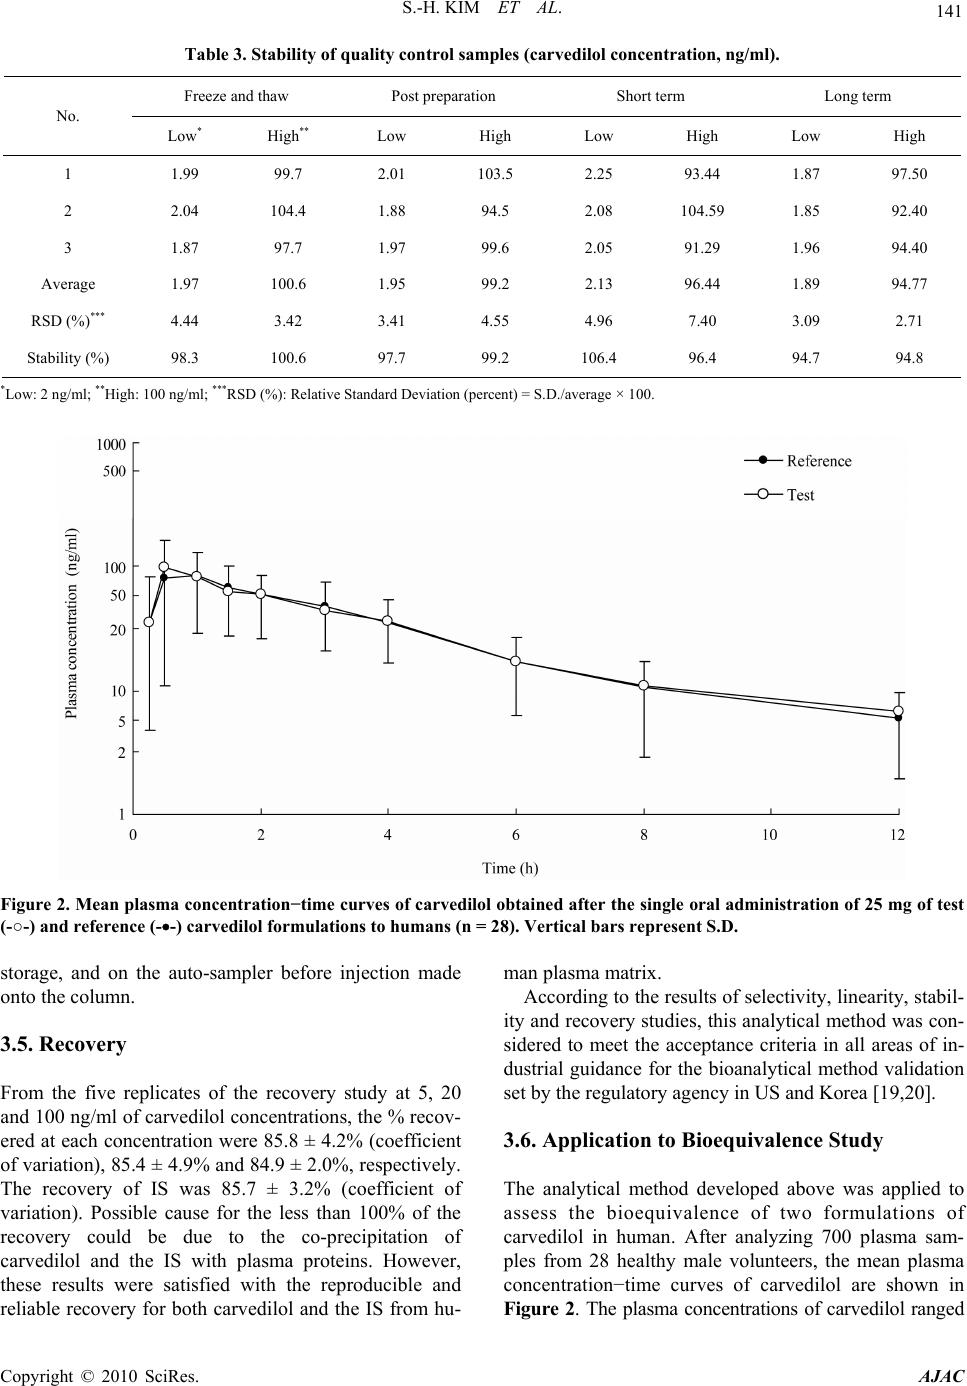 S.-H. KIM ET AL. 141 Table 3. Stability of quality control samples (carvedilol concentration, ng/ml). Freeze and thaw Post preparation Short term Long term No. Low* High** Low High Low High Low High 1 1.99 99.7 2.01 103.5 2.25 93.44 1.87 97.50 2 2.04 104.4 1.88 94.5 2.08 104.59 1.85 92.40 3 1.87 97.7 1.97 99.6 2.05 91.29 1.96 94.40 Average 1.97 100.6 1.95 99.2 2.13 96.44 1.89 94.77 RSD (%)*** 4.44 3.42 3.41 4.55 4.96 7.40 3.09 2.71 Stability (%) 98.3 100.6 97.7 99.2 106.4 96.4 94.7 94.8 *Low: 2 ng/ml; **High: 100 ng/ml; ***RSD (%): Relative Standard Deviation (percent) = S.D./average × 100. Figure 2. Mean plasma concentration−time curves of carvedilol obtained after the single oral administration of 25 mg of test (-○-) and reference (--) carvedilol formulations to humans (n = 28). Vertical bars represent S.D. storage, and on the auto-sampler before injection made onto the column. 3.5. Recovery From the five replicates of the recovery study at 5, 20 and 100 ng/ml of carvedilol concentrations, the % recov- ered at each concentration were 85.8 ± 4.2% (coefficient of variation), 85.4 ± 4.9% and 84.9 ± 2.0%, respectively. The recovery of IS was 85.7 ± 3.2% (coefficient of variation). Possible cause for the less than 100% of the recovery could be due to the co-precipitation of carvedilol and the IS with plasma proteins. However, these results were satisfied with the reproducible and reliable recovery for both carvedilol and the IS from hu- man plasma matrix. According to the results of selectivity, linearity, stabil- ity and recovery studies, this analytical method was con- sidered to meet the acceptance criteria in all areas of in- dustrial guidance for the bioanalytical method validation set by the regulatory agency in US and Korea [19,20]. 3.6. Application to Bioequivalence Study The analytical method developed above was applied to assess the bioequivalence of two formulations of carvedilol in human. After analyzing 700 plasma sam- ples from 28 healthy male volunteers, the mean plasma concen tr a t ion−time curves of carvedilol are shown in Figure 2. The plasma concentrations of carvedilol ranged Copyright © 2010 SciRes. AJAC 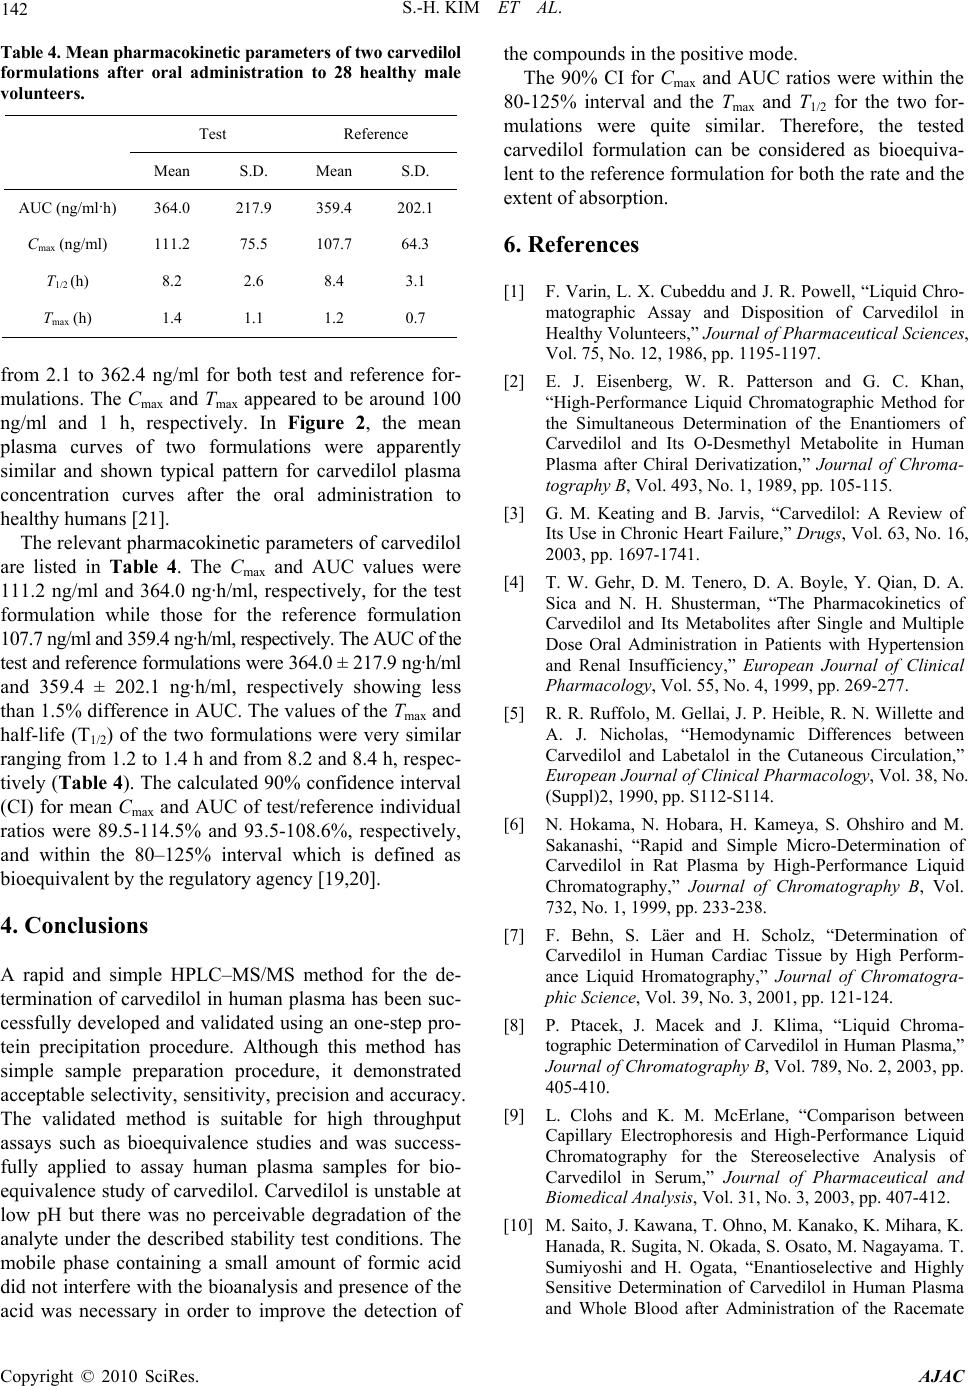 142 S.-H. KIM ET AL. Table 4. Mean pharmacokinetic parameters of two carvedilol formulations after oral administration to 28 healthy male volunteers. Test Reference Mean S.D. Mean S.D. AUC (ng/ml·h) 364.0 217.9 359.4 202.1 Cmax (ng/ml) 111.2 75.5 107.7 64.3 T1/2 (h) 8.2 2.6 8.4 3.1 Tmax (h) 1.4 1.1 1.2 0.7 from 2.1 to 362.4 ng/ml for both test and reference for- mulations. The Cmax and Tmax appeared to be around 100 ng/ml and 1 h, respectively. In Figure 2, the mean plasma curves of two formulations were apparently similar and shown typical pattern for carvedilol plasma concentration curves after the oral administration to healthy humans [21]. The relevant pharmacokinetic parameters of carvedilol are listed in Table 4. The Cmax and AUC values were 111.2 ng/ml and 364.0 ng·h/ml, respectively, for the test formulation while those for the reference formulation 107.7 ng/ml and 359.4 ng·h/ml, respectively. The AUC of the test and reference formulations were 364.0 ± 217.9 ng·h/ml and 359.4 ± 202.1 ng·h/ml, respectively showing less than 1.5% difference in AUC. The values of the Tmax and half-life (T1/2) of the two formulations were very similar ranging from 1.2 to 1.4 h and from 8.2 and 8.4 h, respec- tively (Table 4). The calculated 90% confidence interval (CI) for mean Cmax and AUC of test/reference individual ratios were 89.5-114.5% and 93.5-108.6%, respectively, and within the 80–125% interval which is defined as bioequivalent by the regulatory agency [19,20]. 4. Conclusions A rapid and simple HPLC–MS/MS method for the de- termination of carvedilol in human plasma has been suc- cessfully developed and validated using an one-step pro- tein precipitation procedure. Although this method has simple sample preparation procedure, it demonstrated acceptable selectivity, sensitivity, precision and accuracy. The validated method is suitable for high throughput assays such as bioequivalence studies and was success- fully applied to assay human plasma samples for bio- equivalence study of carvedilol. Carvedilol is unstable at low pH but there was no perceivable degradation of the analyte under the described stability test conditions. The mobile phase containing a small amount of formic acid did not interfere with the bioanalysis and presence of the acid was necessary in order to improve the detection of the compounds in the positive mode. The 90% CI for Cmax and AUC ratios were within the 80-125% interval and the Tmax and T1/2 for the two for- mulations were quite similar. Therefore, the tested carvedilol formulation can be considered as bioequiva- lent to the reference formulation for both the rate and the extent of absorption. 6. References [1] F. Varin, L. X. Cubeddu and J. R. Powell, “Liquid Chro- matographic Assay and Disposition of Carvedilol in Healthy Volunteers,” Journal of Pharmaceutical Sciences, Vol. 75, No. 12, 1986, pp. 1195-1197. [2] E. J. Eisenberg, W. R. Patterson and G. C. Khan, “High-Performance Liquid Chromatographic Method for the Simultaneous Determination of the Enantiomers of Carvedilol and Its O-Desmethyl Metabolite in Human Plasma after Chiral Derivatization,” Journal of Chroma- tography B, Vol. 493, No. 1, 1989, pp. 105-115. [3] G. M. Keating and B. Jarvis, “Carvedilol: A Review of Its Use in Chronic Heart Failure,” Drugs, Vol. 63, No. 16, 2003, pp. 1697-1741. [4] T. W. Gehr, D. M. Tenero, D. A. Boyle, Y. Qian, D. A. Sica and N. H. Shusterman, “The Pharmacokinetics of Carvedilol and Its Metabolites after Single and Multiple Dose Oral Administration in Patients with Hypertension and Renal Insufficiency,” European Journal of Clinical Pharmacology, Vol. 55, No. 4, 1999, pp. 269-277. [5] R. R. Ruffolo, M. Gellai, J. P. Heible, R. N. Willette and A. J. Nicholas, “Hemodynamic Differences between Carvedilol and Labetalol in the Cutaneous Circulation,” European Journal of Clinical Pharmacology, Vol. 38, No. (Suppl)2, 1990, pp. S112-S114. [6] N. Hokama, N. Hobara, H. Kameya, S. Ohshiro and M. Sakanashi, “Rapid and Simple Micro-Determination of Carvedilol in Rat Plasma by High-Performance Liquid Chromatography,” Journal of Chromatography B, Vol. 732, No. 1, 1999, pp. 233-238. [7] F. Behn, S. Läer and H. Scholz, “Determination of Carvedilol in Human Cardiac Tissue by High Perform- ance Liquid Hromatography,” Journal of Chromatogra- phic Science, Vol. 39, No. 3, 2001, pp. 121-124. [8] P. Ptacek, J. Macek and J. Klima, “Liquid Chroma- tographic Determination of Carvedilol in Human Plasma,” Journal of Chromatography B, Vol. 789, No. 2, 2003, pp. 405-410. [9] L. Clohs and K. M. McErlane, “Comparison between Capillary Electrophoresis and High-Performance Liquid Chromatography for the Stereoselective Analysis of Carvedilol in Serum,” Journal of Pharmaceutical and Biomedical Analysis, Vol. 31, No. 3, 2003, pp. 407-412. [10] M. Saito, J. Kawana, T. Ohno, M. Kanako, K. Mihara, K. Hanada, R. Sugita, N. Okada, S. Osato, M. Nagayama. T. Sumiyoshi and H. Ogata, “Enantioselective and Highly Sensitive Determination of Carvedilol in Human Plasma and Whole Blood after Administration of the Racemate Copyright © 2010 SciRes. AJAC  S.-H. KIM ET AL. Copyright © 2010 SciRes. AJAC 143 Using Normal-Phase High-Performance Liquid Chroma- tography,” Journal of Chromatography B, Vol. 843, No. 1, 2006, pp. 73-77. [11] A. Medvedovici, F. Albu, C. Georgita, D. I. Sora, T. Galaon, S. Udrescu and V. David, “Achiral-Chiral LC/ LC-FLD Coupling for Determination of Carvedilol in Plasma Samples for Bioequivalence Purposes,” Journal of Chromatography B, Vol. 850, No. 1-2, 2007, pp. 327-335. [12] M. Machida, M. Watanabe, S. Takechi, S. Kakinoki and A. Nomura, “Measurement of Carvedilol in Plasma by High-Performance Liquid Chromatography with Elec- trochemical Detection,” Journal of Chromatography B, Vol. 798, No. 2, 2003, pp. 187-191. [13] M. Gergov, J. N. Robson, E. Duchoslav and I. Ojanperä, “Automated Liquid Chromatographic/Tandem Mass Spec- trometric Method for Screening β-Blocking Drugs in Urine,” Journal of Mass Spectrometry, Vol. 35, No. 7, 2000, pp. 912-918. [14] E. Yang, S. Wang, J. Kratz and M. J. Cyronak, “Stereo- selective Analysis Carvedilol in Human Plasma Using HPLC/MS/MS after Chiral Derivatization,” Journal of Pharmaceutical and Biomedical Analysis, Vol. 36, No. 3, 2004, pp. 609-615. [15] N. C. do C. Borges, G. D. Medes, D. O. Silva, V. M. Rezende, R. E. Barrientos-Astigarraga and G. D. Nucci, “Quantification of Carvedilol in Human Plasma by High-Performance Liquid Chromatography Coupled to Electrospray Tandem Mass Spectrometry: Application to Bioequivalence Study,” Journal of Chromatography B, Vol. 822, No. 1-2, 2005, pp. 253-262. [16] D. W. Jeong, Y. H. Kim, H. Y. Ji, Y. S. Youn, K. C. Lee and H. S. Lee, “Analysis of Carvedilol in Human Plasma Using Hydrophilic Interaction Liquid Chromatography with Tandem Mass Spectrometry,” Journal of Pharma- ceutical and Biomedical Analysis, Vol. 44, No. 2, 2007, pp. 547-552. [17] L. Clohs and K. M. McEralne, “Development of a Capil- lary Electrophoresis Assay for the Determination of Carvedilol Enantiomers in Serum Using Cyclodextrins,” Journal of Pharmaceutical and Biomedical Analysis, Vol. 24, No. 4, 2001, pp. 545-554. [18] S. W. Myung and C. H. Jo, “Gas Chromatograph-Mass Spectrometric Method for the Determination of Carvedilol and Its Metabolites in Human,” Journal of Chromatog- raphy B, Vol. 822, No. 1-2, 2005, pp. 70-77. [19] Korea Food & Drug Administration, “Guidance Docu- ment for Bioequivalence Study,” 2008. http://betest.kfda. go.kr/country/country01.php?p=1 [20] DHHS-FDA, “Guidance for Industy-Bioanalytical Method Validation,” US Department of Health and Human Ser- vices, Food and Drug Administration, Center for Drug Evaluation and Research, Center for Veterinary Medicine, Rockville, May 2001. http://www.fda.gov/cder/guidance/ index.htm [21] D. Tenero, S. Boike, D. Boyle, B. Ilson, H. F. Fesniak, S. Brozena and D. Jorkasky, “Steady-State Pharmacokinet- ics of Carvedilol and Its Enantiomers in Patients with Congestive Heart Failure,” Journal of Clinical Pharma- cology, Vol. 40, No. 8, 2000, pp. 844-853. |