Paper Menu >>
Journal Menu >>
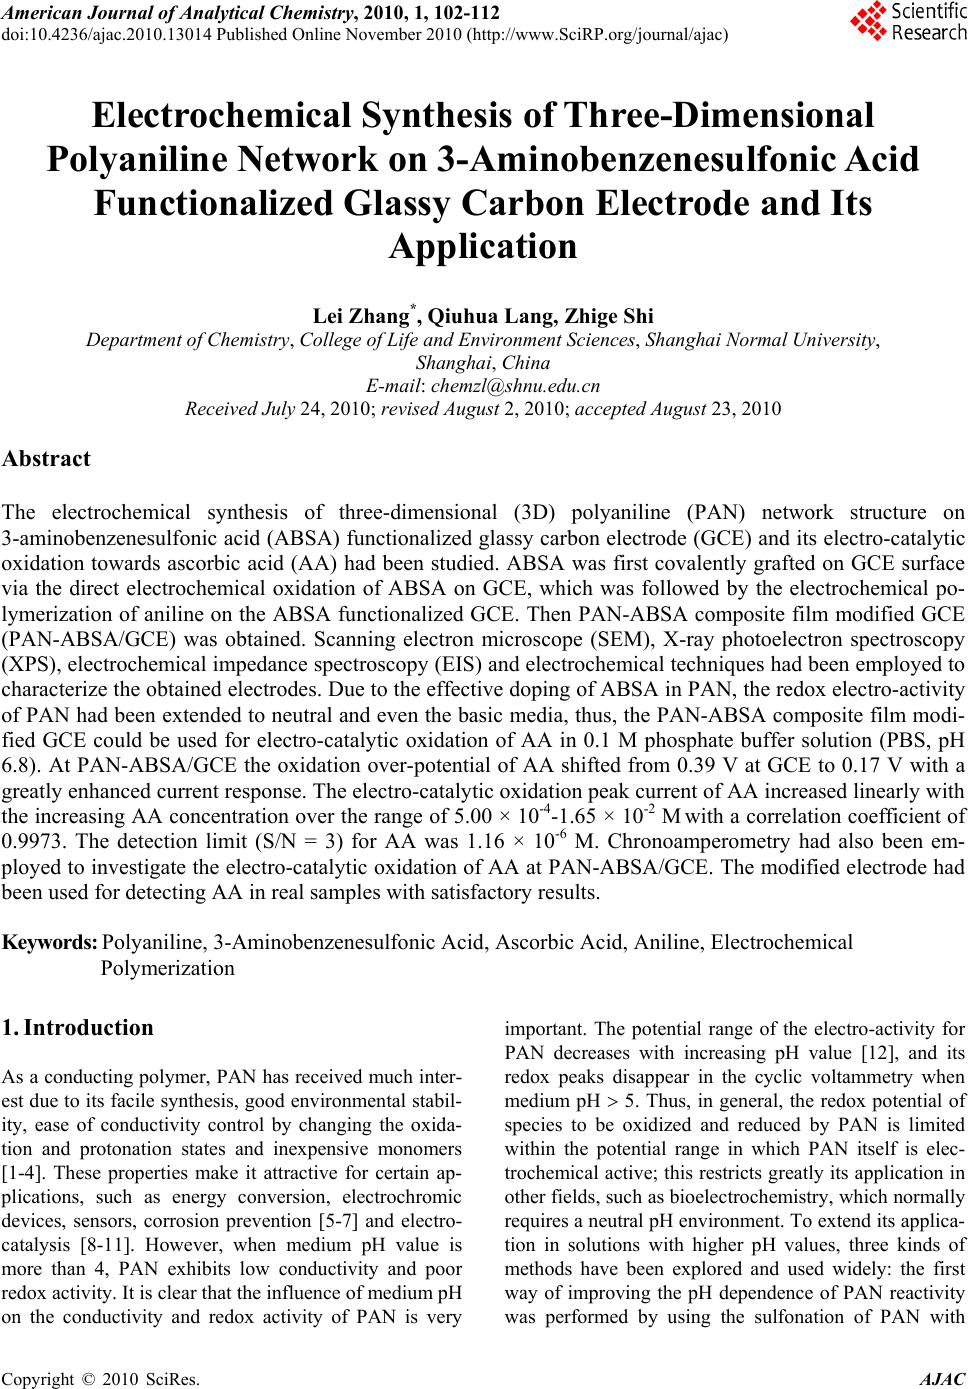 American Journal of Anal yt ical Chemistry, 2010, 1, 102-112 doi:10.4236/ajac.2010.13014 Published Online November 2010 (http://www.SciRP.org/journal/ajac) Copyright © 2010 SciRes. AJAC Electrochemical Synthesis of Three-Dimensional Polyaniline Network on 3-Aminobenzenesulfonic Acid Functionalized Glassy Carbon Electrode and Its Application Lei Zhang*, Qiuhua Lang, Zhige Shi Department of Chemistry, College of Life and Environment Sciences, Shanghai Normal University, Shanghai, China E-mail: chemzl@shnu.edu.cn Received July 24, 2010; revised August 2, 2010; accepted August 23, 2010 Abstract The electrochemical synthesis of three-dimensional (3D) polyaniline (PAN) network structure on 3-aminobenzenesulfonic acid (ABSA) functionalized glassy carbon electrode (GCE) and its electro-catalytic oxidation towards ascorbic acid (AA) had been studied. ABSA was first covalently grafted on GCE surface via the direct electrochemical oxidation of ABSA on GCE, which was followed by the electrochemical po- lymerization of aniline on the ABSA functionalized GCE. Then PAN-ABSA composite film modified GCE (PAN-ABSA/GCE) was obtained. Scanning electron microscope (SEM), X-ray photoelectron spectroscopy (XPS), electrochemical impedance spectroscopy (EIS) and electrochemical techniques had been employed to characterize the obtained electrodes. Due to the effective doping of ABSA in PAN, the redox electro-activity of PAN had been extended to neutral and even the basic media, thus, the PAN-ABSA composite film modi- fied GCE could be used for electro-catalytic oxidation of AA in 0.1 M phosphate buffer solution (PBS, pH 6.8). At PAN-ABSA/GCE the oxidation over-potential of AA shifted from 0.39 V at GCE to 0.17 V with a greatly enhanced current response. The electro-catalytic oxidation peak current of AA increased linearly with the increasing AA concentration over the range of 5.00 × 10⁻⁴-1.65 × 10⁻² M with a correlation coefficient of 0.9973. The detection limit (S/N = 3) for AA was 1.16 × 10⁻⁶ M. Chronoamperometry had also been em- ployed to investigate the electro-catalytic oxidation of AA at PAN-ABSA/GCE. The modified electrode had been used for detecting AA in real samples with satisfactory results. Keywords: Polyaniline, 3-Aminobenzenesulfonic Acid, Ascorbic Acid, Aniline, Electrochemical Polymerization 1. Introduction As a conducting polymer, PAN has received much inter- est due to its facile synthesis, good environmental stabil- ity, ease of conductivity control by changing the oxida- tion and protonation states and inexpensive monomers [1-4]. These properties make it attractive for certain ap- plications, such as energy conversion, electrochromic devices, sensors, corrosion prevention [5-7] and electro- catalysis [8-11]. However, when medium pH value is more than 4, PAN exhibits low conductivity and poor redox activity. It is clear that the influence of medium pH on the conductivity and redox activity of PAN is very important. The potential range of the electro-activity for PAN decreases with increasing pH value [12], and its redox peaks disappear in the cyclic voltammetry when medium pH 5. Thus, in general, the redox potential of species to be oxidized and reduced by PAN is limited within the potential range in which PAN itself is elec- trochemical active; this restricts greatly its application in other fields, such as bioelectrochemistry, which normally requires a neutral pH environment. To extend its applica- tion in solutions with higher pH values, three kinds of methods have been explored and used widely: the first way of improving the pH dependence of PAN reactivity was performed by using the sulfonation of PAN with 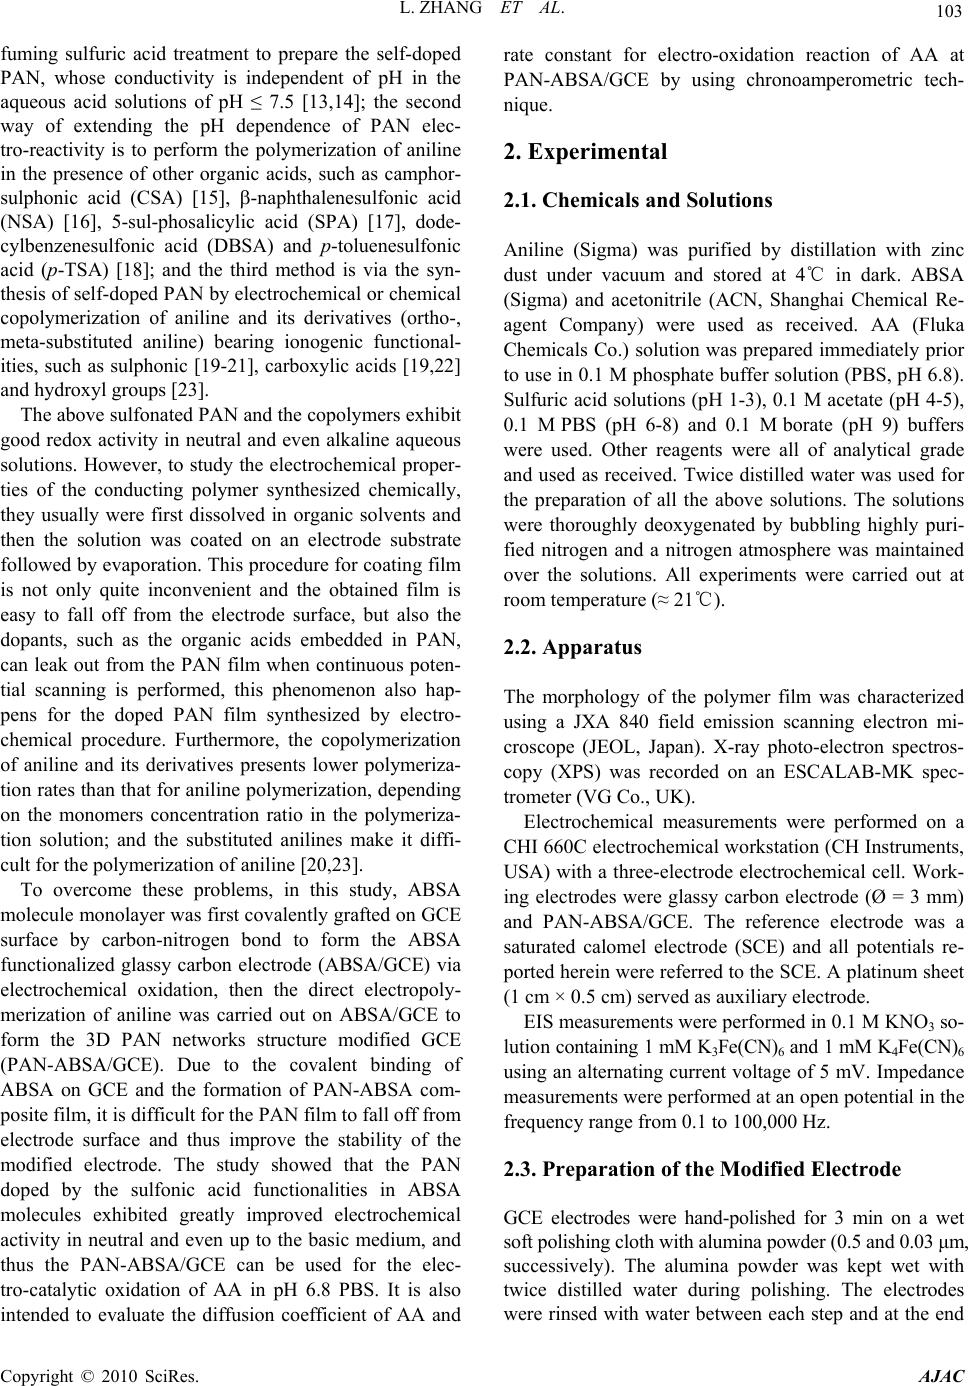 L. ZHANG ET AL. 103 fuming sulfuric acid treatment to prepare the self-doped PAN, whose conductivity is independent of pH in the aqueous acid solutions of pH ≤ 7.5 [13,14]; the second way of extending the pH dependence of PAN elec- tro-reactivity is to perform the polymerization of aniline in the presence of other organic acids, such as camphor- sulphonic acid (CSA) [15], -naphthalenesulfonic acid (NSA) [16], 5-sul-phosalicylic acid (SPA) [17], dode- cylbenzenesulfonic acid (DBSA) and p-toluenesulfonic acid (p-TSA) [18]; and the third method is via the syn- thesis of self-doped PAN by electrochemical or chemical copolymerization of aniline and its derivatives (ortho-, meta-substituted aniline) bearing ionogenic functional- ities, such as sulphonic [19-21], carboxylic acids [19,22] and hydroxyl groups [23]. The above sulfonated PAN and the copolymers exhibit good redox activity in neutral and even alkaline aqueous solutions. However, to study the electrochemical proper- ties of the conducting polymer synthesized chemically, they usually were first dissolved in organic solvents and then the solution was coated on an electrode substrate followed by evaporation. This procedure for coating film is not only quite inconvenient and the obtained film is easy to fall off from the electrode surface, but also the dopants, such as the organic acids embedded in PAN, can leak out from the PAN film when continuous poten- tial scanning is performed, this phenomenon also hap- pens for the doped PAN film synthesized by electro- chemical procedure. Furthermore, the copolymerization of aniline and its derivatives presents lower polymeriza- tion rates than that for aniline polymerization, depending on the monomers concentration ratio in the polymeriza- tion solution; and the substituted anilines make it diffi- cult for the polymerization of aniline [20,23]. To overcome these problems, in this study, ABSA molecule monolayer was first covalently grafted on GCE surface by carbon-nitrogen bond to form the ABSA functionalized glassy carbon electrode (ABSA/GCE) via electrochemical oxidation, then the direct electropoly- merization of aniline was carried out on ABSA/GCE to form the 3D PAN networks structure modified GCE (PAN-ABSA/GCE). Due to the covalent binding of ABSA on GCE and the formation of PAN-ABSA com- posite film, it is difficult for the PAN film to fall off from electrode surface and thus improve the stability of the modified electrode. The study showed that the PAN doped by the sulfonic acid functionalities in ABSA molecules exhibited greatly improved electrochemical activity in neutral and even up to the basic medium, and thus the PAN-ABSA/GCE can be used for the elec- tro-catalytic oxidation of AA in pH 6.8 PBS. It is also intended to evaluate the diffusion coefficient of AA and rate constant for electro-oxidation reaction of AA at PAN-ABSA/GCE by using chronoamperometric tech- nique. 2. Experimental 2.1. Chemicals and Solutions Aniline (Sigma) was purified by distillation with zinc dust under vacuum and stored at 4℃ in dark. ABSA (Sigma) and acetonitrile (ACN, Shanghai Chemical Re- agent Company) were used as received. AA (Fluka Chemicals Co.) solution was prepared immediately prior to use in 0.1 M phosphate buffer solution (PBS, pH 6.8). Sulfuric acid solutions (pH 1-3), 0.1 M acetate (pH 4-5), 0.1 M PBS (pH 6-8) and 0.1 M borate (pH 9) buffers were used. Other reagents were all of analytical grade and used as received. Twice distilled water was used for the preparation of all the above solutions. The solutions were thoroughly deoxygenated by bubbling highly puri- fied nitrogen and a nitrogen atmosphere was maintained over the solutions. All experiments were carried out at room temperature (≈ 21℃). 2.2. Apparatus The morphology of the polymer film was characterized using a JXA 840 field emission scanning electron mi- croscope (JEOL, Japan). X-ray photo-electron spectros- copy (XPS) was recorded on an ESCALAB-MK spec- trometer (VG Co., UK). Electrochemical measurements were performed on a CHI 660C electrochemical workstation (CH Instruments, USA) with a three-electrode electrochemical cell. Work- ing electrodes were glassy carbon electrode (Ø = 3 mm) and PAN-ABSA/GCE. The reference electrode was a saturated calomel electrode (SCE) and all potentials re- ported herein were referred to the SCE. A platinum sheet (1 cm × 0.5 cm) served as auxiliary electrode. EIS measurements were performed in 0.1 M KNO3 so- lution containing 1 mM K3Fe(CN)6 and 1 mM K4Fe(CN)6 using an alternating current voltage of 5 mV. Impedance measurements were performed at an open potential in the frequency range from 0.1 to 100,000 Hz. 2.3. Preparation of the Modified Electrode GCE electrodes were hand-polished for 3 min on a wet soft polishing cloth with alumina powder (0.5 and 0.03 μm, successively). The alumina powder was kept wet with twice distilled water during polishing. The electrodes were rinsed with water between each step and at the end Copyright © 2010 SciRes. AJAC 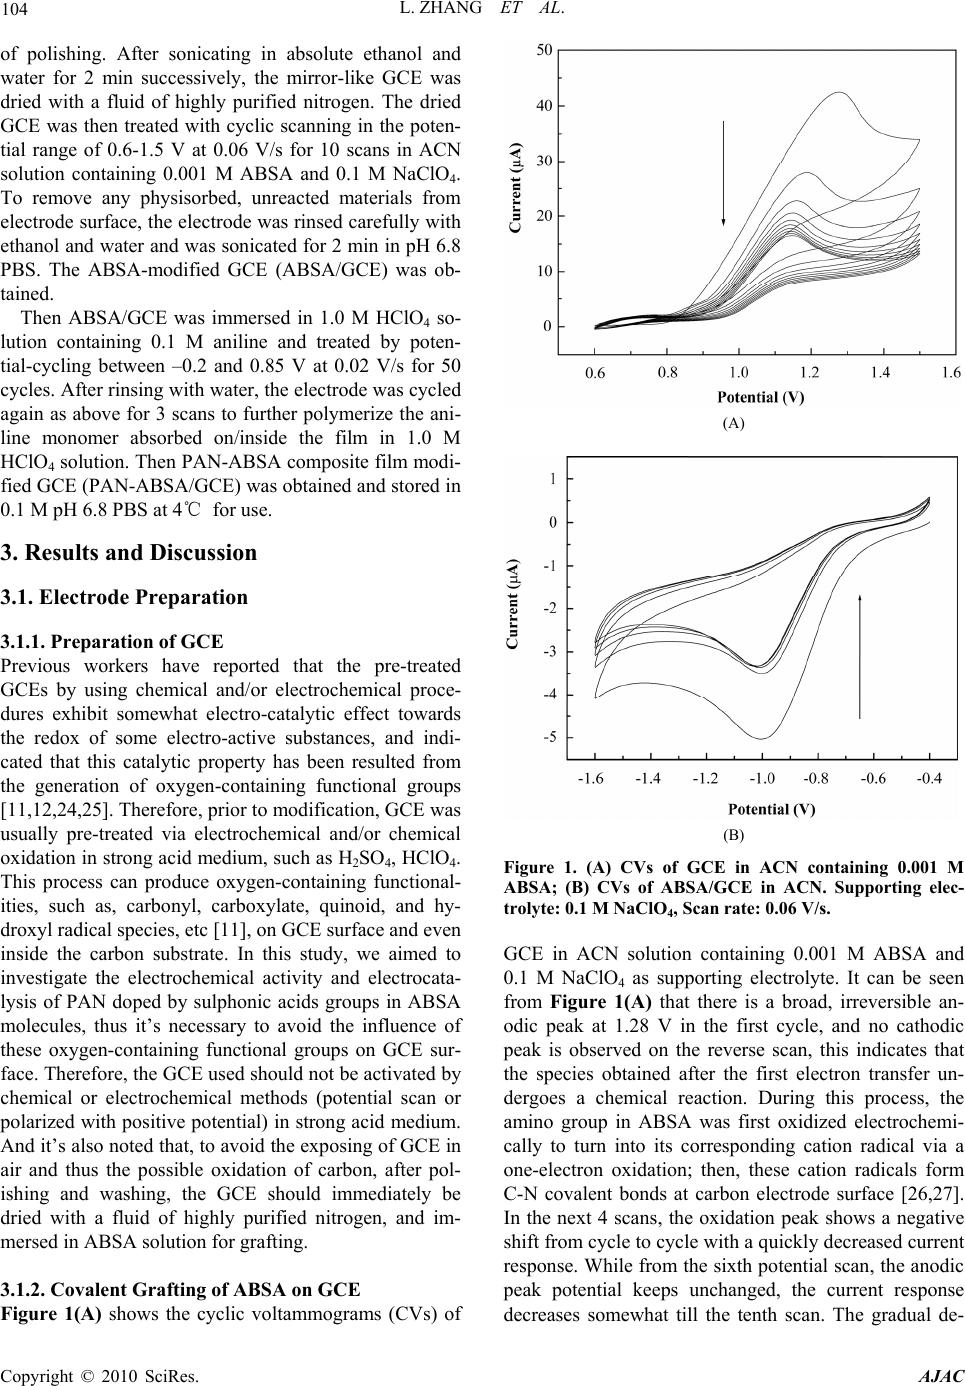 104 L. ZHANG ET AL. of polishing. After sonicating in absolute ethanol and water for 2 min successively, the mirror-like GCE was dried with a fluid of highly purified nitrogen. The dried GCE was then treated with cyclic scanning in the poten- tial range of 0.6-1.5 V at 0.06 V/s for 10 scans in ACN solution containing 0.001 M ABSA and 0.1 M NaClO4. To remove any physisorbed, unreacted materials from electrode surface, the electrode was rinsed carefully with ethanol and water and was sonicated for 2 min in pH 6.8 PBS. The ABSA-modified GCE (ABSA/GCE) was ob- tained. Then ABSA/GCE was immersed in 1.0 M HClO4 so- lution containing 0.1 M aniline and treated by poten- tial-cycling between –0.2 and 0.85 V at 0.02 V/s for 50 cycles. After rinsing with water, the electrode was cycled again as above for 3 scans to further polymerize the ani- line monomer absorbed on/inside the film in 1.0 M HClO4 solution. Then PAN-ABSA composite film modi- fied GCE (PAN-ABSA/GCE) was obtained and stored in 0.1 M pH 6.8 PBS at 4℃ for use. 3. Results and Discussion 3.1. Electrode Preparation 3.1.1. Preparation of GCE Previous workers have reported that the pre-treated GCEs by using chemical and/or electrochemical proce- dures exhibit somewhat electro-catalytic effect towards the redox of some electro-active substances, and indi- cated that this catalytic property has been resulted from the generation of oxygen-containing functional groups [11,12,24,25]. Therefore, prior to modification, GCE was usually pre-treated via electrochemical and/or chemical oxidation in strong acid medium, such as H2SO4, HClO4. This process can produce oxygen-containing functional- ities, such as, carbonyl, carboxylate, quinoid, and hy- droxyl radical species, etc [11], on GCE surface and even inside the carbon substrate. In this study, we aimed to investigate the electrochemical activity and electrocata- lysis of PAN doped by sulphonic acids groups in ABSA molecules, thus it’s necessary to avoid the influence of these oxygen-containing functional groups on GCE sur- face. Therefore, the GCE used should not be activated by chemical or electrochemical methods (potential scan or polarized with positive potential) in strong acid medium. And it’s also noted that, to avoid the exposing of GCE in air and thus the possible oxidation of carbon, after pol- ishing and washing, the GCE should immediately be dried with a fluid of highly purified nitrogen, and im- mersed in ABSA solution for grafting. 3.1.2. Coval e n t Gr af ting of ABSA on GCE Figure 1(A) shows the cyclic voltammograms (CVs) of (A) (B) Figure 1. (A) CVs of GCE in ACN containing 0.001 M ABSA; (B) CVs of ABSA/GCE in ACN. Supporting elec- trolyte: 0.1 M NaClO4, Scan rate: 0.06 V/s. GCE in ACN solution containing 0.001 M ABSA and 0.1 M NaClO4 as supporting electrolyte. It can be seen from Figure 1(A) that there is a broad, irreversible an- odic peak at 1.28 V in the first cycle, and no cathodic peak is observed on the reverse scan, this indicates that the species obtained after the first electron transfer un- dergoes a chemical reaction. During this process, the amino group in ABSA was first oxidized electrochemi- cally to turn into its corresponding cation radical via a one-electron oxidation; then, these cation radicals form C-N covalent bonds at carbon electrode surface [26,27]. In the next 4 scans, the oxidation peak shows a negative shift from cycle to cycle with a quickly decreased current response. While from the sixth potential scan, the anodic peak potential keeps unchanged, the current response decreases somewhat till the tenth scan. The gradual de- Copyright © 2010 SciRes. AJAC  L. ZHANG ET AL. 105 crease of the oxidation current is ascribed to the passiva- tion of the carbon electrode; this passivation is related to the grafting of ABSA onto GCE. This binding process is almost complete after 10 cycles. As a primary amine- containing compound, the above electrochemical-che- mical (EC) reaction for GCE modification can be pro- posed as Scheme 1. To investigate the binding of ABSA on the surface of GCE, XPS analysis was used to characterize the fabri- cated ABSA/GCE (Figure 2). It can be seen from Fig- ure 2 that, the maximal peak at 400.2 eV is assigned to the characteristic peak of N(1s) environment, which is also consistent with the formation of C-N bond between the amine cation radical and the aromatic moiety of GCE surface [26,27]; and the peak at 163.3 eV shows the presence of S(2p). This verifies the attachment of ABSA on GCE surface. (A) (B) Figure 2. XPS spectra for ABSA/GCE showing (A) the N(1s) peak and (B) the S(2p) peak. Scheme 1 Cyclic voltammetry can also be used to confirm the modification of ABSA on GCE: once ABSA has been bonded on GCE surface, its reduction should be observed. After being washed and ultrasonicated carefully, the ABSA/GCE was put into ACN solution containing 0.1 M NaClO4 as supporting electrolyte for potential scan (Figure 1(B)). As can be seen, the ABSA/GCE presents a well-defined reduction wave at –0.99 V, which corre- sponds to the reduction of the amine groups attached on GCE surface. However, with continuous potential scan the reduction peak current diminishes gradually till up to the forth cycle, which may be due to the re-protonation of the radical anion. And based on the area of the reduc- tion peak the number of molecules bonded on GCE can be deduced. The surface coverage (Γ) of ABSA on GCE surface can be estimated by integrating the reduction peak of the CV according to Q = nFAΓ, where Q is the charge involved in the reaction, n is the number of elec- tron transferred, F is the Faraday’s constant, and A is the geometric area of GCE. This procedure generates the surface coverage of 3.7 × 10⁻¹² mol/cm, indicating the monolayer coverage of ABSA on GCE [28]. 3.2. Morphology of the Polymer Film The polymerization of aniline was performed by poten- tial-cycling between –0.2 and 0.85 V at 0.02 V/s for 50 cycles in which the potential was cycled to positive limit of 0.85 V. This potential is just positive of the onset for aniline oxidation, and the lower scan rate which leads to the gentle formation of aniline cation radicals, ensures the slow deposition/self-assembly of PAN upon repeated potential cycling. The obtained PAN-ABSA composite film by the above procedure appears to be dark green and uniform by visual inspection. SEM was used to investi- gate the morphology of the composite film on GCE sur- face (Figure 3). It can be seen from Figure 3 that, a non-periodic three-dimensional networks structure is obtained. The diameter of the PAN fibril is in the range of 10-300 nm, and the average distance between the contact points is more than 300 nm. The detailed mecha- nism for the formation of the three dimensional networks is not clear now. However, it can be assumed that the polymerization occurs at the pinholes already present in the ABSA monolayer, or the monomer partitions into the ABSA monolayer where it undergoes oxidation. That is, Copyright © 2010 SciRes. AJAC  L. ZHANG ET AL. Copyright © 2010 SciRes. AJAC 106 3.3. Electrochemical Impedance Spectroscopy EIS can give information about the impedance changes of the electrode surface with different modifiers. EIS include a semicircle part and a linear part, the semicircle part at high frequencies corresponding to the electron transfer limited process and the linear part at low fre- quencies to the diffusion process. Figure 4 shows the EIS results for GCE, ABSA/GCE, and PAN-ABSA/GCE at open circuit. To understand clearly the electrical prop- erties of the electrodes/solution interfaces, the Randle’s equivalent circuit (inset of Figure 4, top) was chosen to fit the obtained impedance data [29]. In Randle’s circuit, it was assumed that the resistance to charge transfer (Rct) and the diffusion impedance (W) were both in parallel to the interfacial capacity (Cdl). This parallel combination of Rct and Cdl gives rise to a semicircle in the complex plane plot of Z" against Z′, the semicircle diameter equals the charge transfer resistance (Rct). This resistance exhib- its the electron transfer kinetics of the redox probe at electrode interface. It can be seen from the inset of Fig- ure 4 (bottom, curve a) that Fe(CN)6 3-/4- exhibits a very low charge transfer resistance at GCE. After modifying Figure 3. SEM image of the 3D PAN networks. aniline monomers were firstly oxidized to their cation radicals, and assuming a distribution of isolated sites, these cation radicals act as “nuclear sites” to direct the “linear growth/polymerization” of other aniline mono- mers in the same direction, and thus the bamboo-like fibrils were formed. With continuous increasing of the bamboo-like fibrils in length, these PAN fibrils must grow out from the ABSA monolayer and the adjacent PAN fibrils may grow to some “maximal length” and then tend/happen to contact together to form the stable star-like structure. The star-like wires tend to connect together by dendrites to form two-dimensional and fur- ther the three-dimensional networks. with ABSA, the Rct increases dramatically to about 14300 Ω (Figure 4, curve b), indicating that ABSA monolayer film hinders the charge transfer. While, when PAN was polymerized on ABSA/GCE surface, the Rct decreases to about 1350 Ω (inset of Figure 4, top, curve c), which indicates that PAN plays a role similar to a Figure 4. EIS plots of GCE (curve a), ABSA/GCE (curve b), and PAN-ABSA/GCE (curve c) in the presence of 1.0 mM Fe(CN)63-/4- containing 0.1 M KNO3. Frequency range is from 0.1 Hz to 100 KHz. Inset (top, right) is the Randle’s equivalent ircuit. c  L. ZHANG ET AL. Copyright © 2010 SciRes. AJAC 107 conductive wire or electron-conducting tunnel and thus makes electron transfer easier [30,31]. The differences of Rct among GCE, ABSA/GCE and PAN-ABSA/GCE electrodes indicate that PAN-ABSA composite film has been effectively attached on GCE surface. 3.4. Redox Electroactivity of PAN-ABSA/GCE To verify the improved electro-activity of the PAN doped by the sulfonic acid functionalities in ABSA molecules, the CVs of PAN-ABSA/GCE in solutions with different pH values have been performed (Figure 5). It can be seen from Figure 5 that PAN shows three pairs of sepa- rate redox peaks in strong acid medium (pH 1). Among these redox waves, the first sets of peaks located at 0.15 V is assigned to the transformations of leucoemeraldine to emeraldine salt, and the second pair of redox waves around 0.78 V is due to the transition from emeralding salt to the pernigraniline state. The third pair of peaks in middle is attributed to the defects in the linear structure of the polymer [32], this pair of peaks almost disappear when the pH values of solutions increase up to 3. When medium pH ≥ 5, the two sets of peaks overlap into one pair of peaks, which corresponds to the reaction between leucoemeraldine and pernigraniline. This is due to the pH dependence of the reaction between emeraldine and per- nigraniline. The redox electroactivity of ABSA-doped PAN still remains at pH 9, indicating the remarkable extension for the electro-activity of PAN. This im- provement is due to the incorporation of organic acid dopant ABSA into PAN film deposited onto the elec- trode surface. The presence of sulfonic acid groups can change the micro-environment of PAN backbone: it can be assumed that when there is an increase in medium pH, the –H+ ion in –SO3H groups can take a role of “buffer” Figure 5. CVs of PAN-ABSA/GCE in buffer solutions with different pH values. Scan rate: 0.05 V/s. and maintain the local pH value to some extent in PAN film near the electrode surface. Thus, the PAN doped by ABSA can still exhibit good electrochemical activity in solution with higher pH value. 3.5. Electro-Oxidation of AA at PAN-ABSA/GCE Figure 6(A) shows the CVs of GCE (a), PAN-ABSA/GCE (b) and ABSA/GCE (c) in 0.1 M PBS pH 6.8 containing 5.0 × 10⁻³ M AA, respectively. It can be seen from Figure 6(A) that the oxidation peak of AA is broad, irreproduci- ble at 0.39 V with Ep – Ep/2 = 0.16 V at GCE (curve a), and (A) (B) Figure 6. (A) (a) CVs of GCE, (b) PAN–ABSA/GCE and (c) ABSA/GCE in 0.1 M PBS pH 6.8 containing 5.00 × 10⁻³ M AA; (B) CVs of PAN-ABSA/GCE in 0.1 M PBS pH 6.8 con- taining different concentrations of AA. AA contents from a to i are: 5.00 × 10⁻⁴, 2.50 × 10⁻³, 4.50 × 10⁻³, 6.50 × 10⁻³, 8.50 × 10⁻³, 1.05 × 10⁻², 1.25 × 10⁻², 1.45 × 10⁻², and 1.65 × 10⁻² M, respectively. Scan rate: 0.06 V/s. Inset of (B) shows the cali- bration plot of ip versus cAA.  108 L. ZHANG ET AL. the oxidation peak current is about 46 μA. While, the oxidation current (≈ 65 μA) increases greatly and the peak potential shifts negatively to 0.17 V with Ep – Ep/2 = 0.046 V at PAN-ABSA/GCE (curve b). The obviously increased peak current and the decrease in oxidation overpotential of 0.22 V for AA indicate the effective electro-catalytic function of PAN-ABSA/GCE towards the oxidation of AA. The shift in the anodic overpoten- tial is due to a kinetics effect, thus a substantial increase in the rate of electron transfer from AA is observed, which indicates the improvement in the reversibility of the electron transfer processes. And also, as a compari- son, the electrochemical behavior of AA at ABSA/GCE has been investigated (curve c), it can be seen from curve c that the oxidation peak potential of AA has a slightly negative shift (0.35 V) and the oxidation peak current is nearly unchanged (47 μA) compared with that at GCE. This indicates that the obviously electrocatalytic oxida- tion of AA is mainly due to the doped PAN by ABSA with sulfonic acid functionalities. Figure 6(B) shows the CVs of PAN-ABSA/GCE in 0.1 M PBS pH 6.8 containing different concentrations of AA. It can be seen that the oxidation peak current in- creases with increasing of AA concentration in the solu- tion. The inset of Figure 6(B) shows that the anode peak current is linearly dependent on the AA concentration from 5.00 × 10⁻⁴ M to 1.65 × 10⁻² M, the equation of lin- ear regression is Ipa (μA) = 20.2 + 0.62cAA with a correla- tion coefficient of 0.9973. To further investigate the transport characteristics of AA at the modified electrode, the CVs of PAN-ABSA/GCE in 3.5 × 10⁻³ M AA at different scan rates have been shown in Figure 7(A). It can be seen from Figure 7(A) that the oxidation peak potential of AA shifts to more positive with increasing scan rate; this indicates that there is a kinetics limitation in the reaction between the redox sites of PAN-ABSA composite film and AA. However, the voltammetric peak currents for the cata- lytic oxidation of AA at PAN-ABSA/GCE are propor- tional to the square root of scan rates in the range of 50-900 mV/s (Figure 7(A), inset), indicating that the electrode reaction is a diffusion-controlled process. Moreover, the plot of the scan rate-normalized current (I/υ1/2) versus scan rate (Figure 7(B)) shows the typical shape of an electrochemical-chemical (EC) catalytic process. 3.6. Chronoamperometric Measurements To investigate the electrode process of AA at PAN- ABSA/GCE, chronoamperometric measurements for AA with different concentrations at PAN-ABSA/GCE by setting the working electrode potential at 0.70 V have (A) (B) Figure 7. ( A) CVs of PAN-ABSA/G CE in 0.1 M PBS pH 6. 8 containing 3.50 × 10⁻³ M AA at different scan rates. Scan rates from a to j are 50, 100, 200, 300, 400, 500, 600, 700, 800 and 900 mV/s, respectively. Inset shows the calibration plot of Ip versus 1/2; (B) Plot of the anodic current function (I/ 1/2) versus scan rate ( ). been shown in Figure 8(A), the inset of Figure 8(A) shows the current responses of different concentrations of AA at fixed time of 8, 16 and 24 s, respectively. It can be seen from plots (a), (b) and (c) that the slopes of the calibrations decrease with the increasing time elapsed after potential step application. However, there is an al- most similar intersection between the currents measured at different time and AA concentrations. The typical I-t curve in Figure 8(A) indicates that the currents observed should be controlled by the diffusion of AA in solution. Thus, the current corresponding to the electrochemical reaction obeys Cottrell’s law [33]: 1/ 21/ 21/ 2 0 I nFAD ct (1) Copyright © 2010 SciRes. AJAC  L. ZHANG ET AL. 109 (A) (B) Figure 8. (A) Chronoamperograms of PAN-ABSA/GCE in solutions containing different concentrations of AA. AA contents from a to g are 0, 5.00 × 10⁻⁴, 2.50 × 10⁻³, 4.50 × 10⁻³, 6.50 × 10⁻³, 8.50 × 10⁻³, and 1.05 × 10⁻² M, respectively . Inset shows the dependenc e of the fixed-time current observed at (a) 8 s, (b) 16 s and (c) 24 s, respectively; (B) Dependence of Icat/IL on the t1/2 derived from the data of chronoampero- grams of curve a and c in (A). where D and c0 are the diffusion coefficient (cm2/s) and bulk concentration (mol/cm3), respectively. Based on (1), the plot of I versus t1/2 is a straight line, and the slope of such lines can be used to estimate the diffusion coeffi- cient of AA. The mean value of D is found to be 4.7 × 10⁻⁷ cm2/s. Chronoamperometry can also be employed to evaluate the catalytic rate constant for the reaction between AA and the redox sites of surface confined PAN film ac- cording to the method [34]: 1/2 1/21/21/2 cat Lerf expII (2) where Icat is catalytic current of AA at PAN-ABSA/GCE, IL is the limiting current in the absence of AA, and γ = kc0 t (c0 is the bulk concentration of AA) is the argument of the error function. When γ exceeds 2, the error func- tion is almost equal to 1 and therefore the above equation can be reduced to: 1/2 1/2 1/21/2 cat L0 I Ik ct (3) where t is the time elapsed (s). Based on the slope of the Icat/IL versus t1/2 plot, k can be obtained for a given AA concentration. One such plot is shown in Figure 8(B) constructed from the chronoamperogram of PAN-ABSA/ GCE in the absence and presence of 2.50×10⁻³ M AA, the catalytic rate constant (k) can thus be estimated to be 7.42 × 105 cm3/(mol s) based on this plot’s slop. Ac- cording to this method, the corresponding k values can also be obtained for AA with different concentrations. The mean value of k in AA concentration range of 5.00 × 10⁻⁴-1.05 × 10⁻² M is 7.51 × 105 cm3/(mol s). 3.7. Analytical Characterization The present doped-PAN modified GCE is useful in sensing AA in real samples. A tablet of vitamin c (10 mg per tablet) was first dissolved in 40 mL 0.1 M PBS pH 6.8, after filtration the AA solution was transferred into 100 mL volumetric flask and diluted to volume with 0.1 M PBS pH 6.8, thus a AA solution with content of 5.68 × 10⁻⁴ M (100 μg/mL) was obtained. Then 4.0 mL of the sample solution was placed into the electrochemical cell and the concentration of AA was detected using the cali- bration method. The results are listed in Table 1. To as- certain the validity of the proposed procedure based on the PAN-ABSA/GCE, the samples were spiked with certain amounts of standard AA solution (0.05 M) and then the total amount of AA was measured (Table 1). The recovery rates of the spiked samples were estimated to be between 94.3% and 97.0%. 3.8. Interference Study The influence of some foreign species on the detection of 5.0 × 10⁻⁴ M AA has been investigated. The tolerance limit was taken as the maximum concentration of the foreign substances, which caused an approximately ± 5% relative error in the determination. The tolerated concen- tration of some foreign substances was 0.1 M for Na+, Cl-1 and K+; 0.05 M for Mg2+ and Ca2+; 0.005 M for L-lysine, glucose, glycin, L-asparagine and glutamic acid. However, the presence of NADH, dopamine and uric acid will interfere with the sensing of AA. This is because Copyright © 2010 SciRes. AJAC  110 L. ZHANG ET AL. Table 1. Determination and recoveries of AA in Vitamin C tablet. Sample no. AA content (μg) AA detecteda (μg) Spike (μg) After spikea (μg) Recoverya (%) 1 400 391.2 88.1 471.6 96.6 2 400 389.8 132.2 516.1 97.0 3 400 388.7 176.2 549.8 95.4 4 400 390.6 220.3 585.4 94.3 Average 390.1 95.8 athe mean value of 5 determination results. that the doped-PAN modified GCE also shows elec- tro-catalytic activity towards the electro-oxidation of these species. The details about the electro-oxidation of NADH, dopamine and uric acid at PAN-ABSA/GCE are under investigation. 3.9. Electrode Stability, Reproducibility and Detection Limit The long-term stability of the modified electrode has been checked by measuring the current response for detection of 5.00 × 10⁻⁴ M AA from day to day during a storage in 0.1 M PBS pH 6.8 at 4℃. During the first day the current response had no apparent change and in the next five days the signal decreased about 7% of its initial response, and 12% for one month. The current values used for evaluating the stability of PAN-ABSA/GCE are the averages of 5 successive measurements of 5.00 × 10⁻⁴ M AA. Repetitive measurements have been carried out in so- lutions containing 5.0 × 10⁻⁴ M AA to characterize the reproducibility of PAN-ABSA/GCE. The results of 11 successive measurements showed a relative standard deviation of 2.7% for AA, indicating that the modified electrode was not subject to surface fouling by the oxida- tion products of AA. The fabrication reproducibility of five electrodes, prepared independently, shows an ac- ceptable extent with a relative standard deviation of 3.4% for the determination of 5.0 × 10⁻⁴ M AA. To evaluate the detection limit of the proposed ana- lytical procedure, the responses of 11 reagent blank sam- ples have been measured; the standard derivation (δ) was calculated to be 2.4 × 10⁻³. Based on the slope (S) of the working curve of 6.2 μA/mM, the detection limit (3δ/S) can be estimated to be 1.16 μM. 4. Conclusions This study reported the electrochemical synthesis of 3D PAN networks on ABSA functionalized GCE and its electro-catalytic oxidation towards AA. XPS, SEM, EIS and electrochemical techniques have been employed to characterize the obtained electrodes. The effective dop- ing of PAN by sulfonic functionalities in ABSA mole- cules changes the microenvironment of PAN backbone structure and maintains the local pH at a lower value. Therefore, the electrochemical activity of PAN was ex- tended to neutral medium and even to basic media. In pH 6.8 PBS, PAN-ABSA/GCE shows good electro-catalytic activity towards the oxidation of AA via a surface layer-mediated charge transfer. Due to the covalent grafting of ABSA layer on GCE surface, the PAN-ABSA composite film exhibits good stability and reproducibil- ity. The proposed procedure can be used for the deter- mination of AA in real sample with satisfactory results. 5. Acknowledgements This work was supported by the Innovation Program of Shanghai Municipal Education Commission (09YZ161) and the Natural Science Foundation of Shanghai (09ZR1423500). 6. References [1] M. S. Cho, S. Y. Park, J. Y. Hwang and H. J. Choi, “Synthesis and Electrical Properties of Polymer Compos- ites with Polyaniline Nanoparticles,” Materials Science and Engineering C, Vol. 24, No. 1-2, January 2004, pp. 15-18. [2] D. Zhang and Y. Wang, “Synthesis and Applications of One-Dimensional Nano-Structured Polyaniline: An Over- view,” Materials Science and Engineering B, Vol. 134, No. 1, September 2006, pp. 9-19. [3] M. Li, Y. Gou, Y. Wei, A. G. MacDiarmid and P. I. Lelkes, “Electrospinning Polyaniline-Contained Gelatin Nanofibers for Tissue Engineering Applications,” Bio- materials, Vol. 27, No. 13, May 2006, pp. 2705-2715. [4] D. Cheng, S. Ng and H. S. O. Chan, “Morphology of Polyaniline Nanoparticles Synthesized in Triblock Co- polymers Micelles,” Thin Solid Films, Vol. 477, No. 1-2, April 2005, pp. 19-23. [5] Y. G. Wang, H. Q. Li and Y. Y. Xia, “Ordered Whisker- like Polyaniline Grown on the Surface of Mesoporous Carbon and Its Electrochemical Capacitance Perform- ance,” Advanced Material, Vol. 18, No. 19, September 2006, pp. 2619-2623. [6] M. Akhtar, H. A. Weakliem, R. M. Paiste and K. Gaughan, “Polyaniline Thin Film Electrochromic Devices,” Syn- thetic Metals, Vol. 26, No. 3, November 1988, pp. 203-208. [7] D. E. Tallman, G. Spinks, A. Dominis and G. G. Wallace, “Electroactive Conducting Polymers for Corrosion Con- trol Part 1. General Introduction and a Review of Non-ferrous Metals,” Journal of Solid State Electro- chemistry, Vol. 6, No. 2, February 2002. pp. 73-84. Copyright © 2010 SciRes. AJAC  L. ZHANG ET AL. 111 [8] T. Tonosaki, T. Oho, K. Isomura and K. Ogura, “Effect of the Protonation Level of Poly(o-Phenylenediamine) (PoPD) on the AC Impedance of Humidity-Sensitive PoPD/Poly(Vinyl Alcohol) Composite Film,” Journal of Electroanalytical Chemistry, Vol. 520, No. 1-2, February 2002, pp. 89-93. [9] J. Yano, K. Terayama and S. Yamasaki, “Electrochemi- cally Prepared Poly(o-Phenylenediamine)-Prussian Blue Composite Film for a Three-Colour Expressible ECD Material,” Journal of Materials Science, Vol. 31, No. 18, January 1996, pp. 4785-4792. [10] J. Yano and S. Yamasaki, “Three-Color Electrochromism of an Aramid Film Containing Polyaniline and Poly(o- Phenylenediamine),” Synthetic Metals, Vol. 102, No. 1-3, June 1999, p. 1157. [11] X. H. Cai, K. Kalcher, C. Neuhold and B. Ogorevc, “An Improved Voltammetric Method for the Determination of Trace Amounts of Uric Acid with Electrochemically Pre- treated Carbon Paste Electrodes,” Talanta, Vol. 41, No. 3, March 1994, pp. 407-413. [12] T. Nagaoka and T. Yoshino, “Surface Properties of Elec- trochemically Pretreated Glassy Carbon,” Analytical Che- mistry, Vol. 58, No. 6, May 1986, pp. 1037-1042. [13] J. Yue, Z. H. Wang, K. R. Cromack, A. J. Epstein and A. G. MacDiarmid, “Effect of Sulfonic Acid Group on Polyaniline Backbone,” Journal of the American Chemi- cal Society, Vol. 113, No. 7, March 1991, pp. 2665-2671. [14] X. L. Wei, Y. Z. Wang, S. M. Long, C. Bobeczko and A. J. Epstein, “Synthesis and Physical Properties of Highly Sulfonated Polyaniline,” Journal of the American Chemi- cal Society, Vol. 118, No. 11, March 1996, pp. 2545- 2555. [15] L. V. Lukachova, E. A. Shkerin, E. A. Puganova, E. E. Karyakina, S. G. Kiseleva, A. V. Orlov, G. P. Kar- pacheva and A. A. Karyakin, “Electroactivity of Chemi- cally Synthesized Polyaniline in Neutral and Alkaline Aqueous Solutions: Role of Self-Doping and External Doping,” Journal of Electroanalytical Chemistry, Vol. 544, No. 1, March 2003, pp. 59-63. [16] L. Zhang, “The Electrocatalytic Oxidation of Ascorbic Acid on Polyaniline Film Synthesized in the Presence of β-Naphthalenesulfonic Acid,” Electrochimica Acta, Vol. 52, No. 24, August 2007, pp. 6969-6973. [17] C. D. Batich, H. A. Laitinen and H. C. Zhou, “Chromatic Changes in Polyaniline Films,” Journal of The Electro- chemical Society, Vol. 137, No. 3, March 1990, pp. 883-885. [18] M. M. Ayad and A. Z. Eman, “Doping of Polyaniline Films with Organic Sulfonic Acids in Aqueous Media and the Effect of Water on These Doped Films,” Euro- pean Polymer Journal, Vol. 44, No. 11, November 2008, pp. 3741-3747. [19] A. A. Karyakin, A. K. Strakhova and A. K. Yatsimirsky, “Self-Doped Polyanilines Electrochemically Active in Neutral and Basic Aqueous Solutions: Electropolymeri- zation of Substituted Anilines,” Journal of Electroana- lytical Chemistry, Vol. 371, No. 1-2, June 1994, pp. 259- 265. [20] C. Sanchís, H. J. Salavagione and E. Morallón, “Ferroce- nium Strong Adsorption on Sulfonated Polyaniline Modi- fied Electrodes,” Journal of Electroanalytical Chemistry, Vol. 618, No. 1-2, July 2008, pp. 37-73. [21] H. Tang, A. Kitani, T. Yamashita and S. Ito, “Highly Sulfonated Polyaniline Electrochemically Synthesized by Polymerizing Aniline-2,5-Disulfonic Acid and Copoly- merizing It with Aniline,” Synthetic Metals, Vol. 96, No. 1, July 1998, pp. 43-48. [22] Y. Wang and W. Knoll, “In situ Electrochemical and Surface Plasmon Resonance (SPR) Studies of Aniline- Carboxylated Aniline Copolymers,” Analytica Chimica Acta, Vol. 558, No. 1-2, February 2006, pp. 150-157. [23] M. Liu, M. Ye, Q. Yang, Y. Zhang, Q. Xie and S. Yao, “A New Method for Characterizing the Growth and Prop- erties of Polyaniline and Poly (Aniline-co-o-Aminophenol) Films with the Combination of EQCM and in situ FTIR Spectroelectrochemisty,” Electrochimica Acta, Vol. 52, No. 1, October 2006, pp. 342-352. [24] J. F. Evans, T. Kuwana, M. T. Henne and C. P. Royer, “Electrocatalysis of Solution Species Using Modified Electrodes,” Journal of Electroanalytical Chemistry, Vol. 80, No. 2, July 1977, pp. 409-416. [25] G. N. Kamau, W. S. Willis and J. F. Rusling, “Electro- chemical and Electron Spectroscopic Studies of Highly Polished Glassy Carbon Electrodes,” Analytical Chemis- try, Vol. 57, No. 2, 1985, pp. 545-551. [26] B. Barbier, J. Pinson, G. Desarmot and M. Sanchez, “Electrochemical Bonding of Amines to Carbon Fiber Surface toward Improved Carbon-Epoxy Composites,” Journal of the Electrochemical Society, Vol. 137, No. 6, June 1990, pp. 1757-1764. [27] R. S. Deinhammar, M. Ho, J. W. Anderegg and M. D. Porter, “Electrochemical Oxidation of Amine-Containing Compounds: A Route to the Surface Modification of Glassy Carbon Electrodes,” Langmuir, Vol. 10, No. 4, February 1994, pp. 1306-1313. [28] R. E. Dickerson, T. Takano, D. Eisenberg, O. B. Kallai, L. Samson, A. Cooper and E. Margoliash, “Ferricytochrome c I. General Features of the Horse and Bonito Proteins at 2.8 A Resolution,” The Journal of Biological Chemistry, Vol. 246, No. 5, March 1971, pp. 1511-1535. [29] H. O. Finklea, D. A. Snider, J. Fedyk, E. Sabatani, Y. Gafni and I. Rubinstein, “Characterization of Octadecanethiol- Coated Gold Electrodes as Microarray Electrodes by Cyclic Voltammetry and AC Impedance Spectroscopy,” Langmuir, Vol. 9, No. 12, September 1993, pp. 3660- 3667. [30] J. J. Gooding, R. Wibowo, J. Q. Liu, W. R. Yang, D. Losic, S. Orbons, F. J. Mearns, J. G. Shapter and D. B. Hibbert, “Protein Electrochemistry Using Aligned Carbon Nanotube Arrays,” Journal of the American Chemical Society, Vol. 125, No. 30, July 2003, pp. 9006-9007. [31] M. Wang, F. Zhao, Y. Liu and S. Dong, “Direct Electro- chemistry of Microperoxidase at Pt Microelectrodes Modified with Carbon Nanotubes,” Biosensors and Bio- electronics, Vol. 21, No. 1, July 2005, pp. 259-166. [32] M. Lapkowski, “Electrochemical Synthesis of Linear Copyright © 2010 SciRes. AJAC  112 L. ZHANG ET AL. Polyaniline in Aqueous Solutions,” Synthetic Metals, Vol. 35, No. 1-2, February-March 1990, pp. 169-182. [33] A. J. Bard and L. R. Faulkner, “Electrochemical Methods, Fundamentals and Applications,” Wiley Interscience, New York, 1980, p. 143. [34] Z. Galus, “Fundamentals of Electrochemical Analysis,” Ellis Horwood, New York, 1976, p. 313. Copyright © 2010 SciRes. AJAC |