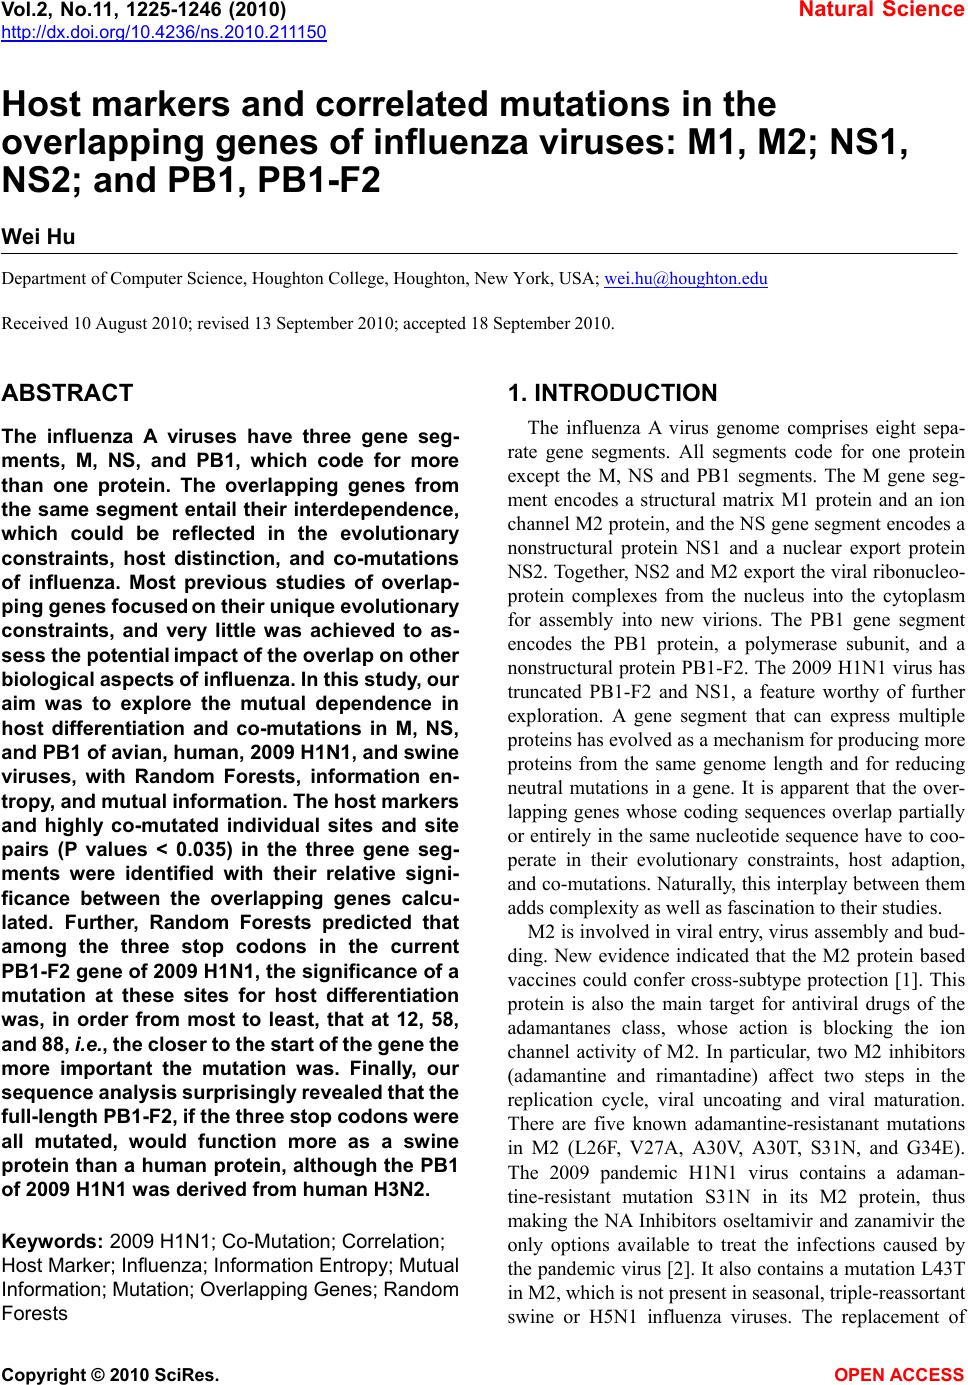
 Vol.2, No.11, 1225-1246 (2010) Natural Science http://dx.doi.org/10.4236/ns.2010.211150 Copyright © 2010 SciRes. OPEN ACCESS Host markers and correlated mutations in the overlapping genes of influenza viruses: M1, M2; NS1, NS2; and PB1, PB1-F2 Wei Hu Department of Computer Science, Houghton College, Houghton, New York, USA; wei.hu@houghton.edu Received 10 August 2010; revised 13 September 2010; accepted 18 September 2010. ABSTRACT The influenza A viruses have three gene seg- ments, M, NS, and PB1, which code for more than one protein. The overlapping genes from the same segment entail their interdependence, which could be reflected in the evolutionary constraints, host distinction, and co-mutations of influenza. Most previous studies of overlap- ping genes focused on their unique evolutionary constraints, and very little was achieved to as- sess the potential impact of the overlap on other biological aspects of influenza. In this study, our aim was to explore the mutual dependence in host differentiation and co-mutations in M, NS, and PB1 of avian, human, 2009 H1N1, and swine viruses, with Random Forests, information en- tropy, and mutual information. The host markers and highly co-mutated individual sites and site pairs (P values < 0.035) in the three gene seg- ments were identified with their relative signi- ficance between the overlapping genes calcu- lated. Further, Random Forests predicted that among the three stop codons in the current PB1-F2 gene of 2009 H1N1, the significance of a mutation at these sites for host differentiation was, in order from most to least, that at 12, 58, and 88, i.e., the closer to the start of the gene the more important the mutation was. Finally, our sequence analysis surprisingly revealed that the full-length PB1-F2, if the three stop codons were all mutated, would function more as a swine protein than a human protein, although the PB1 of 2009 H1N1 was derived from human H3N2. Keywords: 2009 H1N1; Co-Mutation; Correlation; Host Marker; Influenza; Information Entropy; Mutual Information; Mutation; Overlapping Genes; Random Forests 1. INTRODUCTION The influenza A virus genome comprises eight sepa- rate gene segments. All segments code for one protein except the M, NS and PB1 segments. The M gene seg- ment encodes a structural matrix M1 protein and an ion channel M2 protein, and the NS gene segment encodes a nonstructural protein NS1 and a nuclear export protein NS2. Together, NS2 and M2 export the viral ribonucleo- protein complexes from the nucleus into the cytoplasm for assembly into new virions. The PB1 gene segment encodes the PB1 protein, a polymerase subunit, and a nonstructural protein PB1-F2. The 2009 H1N1 virus has truncated PB1-F2 and NS1, a feature worthy of further exploration. A gene segment that can express multiple proteins has evolved as a mechanism for producing more proteins from the same genome length and for reducing neutral mutations in a gene. It is apparent that the over- lapping genes whose coding sequences overlap partially or entirely in the same nucleotide sequence have to coo- perate in their evolutionary constraints, host adaption, and co-mutations. Naturally, this interplay between them adds complexity as well as fascination to their studies. M2 is involved in viral entry, virus assembly and bud- ding. New evidence indicated that the M2 protein based vaccines could confer cross-subtype protection [1]. This protein is also the main target for antiviral drugs of the adamantanes class, whose action is blocking the ion channel activity of M2. In particular, two M2 inhibitors (adamantine and rimantadine) affect two steps in the replication cycle, viral uncoating and viral maturation. There are five known adamantine-resistanant mutations in M2 (L26F, V27A, A30V, A30T, S31N, and G34E). The 2009 pandemic H1N1 virus contains a adaman- tine-resistant mutation S31N in its M2 protein, thus making the NA Inhibitors oseltamivir and zanamivir the only options available to treat the infections caused by the pandemic virus [2]. It also contains a mutation L43T in M2, which is not present in seasonal, triple-reassortant swine or H5N1 influenza viruses. The replacement of  W. Hu / Natural Science 2 (2010) 1225-1246 Copyright © 2010 SciRes. OPEN ACCESS the non-polar residue L43 by the polar residue T43 in M2 may influence a nearby functional residue W44, the channel lock and the binding site of rimantadine [3]. NS1 is involved in suppressing antiviral interferon (IFN) induction during viral replication by preventing activation of the latent transcription factors IRF-3 and NF-κB [4], and thus is commonly regarded as a key fac- tor by which all influenza viruses antagonize host im- mune responses. Four C-terminal residues of NS1 could influence pathogenicity [5], and typically avian viruses have C-terminal ESEV (PDZ domain ligand motif, resi- dues 227–230), while humans have RSKV [6]. The NS1 of 2009 H1N1 is truncated due to a stop codon at 220 and therefore lacks this PDZ ligand motif. Using reverse genetics, the NS1 of A/California/04/09 (H1N1) was restored to its full length and it had no impact on virus replication and minimal effects on replication, pathoge- nicity, and transmission [7]. The NS1 of 2009 H1N also misses some other virulence factors, such as deletion of residues 80-84 [8], a glutamic acid at position 92 [9]. PB1-F2 is a recently discovered protein of the in- fluenza A virus. It is present in the nucleus, cytosol, and the mitochondria membrane of infected cells. Structural and functional analysis suggested that the biological function of PB1-F2 is primarily related to its direct inte- raction with membranes [10]. It can cause host immune cell death, induce inflammation by recruitment of in- flammatory cells, bind to PB1, increase the activity of the virus polymerase, elicit an antibody response, and form protein ion channels with no noticeable selectivity in membranes [10-12]. In contrast to previous pandemic viruses (1918 H1N1, 1957 H2N2, and 1968 H3N2), The PB1 gene segment of 2009 H1N1 codes for a truncated PB1-F2 protein. Full-length PB1-F2 proteins are com- monly found in almost all avian influenza viruses, but often become truncated during adaptation to mammalian hosts [13]. A shorter PB1-F2, missing the mitochondrial targeting sequence located at its C terminus, may result in less efficient mitochondrial localization and PB1 binding, thus leading to less virus virulence. The low pathogenicity of 2009 H1N1 could be attributed, in part, to the absence of full-length PB1-F2 protein. A specific amino acid (serine) at position 66 of PB1-F2 (97 in PB1 numbering) was found correlated with pathogenicity. S66 appeared in the three previous pandemic influenza viruses, 1918 H1N1, 1957 H2N2, and 1968 H3N2 [14,15], however, the significantly less virulent strains in human, and swine typically had a N at 66. To change from low to high pathogenicity (from N to S), a mutation a --> g was required at the second posi- tion in codon 66. By generating two strains of 2009 H1N1 with productive PB1-F2 open reading frames containing either an N at position 66 of PB1-F2 or a S at position 66, one report found that PB1-F2 expression by the these two strains could modulate the immune re- sponse to infection while having a minimal effect on virulence [16]. Some evidence also suggested that the function of this protein might not universal, i.e., the im- pact of PB1-F2 on polymerase activity is strain specific and does not affect pathogenicity [11]. The virulence of influenza is a multigenic trait. It de- pends on the interaction between the virus and host, the specific virulence markers in the genes of the virus, and the level of immune protection in the hosts. There are five basic virulence factors of influenza viruses [17]. The first is the PB1-F2 protein that targets the virus to the inner and outer mitochondrial membranes, causing damages to the cells and then inducing intrinsic apopto- sis and cell death. The second is the nonstructural pro- tein, NS1, which inhibits alpha-interferon to shut down host defense against influenza. The third and the fourth involve the protease susceptibility of HA and HA-NA ratio that is determined by the binding of HA to neura- minic acid. Lastly, the ability of the host immune system to recognize the two major antigenic constituents, HA and NA, of the virus is another factor. When the in- fluenza virus leaps from animal species to humans, it could generate a novel virus of pandemic potential with high virulence, and the pandemic 2009 H1H1 was one such jump. Most previous studies of overlapping genes focused on the evolution of influenza. By assuming that selection operates independently on each gene in an overlapping pair, the two genes PB1-F2 and NS1, overlapping with PB1 and NS2 respectively, were found to have high nonsynonymous/synonymous rate ratio (dN/dS) indica- tive of positive selection [18-21]. Subsequent to these reports, a new model that accounts for different selection pressures on the genes in the overlap was developed. It found no evidence for positive selection in these two genes, illustrating that ignoring the unique evolutionary constraints on overlapping regions could results in a false appearance of positive selection [22]. In this study, we sought to understand the other bio- logical characteristics of the overlapping genes in the M, NS, and PB1 gene segments of avian, human, 2009 H1N1, and swine viruses: host distinction and co-muta- tions, by employing Random Forests, information theory including entropy and mutual information. Recently, Random Forests were applied successfully to the study of individual proteins and genes to identify novel host markers in the influenza viruses [23,24]. These host markers allow distinction of human virus from avian, 2009 H1N1, and swine viruses, and help to elucidate the mechanism for animal viruses to cross species barriers to infect humans. Considering all sites from their native  W. Hu / Natural Science 2 (2010) 1225-1246 Copyright © 2010 SciRes. OPEN ACCESS gene segment in the current study made it possible to investigate the relative significance and contribution of the two overlapping genes in host classification and co-variation. There are three interesting consequences of overlap to note. First, a single host marker or mutation in the overlapping region might affect both genes. Second, a synonymous mutation for one gene might be non- synonymous for the other. Third, a single mutation might confer a beneficial effect on one gene and the opposite on the other. All of these could bring in a challenge to the understanding of overlapping genes. As mentioned above, an intriguing feature of the 2009 pandemic H1N1 virus was that its PB1 gene segment has three stop codons in the second open reading frame that cause the PB1-F2 protein truncated and nonfunctional. However, the concern is that this novel virus might mu- tate so its PB1-F2 protein will be functional. Our study addressed this issue by quantifying the importance of several key sites in the PB1-F2 gene that has the poten- tial to change the current stop codons to produce a full-length PB1-F2, thus affecting the virulence of this virus. 2. MATERIALS AND METHODS 2.1. Sequence Data The amino acid and nucleotide sequences of influenza A virus employed in this study were downloaded from the Influenza Virus Resource of the National Center for Biotechnology Information (NCBI). All the sequences utilized in the study were aligned with MAFFT [25]. 2.2. Entropy and Mutual Information In information theory [26], entropy is a measure of the uncertainty associated with a random variable. Let be a discrete random variable that has a set of possible values with probabilities where . The entropy H of is Log The mutual information of two random variables is a quantity that measures the mutual dependence of the two variables or the average amount of information that conveys about , which can defined as ()( )() ,(, )I xyH xHyHxy=+− where is the entropy of , and is the joint entropy of and . if and only if and are independent random variables. In the current study, each of the N columns in a mul- tiple sequence alignment of a set of influenza protein or gene sequences of length N is considered as a discrete random variable (1 ≤i ≤N) that takes on one of the 20 (n=20) amino acid types or 4 (n=4) nucleotide types with some probability. has its minimum value 0 if all the amino acids or nucleotides at position i are the same, and achieves its maximum if all the amino acid or nucleotide types appear with equal probability at posi- tion i, which can be verified by the Lagrange multiplier technique. A position of high entropy means that the amino acids or nucleotides are often varied at this posi- tion. While measures the genetic diversity at position i in our current study, measures the correlation between amino acid or nucleotide substitu- tions at positions i and j. 2.3. Mutual Information Evaluation In order to assess the statistical significance of the mutual information value of two positions in a multiple sequence alignment, it is necessary to show that this value is significantly higher than that based on random sequences. For each pair of positions in a multiple pro- tein/gene sequence alignment, we randomly permuted the amino acids/nucleotides from different sequences at the two positions and calculated the mutual information of these random sequences. This procedure was repeated 1000 times. The P value was calculated as the percentage of the mutual information values of the permuted se- quences that were higher than those of the original se- quences. 2.4. Random Forests Random Forest, proposed by Leo Breiman in 1999 [27], is an ensemble classifier based on many decision trees. Each tree is built on a bootstrap sample from the original training set and is unpruned to obtain low-bias trees. The variables used for splitting the tree nodes are a random subset of the whole variable set. The classifica- tion decision of a new instance is made by majority vot- ing over all trees. About one-third of the instances are left of the bootstrap sample and not used in the construc- tion of the tree. These instances in the training set are called “out-of-bag” instances and are used to evaluate the performance of the classifier, which can achieve both low bias and low variance with bagging and randomiza- tion. 2.5. Feature Selection Using Random Forests Random Forest calculates several measures of varia- ble importance. The mean decrease in accuracy measure was employed in [28] to rank the importance of the fea- tures in prediction. This measure is based on the de- crease of classification accuracy when values of a varia-  W. Hu / Natural Science 2 (2010) 1225-1246 Copyright © 2010 SciRes. OPEN ACCESS ble in a node of a tree are permuted randomly. In this study, two packages of R, randomForest and varSelRF [28], were utilized to compute the importance of the nucleotides in a given gene sequence dataset. The effec- tiveness and robustness of this technique as a feature selection method has been demonstrated in various stu- dies [29-34]. Random Forests produce non-deterministic outcomes. To compensate this bias, the Random Forests algorithm was run multiple times and then the average of the re- sults was taken. The importance of each position in the nucleotide sequences was based on the averaged calcula- tions by using the function randomVarImpsRF in var- SelRF repeated 5 times. 3. RESULTS Before presenting the main findings of this work, it was instructive to render some relevant sequence infor- mation about the M, NS, and PB1 segments. The first piece of such information was the Hamming distances of M, NS, and PB1 of influenza viruses based on their consensus nucleotide sequences, which measured the similarities of the three gene segments. Notably, the dis- tance information in Table 1 was in agreement with the origins of the M, NS, and PB1 of 2009 H1N1 [35]. The Hamming distances of individual proteins or genes of influenza viruses were determined in [23,24]. The second piece of such information was mutation rate. The host markers identified in [23,24] were either synonymous or non-synonymous mutations between human and avian, 2009 H1N1, and swine viruses. To gain a global view of these mutations, synonymous and non-synonymous rates (dS and dN) between human and the other three viruses based on their consensus se- quences were computed (Table 2). In general dS were much higher than dN in all the genes. However, both dN and dS of NS1 were very high in avian-human compari- son, and dS of PB1-F2 was all zero in all avian-human, 2009 H1N1-human, and swine-human comparisons. 3.1. Host Markers in the M, NS, and PB1 Gene Segments Random Forests were applied to all sites in each gene segment to find host markers in the overlapping genes, with their relative importance calculated. These host markers allow distinction of human virus from avian, 2009 H1N1, and swine viruses. The distribution of top host markers in the two overlapping genes demonstrated the relative significance of each gene in host classifica- tion, which could not be revealed if each gene was ana- lyzed individually. Using the whole gene segment, sev- eral new sites were detected when compared to those found from each individual gene in [24]. It also con- firmed that the most important sites found from individ- ual genes remained the most important when measured from the whole gene segment. 3.1.1. M Segment M1 is an internal structural protein that forms a shell-like structure beneath the viral envelope. Unlike M1, M2 is a multifunctional protein, which has an ecto- domain (residues 1-24) important for incorporation into budding virus particles, the trans-membrane helix (resi- dues 25-43), an amphiphilic C-terminal helix (residues 47-60), and a cytoplasmic tail (residues 61-97), facilitat- ing virus assembly by binding to the M1 protein [2]. The N-terminal region of the M gene segment affects viral replication efficiency, and synonymous mutations intro- duced there cause an increased reduction in virus repli- cation [36]. The top 40 host markers in the M segment of different viruses were discovered by Random Forests (Figure 1). In comparison of the relative significance of M1 and M2 Table 1. Hamming distances of nucleotide sequences of M, NS, and PB1 of different origins. The minimum distance in each segment is marked with an asterisk. Dist(Human, 2009_H1N1) Dist(Swine, 2009_H1N1) Dist(Avian, Human) Dist(Avian, Swine) Table 2. dN and dS of the overlapping genes in M, NS, and PB1 of different origins. Gene M1 M2 NS1 NS2 PB1 PB1-F2 dN dS dN dS dN dS dN dS dN dS dN dS Avian/Human 0.0176 0.5158 0.0645 0.2781 1.2508 2.5035 0.0230 0.4898 0.0077 0.5857 0.0887 0 2009 H1N1/Human 0.0364 0.6304 Swine/Human 0.0140 0.3232 0.0456 0.3222 0.0944 0.4267 0.0302 0.5485 0.0062 0.3545 0.0738 0  W. Hu / Natural Science 2 (2010) 1225-1246 Copyright © 2010 SciRes. OPEN ACCESS Figure 1. Top 40 host markers in M of different origins. The positions in the figure are codons and the number in parenthesis is co- don position, and positions marked with an asterisk are host markers found in the M1 or M2 protein individually in [24]. for host distinction in the M gene segment, the number of sites selected in Figure 1 from avian, 2009 H1N1, and swine viruses were considered. On average swine M2 contributed the most sites (18.55% of its sites), avian M2 the second (15.46%), and 2009 H1N1 M2 the last (8.24%), and 2009 H1N1 M1 contributed the most sites (12.70%), avian M1 the second (9.92%), and swine M1 the last (8.73%). The sites 103(3), 115(1), 115(3), 137(1), 137(3), 218(1), and 218(3) were shared by avian, 2009 H1N1, and swine. Further, sites 115, 137, and 218 had two positions selected within the same codon, and sites 26 and 27 were selected as host markers in multiple in- fluenza species. Mutations at sites 26, 27, 30, 31, and 34, located in the trans-membrane domain of M2, were found associated with resistance to ion channel blockers such as adaman- tane-base drugs. The M2 of 2009 H1N1 carries one such mutation S31N [37] and another mutation C55F for en- hanced transmission. Although these two sites were not selected as host markers in 2009 H1N1, but site 55 was a host marker in the avian virus. The outstanding host markers selected in the M segment were: M1 115(1), 137(1), M2 54(2), 78(1) in avian virus, M1 28(3), 117(3), 166(3), 182(3), 214(3), and M2 43(2) in 2009 H1N1, and M2 78(1) in swine virus (Figure 1). The basic amino acids 101RKLKR105 of M1 were involved in vRNP binding and nuclear localization [38], and site 103(3) was within this motif with an amino acid L at this site in avian, human, 2009 H1N1, and swine viruses. The most significant site 43(2) in M2 of 2009 H1N1 in our analysis was also a host marker found in [39]. Residues 22-46 formed the functional core of M2 proton-selective ion channel [2], and several of the top host markers were in this region (Figure 1). The combi- nation of two residues E14 and F55 in M2 was a deter- minant of human-to-human transmission [40]. Random 0 0.005 0.01 0.015 0.02 0.025 0.03 0.035 0.04 Importance Top 40 important M positions separating avian from human viruses 0 0.0005 0.001 0.0015 0.002 0.0025 0.003 0.0035 Importance Top 40 important M positions separating 2009 pandemic H1N1 from human viruses 0 0.002 0.004 0.006 0.008 0.01 0.012 0.014 0.016 0.018 0.02 Importance Top 40 important M positions separating swine from human viruses 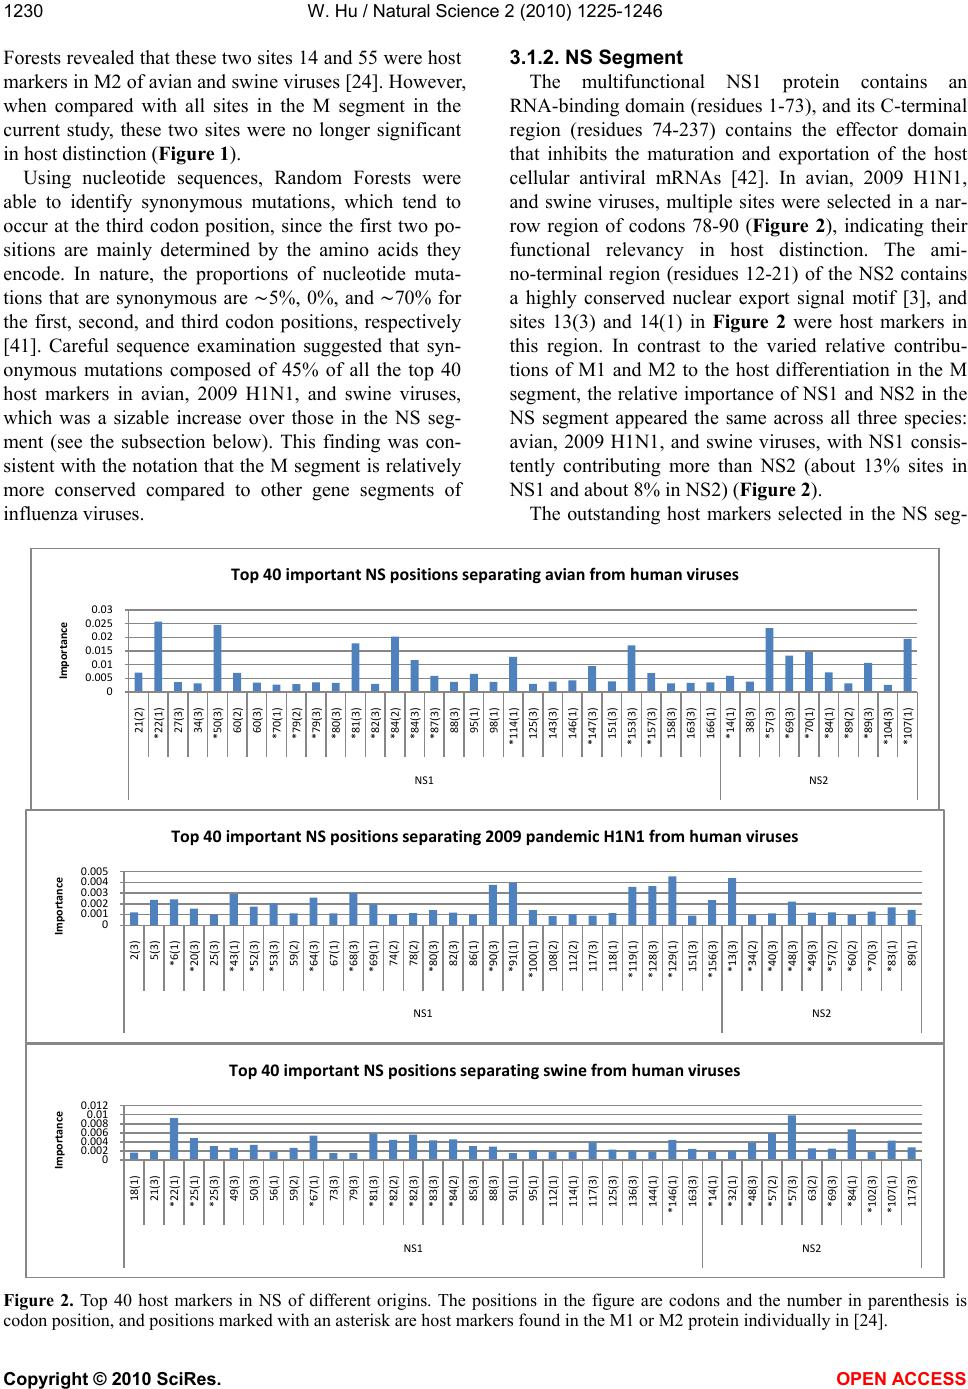 W. Hu / Natural Science 2 (2010) 1225-1246 Copyright © 2010 SciRes. OPEN ACCESS Forests revealed that these two sites 14 and 55 were host markers in M2 of avian and swine viruses [24]. However, when compared with all sites in the M segment in the current study, these two sites were no longer significant in host distinction (Figure 1). Using nucleotide sequences, Random Forests were able to identify synonymous mutations, which tend to occur at the third codon position, since the first two po- sitions are mainly determined by the amino acids they encode. In nature, the proportions of nucleotide muta- tions that are synonymous are ∼5%, 0%, and ∼70% for the first, second, and third codon positions, respectively [41]. Careful sequence examination suggested that syn- onymous mutations composed of 45% of all the top 40 host markers in avian, 2009 H1N1, and swine viruses, which was a sizable increase over those in the NS seg- ment (see the subsection below). This finding was con- sistent with the notation that the M segment is relatively more conserved compared to other gene segments of influenza viruses. 3.1.2. NS Segment The multifunctional NS1 protein contains an RNA-binding domain (residues 1-73), and its C-terminal region (residues 74-237) contains the effector domain that inhibits the maturation and exportation of the host cellular antiviral mRNAs [42]. In avian, 2009 H1N1, and swine viruses, multiple sites were selected in a nar- row region of codons 78-90 (Figure 2), indicating their functional relevancy in host distinction. The ami- no-terminal region (residues 12-21) of the NS2 contains a highly conserved nuclear export signal motif [3], and sites 13(3) and 14(1) in Figure 2 were host markers in this region. In contrast to the varied relative contribu- tions of M1 and M2 to the host differentiation in the M segment, the relative importance of NS1 and NS2 in the NS segment appeared the same across all three species: avian, 2009 H1N1, and swine viruses, with NS1 consis- tently contributing more than NS2 (about 13% sites in NS1 and about 8% in NS2) (Figure 2). The outstanding host markers selected in the NS seg- Figure 2. Top 40 host markers in NS of different origins. The positions in the figure are codons and the number in parenthesis is codon position, and positions marked with an asterisk are host markers found in the M1 or M2 protein individually in [24]. 0 0.005 0.01 0.015 0.02 0.025 0.03 Importance Top 40 important NS positions separating avian from human viruses 0 0.001 0.002 0.003 0.004 0.005 Importance Top 40 important NS positions separating 2009 pandemic H1N1 from human viruses 0 0.002 0.004 0.006 0.008 0.01 0.012 Importance Top 40 important NS positions separating swine from human viruses  W. Hu / Natural Science 2 (2010) 1225-1246 Copyright © 2010 SciRes. OPEN ACCESS ment were: NS1 22(1), 50(3), 84(2), NS2 57(3) in avian virus, NS1 90(3), 91(1), 129(1), NS2 13(3) in 2009 H1N1, NS1 22(1), NS2 57(3) in swine virus. Sites 82(3)in NS1 and 57(2) and 57(3) in NS2 were shared among avian, 2009 H1N1, and swine influenza. Among the several dominant mutations found in 2009 H1N1 in [4], a unique dominant mutation I123V occurred in the NS1 protein. This mutation is located in the effector domain of NS1, and its potential role in virulence and host adaptation needs to be clarified. Mutation G92E in avian H5N1 NS1 is known to promote the inhibition of host immune responses [43], but was not selected as a host marker in this analysis. Sequence survey indicated that the synonymous muta- tions occurred at the top 40 host markers in the NS seg- ment comprised about 1/3 of all the top 40 sites in avian, 2009 H1N1, and swine viruses, thus rendering new and subtle host markers that complemented the non-synony- mous mutations identified using amino acid sequences in [23]. Notably, there were a cluster of synonymous muta- tions occurring within the codons 79 -- 88. The identity of the nucleotide sequence of 2009 H1N1 NS1 is closest to swine NS1, and both of them have a stop codon (tga) at 220 while avian and human NS1 genes have cgg(R) at 220, showing two mutations at 220(1) and 220(3) (62(3) and 63(2) in PB1-F2 number- ing). Additionally, swine NS1 220(3) (63(2) in NS2 numbering) was selected as a host marker in the NS segment in the current analysis. Interestingly, when con- sidering the sites in NS1 and NS2 individually, NS1 sites 220(1) and 220(3) was not selected as a important host marker in NS1, however, NS2 62(3) of 2009 H1N1 and swine viruses was a host marker in NS2 [24]. This phe- nomena suggested that a site in the overlapping region might be significant for one gene, but not for the other. Four C-terminal residues of the NS1 protein of highly pathogenic avian virus form a potential PDZ ligand binding motif of the ESEV type. By contrast, the NS1 proteins in most lowly pathogenic human viruses contain a different motif (RSKV), which cannot bind PDZ-containing proteins. The C-terminus of NS1 pro- tein of 2009 H1N1 has a motif GTEI, similar to the swine motif GSEI (Table 3). Thus, the 2009 H1N1 may exhibit low pathogenicity [37]. The Hamming distances of 2009 H1N1 motif to the motif of other species were: dist (2009 H1N1, avian) = 3, dist(2009 H1N1, human) = 4, and dist(2009 H1N1, swine) = 1, reflecting the swine origin of the NS of 2009 N1N1 in this respect. 3.1.3. PB1 Segment The PB1 protein interacts with the PB2 and PA pro- teins to form the viral polymerase, which is responsible for the transcription and replication of the viral genome. However, the PB1-F2 protein originating from an alter- native reading frame in PB1 has completely different functions. It has proapoptotic properties and plays a role in the virulence of influenza. PB1 has five functional domains including NLS and cRNA, vRNA, PA, and PB2 binding domains. Residues 1--25 and 600 -- 757 of PB1 bind to PA and PB2 respectively. In all the three in- fluenza species, there was one site selected in the PA binding region and 7-9 sites in the PB2 binding region. Additionally, swine virus had a larger number of host markers (9 of them) in the codons 300 -- 400 that were in the cRNA binding domain of PB1, while avian and 2009 H1N1 viruses had only three host markers in the same region (Figure 3). The outstanding host markers selected in the PB1 segment were: 322(3) in avian virus, 62(3), 167(1), 435(2), 601(3) in 2009 H1N1, 60(3) in swine virus. The PB1 protein of 2009 H1N1 appeared to have more out- standing host markers than avian and swine viruses (Figure 3), implying that the novel virus of 2009 H1N1 is still experiencing genetic drifting to make its human host adaption stable. There were several common hast markers in different viruses. Site 60(3) (29(2) in PB1-F2 numbering) was selected in avian, 2009 H1N1, and swine viruses, and site 81(3) (50(2) in PB1-F2 number- ing) was selected in 2009 H1N1and swine viruses. In the PB1 gene segment, the 2009 H1N1 PB1-F2 had more sites selected than avian and swine viruses (Figure 3), suggesting its critical role in host distinction for 2009 H1N1. It further demonstrated that the important host markers found in the PB1-F2 sequences were also sig- nificant in the whole PB1 sequences, though only few of them were selected competitively. Among the three stop codons in PB1-F2 of 2009 H1N1, two of them were selected as host markers in the whole PB1 segment: 43(3) and 89(3) (12(2) and 58(2) in PB1-F2 numbering), implying that the relative signific- ance of host markers changed when measured from PB1-F2 to PB1. In 2009 H1N1 PB1-F2, 12(2) and 58(2) were the top two sites (Figure 4), but of the eight sites in PB1-F2 selected from PB1, the top two sites were 62(3) and 102(3) (31(2) and 71(2) in PB1-F2 numbering) (Figure 3). Table 3. Consensus nucleotides and amino acids at the PDZ ligand binding motif of different origins.  W. Hu / Natural Science 2 (2010) 1225-1246 Copyright © 2010 SciRes. OPEN ACCESS Figure 3. Top 40 host markers in PB1 of different origins. The positions marked with an asterisk are also found important in the indivdual PB1-F2 protein in Figure 4. 3.1.4. PB1-F2 Gene The newly discovered PB1-F2 is a proapoptotic pro- tein. A specific amino acid (serine) at position 66 of PB1-F2 (97 in PB1 numbering) was found correlated with pathogenicity as described in the Introduction sec- tion. In our analysis, Random Forests detected site 66(2) as an important site for host distinction in avian, but not in 2009 H1N1, and swine viruses (Figure 4). The residues 46 to 75 of PB1-F2 were shown to be both necessary and sufficient for mitochondrial targeting [3], and sites 60(2) in avian, 58(2) in 2009 H1N1, and 71(2) in swine viruses were the most significant host markers in this region. The number of host markers se- lected in the PB1-F2 gene from the PB1 segment varied in avian (one selected), 2009 H1N1 (eight selected), and swine (five selected) viruses (Figure 3), illustrating the relative importance of PB1-F2 in the PB1 segment of 2009 H1N1. The avian and swine viruses had about four outstand- ing host markers respectively, whereas 2009 H1N1 dis- played about 3 such markers (Figure 4). There were four sites in PB1-F2 shared by avian, 2009 H1N1, and swine: 29(2), 50(2), 60(2), and 82(2), reflecting their signific- ance in host adaption (Figure 4). At the same time, the sites 29(2) and 60(2) were the most important site in swine and avian respectively, and 29(2) (60(3) in PB1 numbering) was also an important site when considering all sites in the PB1 segment of avian, 2009 H1N1, and swine viruses (Figure 3), and site 50(2) (81(3) in PB1 numbering) was selected both in 2009 H1N1 and swine viruses. Currently, there are three translation stop codons in the PB1-F2 gene of 2009 H1N1 at positions 12, 58, and 88, preventing PB1-F2 protein expression. However, 0 0.005 0.01 0.015 0.02 0.025 Importance Top 40 important PB1 positions separating avian from human viruses 0 0.0005 0.001 0.0015 0.002 0.0025 0.003 0.0035 0.004 Importance Top 40 important PB1 positions separating 2009 pandemic from human viruses 0 0.002 0.004 0.006 0.008 0.01 0.012 0.014 0.016 Importance Top 40 importance PB1 positions separting swine from human viruses  W. Hu / Natural Science 2 (2010) 1225-1246 Copyright © 2010 SciRes. OPEN ACCESS Figure 4. Top 20 host markers in PB1-F2 of different origins The positions in the figure are codons and the number in pa- renthesis is codon position. PB1-F2 production could take place due to genetic mu- tations. Thus, it is critical to investigate the potential mutations that could influence the expression of the PB1-F2 protein of 2009 H1N1. Random forests indi- cated that the current three stop codons at 12, 58, and 88 in the PB1-F2 gene of 2009 H1N1 were crucial for its adaption to humans, with condons 12 and 58 being the two most significant sites when comparing them with other host markers in PB1-F2 (Figure 4). Further, in order from most to least, the importance of these three sites was as follows: 12, 58, and 88, implying that the closer to the start of the gene the more important the site became. The avian and swine PB1-F2 shared the same amino acid as human at these three sites (S at 12, W at 58 and 88), and therefore these sites were not considered important for host differentiation by Random Forests. The advantages of using nucleotide sequences over amino acid sequences are their ability to detect syn- onymous mutations and to pinpoint which position within a codon is important for host distinction. The consensus nucleotides and amino acids at the top 20 host markers identified by Random Forests were found (Ta- ble 4). Table 4 showed that 2009 H1N1 had taa(stop codon) at 12, and it took a mutation a --> c at the second position in the codon to became tca(S) as avian, human, and swine viruses had at 12. Also 2009 H1N1 had tag(stop codon) at 58, and it took a mutation a --> g at the second position in the codon to make tgg(W) as avian, human, and swine had at 58. Finally, 2009 H1N1 had tag (stop codon) at 88, and it took a mutation a --> g to make tgg(W) as avian, human, and swine had at 88. Different amino acids in the PB1-F2 of avian, human, 2009 H1N1, and swine viruses were identified (Table 5). To further elucidate the origin of 2009 H1N1 PB1-F2, a new strain from a recent human infection with triple-reassortant swine (H1N1) virus (A/Saskatchewan/ 5131/2009(H1N1)), termed as (triple/2009), was in- cluded. The Hamming distances of PB1-F2 of different origins (Table 6) suggested that the PB1-F2 of 2009 H1N1 was closer to swine than to avian and human vi- ruses despite its human H3N2 origin [44], and the triple/2009 was the closest to swine. If all the three mu- tations occurred at the three stop codons in PB1-F2 of 2009 H1N1, then the distance of PB1-F2 of 2009 H1N1 to that of avian, human, and swine viruses will be re- duced by three in each case. The novel sites of PB1-F2 of 2009 H1N1 that contained amino acids different from the same amino acids at these sites of other species were 18, 22, 50, and 57. Lastly, the novel sites of triple/2009 were also of interest, and they were 5, 44, and 55. The PB1-F2 of 2009 H1N1 is expected to be similar to that of humans, because the PB1 of 2009 H1N1 was of human H3N2 lineage [35], which could also be con- firmed by its GC content (Figure 5). Surprisingly, the GC content of PB1-F2 of 2009 H1N1 was more similar to swine than to human viruses (Figure 6). We subse- quently mutated the three stop codons in the 2009 H1N1 PB1-F2, and then found out that the GC content of the mutated gene (full-length) was very similar to swine (Figure 7). To further explore this peculiarity, PB1 of A/swine/Indiana /9K035 /19 99 (Swine/1999) was used, which is closest to that of A/California/04/2009 (H1N1) 0 0.005 0.01 0.015 0.02 0.025 0.03 0.035 Importance Positions Top 20 important PB1-F2 positions separating avian from human viruses 0 0.01 0.02 0.03 0.04 0.05 0.06 Importance Positions Top 20 important PB1-F2 positions separating 2009 pandemic H1N1 from human viruses 0 0.005 0.01 0.015 0.02 0.025 0.03 0.035 0.04 0.045 0.05 Importance Positions Top 20 important PB1-F2 positions separating swine from human viruses 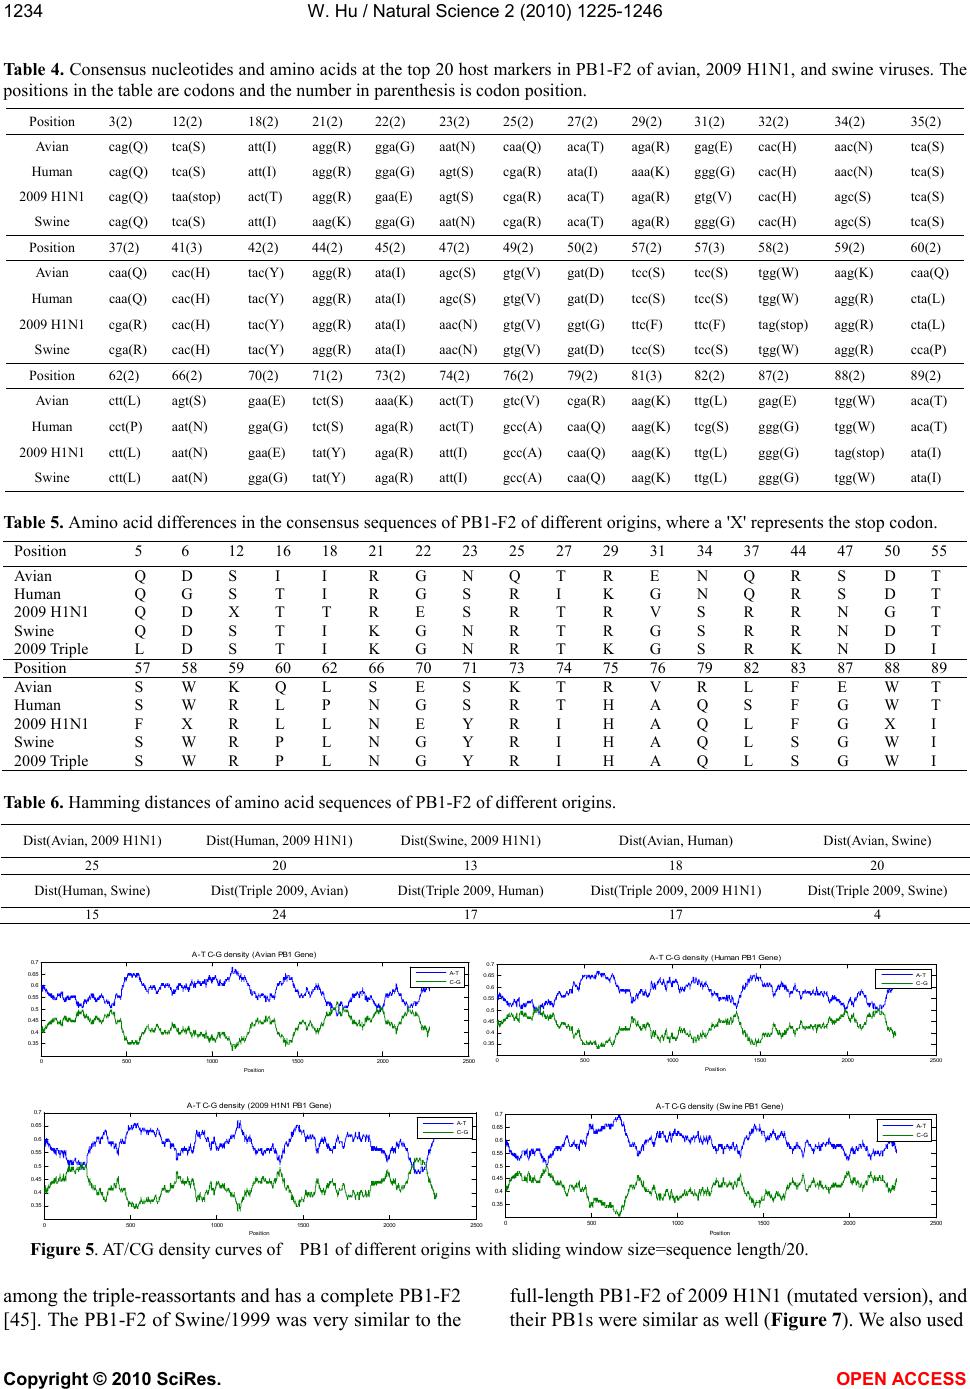 W. Hu / Natural Science 2 (2010) 1225-1246 Copyright © 2010 SciRes. OPEN ACCESS Table 4. Consensus nucleotides and amino acids at the top 20 host markers in PB1-F2 of avian, 2009 H1N1, and swine viruses. The positions in the table are codons and the number in parenthesis is codon position. Position 3(2) 12(2) 18(2) 21(2) 22(2) 23(2) 25(2) 27(2) 29(2) 31(2) 32(2) 34(2) 35(2) Avian cag(Q) tca(S) att(I) agg(R) gga(G) aat(N) caa(Q) aca(T) aga(R) gag(E) cac(H) aac(N) tca(S) Huma n cag(Q) tca(S) att(I) agg(R) gga(G) agt(S) cga(R) ata(I) aaa(K) ggg(G) cac(H) aac(N) tca(S) 2009 H1N1 cag(Q) taa(stop) act(T) agg(R) gaa(E) agt(S) cga(R) aca(T) aga(R) gtg(V) cac(H) agc(S) tca(S) Swine cag(Q) tca(S) att(I) aag(K) gga(G) aat(N) cga(R) aca(T) aga(R) ggg(G) cac(H) agc(S) tca(S) Position 37(2) 41(3) 42(2) 44(2) 45(2) 47(2) 49(2) 50(2) 57(2) 57(3) 58(2) 59(2) 60(2) Avian caa(Q) cac(H) tac(Y) agg(R) ata(I) agc(S) gtg(V) gat(D) tcc(S) tcc(S) tgg(W) aag(K) caa(Q) Huma n caa(Q) cac(H) tac(Y) agg(R) ata(I) agc(S) gtg(V) gat(D) tcc(S) tcc(S) tgg(W) agg(R) cta(L) 2009 H1N1 cga(R) cac(H) tac(Y) agg(R) ata(I) aac(N) gtg(V) ggt(G) ttc(F) ttc(F) tag(stop) agg(R) cta(L) Swine cga(R) cac(H) tac(Y) agg(R) ata(I) aac(N) gtg(V) gat(D) tcc(S) tcc(S) tgg(W) agg(R) cca(P) Position 62(2) 66(2) 70(2) 71(2) 73(2) 74(2) 76(2) 79(2) 81(3) 82(2) 87(2) 88(2) 89(2) Avian ctt(L) agt(S) gaa(E) tct(S) aaa(K) act(T) gtc(V) cga(R) aag(K) ttg(L) gag(E) tgg(W) aca(T) Huma n cct(P) aat(N) gga(G) tct(S) aga(R) act(T) gcc(A) caa(Q) aag(K) tcg(S) ggg(G) tgg(W) aca(T) 2009 H1N1 ctt(L) aat(N) gaa(E) tat(Y) aga(R) att(I) gcc(A) caa(Q) aag(K) ttg(L) ggg(G) tag(stop) ata(I) Swine ctt(L) aat(N) gga(G) tat(Y) aga(R) att(I) gcc(A) caa(Q) aag(K) ttg(L) ggg(G) tgg(W) ata(I) Table 5. Amino acid differences in the consensus sequences of PB1-F2 of different origins, where a 'X' represents the stop codon. Table 6. Hamming distances of amino acid sequences of PB1-F2 of different origins. Dist(Avian, 2009 H1N1) Dist(Human, 2009 H1N1) Dist(Swine, 2009 H1N1) Dist(Avian, Human) Dist(Avian, Swine) Dist(Human, Swine) Dist(Triple 2009, Avian) Dist(Triple 2009, Human) Dist(Triple 2009, 2009 H1N1) Dist(Triple 2009, Swine) Figure 5. AT/CG density curves of PB1 of different origins with sliding window size=sequence length/20. among the triple-reassortants and has a complete PB1-F2 [45]. The PB1-F2 of Swine/1999 was very similar to the full-length PB1-F2 of 2009 H1N1 (mutated version), and their PB1s were similar as well (Figure 7). We also used 05001000 1500 20002500 0.35 0.4 0.45 0.5 0.55 0.6 0.65 0.7 Position A-T C-G density (Avian PB1 Gene) A-T C-G 0500 1000 1500 2000 2500 0.35 0.4 0.45 0.5 0.55 0.6 0.65 0.7 Position A-T C-G density (Human PB1 Gene) A-T C-G 0500 1000 1500 2000 2500 0.35 0.4 0.45 0.5 0.55 0.6 0.65 0.7 Position A-T C-G density (2009 H1N1 PB1 Gene) A-T C-G 0500 1000 1500 2000 2500 0.35 0.4 0.45 0.5 0.55 0.6 0.65 0.7 Position A-T C-G density (Swine PB1 Gene) A-T C-G 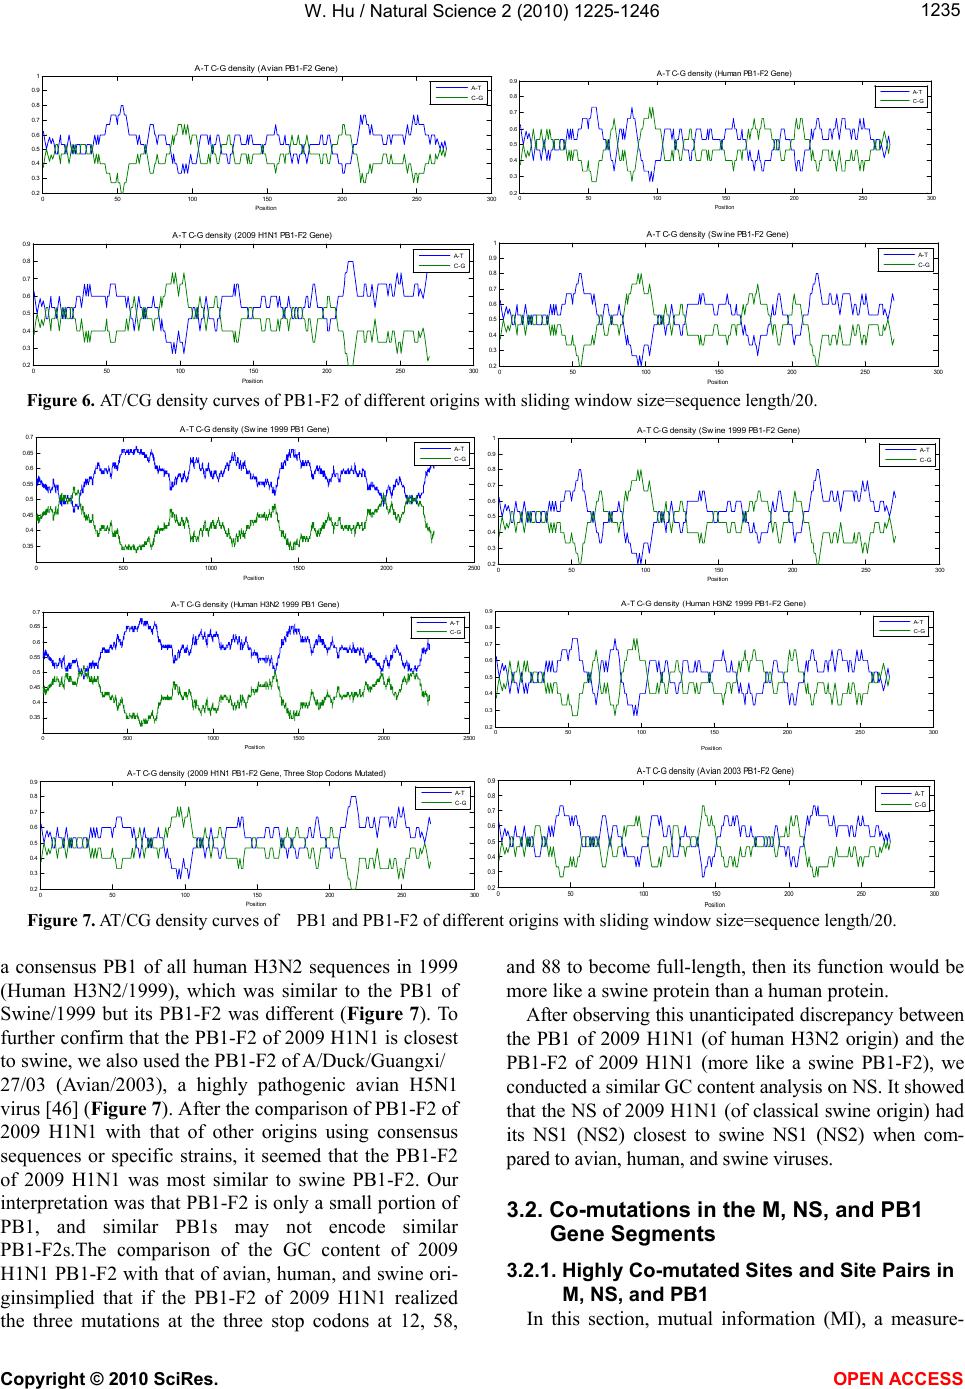 W. Hu / Natural Science 2 (2010) 1225-1246 Copyright © 2010 SciRes. OPEN ACCESS Figure 6. AT/CG density curves of PB1-F2 of different origins with sliding window size=sequence length/20. Figure 7. AT/CG density curves of PB1 and PB1-F2 of different origins with sliding window size=sequence length/20. a consensus PB1 of all human H3N2 sequences in 1999 (Human H3N2/1999), which was similar to the PB1 of Swine/1999 but its PB1-F2 was different (Figure 7). To further confirm that the PB1-F2 of 2009 H1N1 is closest to swine, we also used the PB1-F2 of A/Duck/Guangxi/ 27/03 (Avian/2003), a highly pathogenic avian H5N1 virus [46] (Figure 7). After the comparison of PB1-F2 of 2009 H1N1 with that of other origins using consensus sequences or specific strains, it seemed that the PB1-F2 of 2009 H1N1 was most similar to swine PB1-F2. Our interpretation was that PB1-F2 is only a small portion of PB1, and similar PB1s may not encode similar PB1-F2s. The comparison of the GC content of 2009 H1N1 PB1-F2 with that of avian, human, and swine ori- ginsimplied that if the PB1-F2 of 2009 H1N1 realized the three mutations at the three stop codons at 12, 58, and 88 to become full-length, then its function would be more like a swine protein than a human protein. After observing this unanticipated discrepancy between the PB1 of 2009 H1N1 (of human H3N2 origin) and the PB1-F2 of 2009 H1N1 (more like a swine PB1-F2), we conducted a similar GC content analysis on NS. It showed that the NS of 2009 H1N1 (of classical swine origin) had its NS1 (NS2) closest to swine NS1 (NS2) when com- pared to avian, human, and swine viruses. 3.2. Co-mutations in the M, NS, and PB1 Gene Segments 3.2.1. Highly Co-mutated Sites and Site Pairs in M, NS, and PB1 In this section, mutual information (MI), a measure- 050 100 150 200 250 300 0.2 0.3 0.4 0.5 0.6 0.7 0.8 0.9 1 Position A-T C-G density (Avian PB1-F2 Gene) A-T C-G 050100 150 200 250 300 0.2 0.3 0.4 0.5 0.6 0.7 0.8 0.9 Position A-T C-G density (Human PB1-F2 Gene) A-T C-G 050100 150 200 250 300 0.2 0.3 0.4 0.5 0.6 0.7 0.8 0.9 Position A-T C-G density (2009 H1N1 PB1-F2 Gene) A- T C-G 050 100 150 200 250 300 0.2 0.3 0.4 0.5 0.6 0.7 0.8 0.9 1 Position A-T C-G density (Swine PB1-F2 Gene) A- T C-G 0500 1000 1500 2000 2500 0.35 0.4 0.45 0.5 0.55 0.6 0.65 0.7 Position A-T C-G density (Swine 1999 PB1 Gene) A-T C-G 050100 150 200 250 300 0.2 0.3 0.4 0.5 0.6 0.7 0.8 0.9 1 Position A-T C-G density (Swine 1999 PB1-F2 Gene) A-T C-G 0500 1000 1500 2000 2500 0.35 0.4 0.45 0.5 0.55 0.6 0.65 0.7 Position A-T C-G density (Human H3N2 1999 PB1 Gene) A-T C-G 050100 150200 250 300 0.2 0.3 0.4 0.5 0.6 0.7 0.8 0.9 Position A-T C-G density (Human H3N2 1999 PB1-F2 Gene) A-T C-G 050 100 150200250 300 0.2 0.3 0.4 0.5 0.6 0.7 0.8 0.9 Position A-T C-G density (2009 H1N1 PB1-F2 Gene, Three Stop Codons Mutated) A-T C-G 050 100 150 200 250 300 0.2 0.3 0.4 0.5 0.6 0.7 0.8 0.9 Position A-T C-G density (Avian 2003 PB1-F2 Gene) A- T C-G 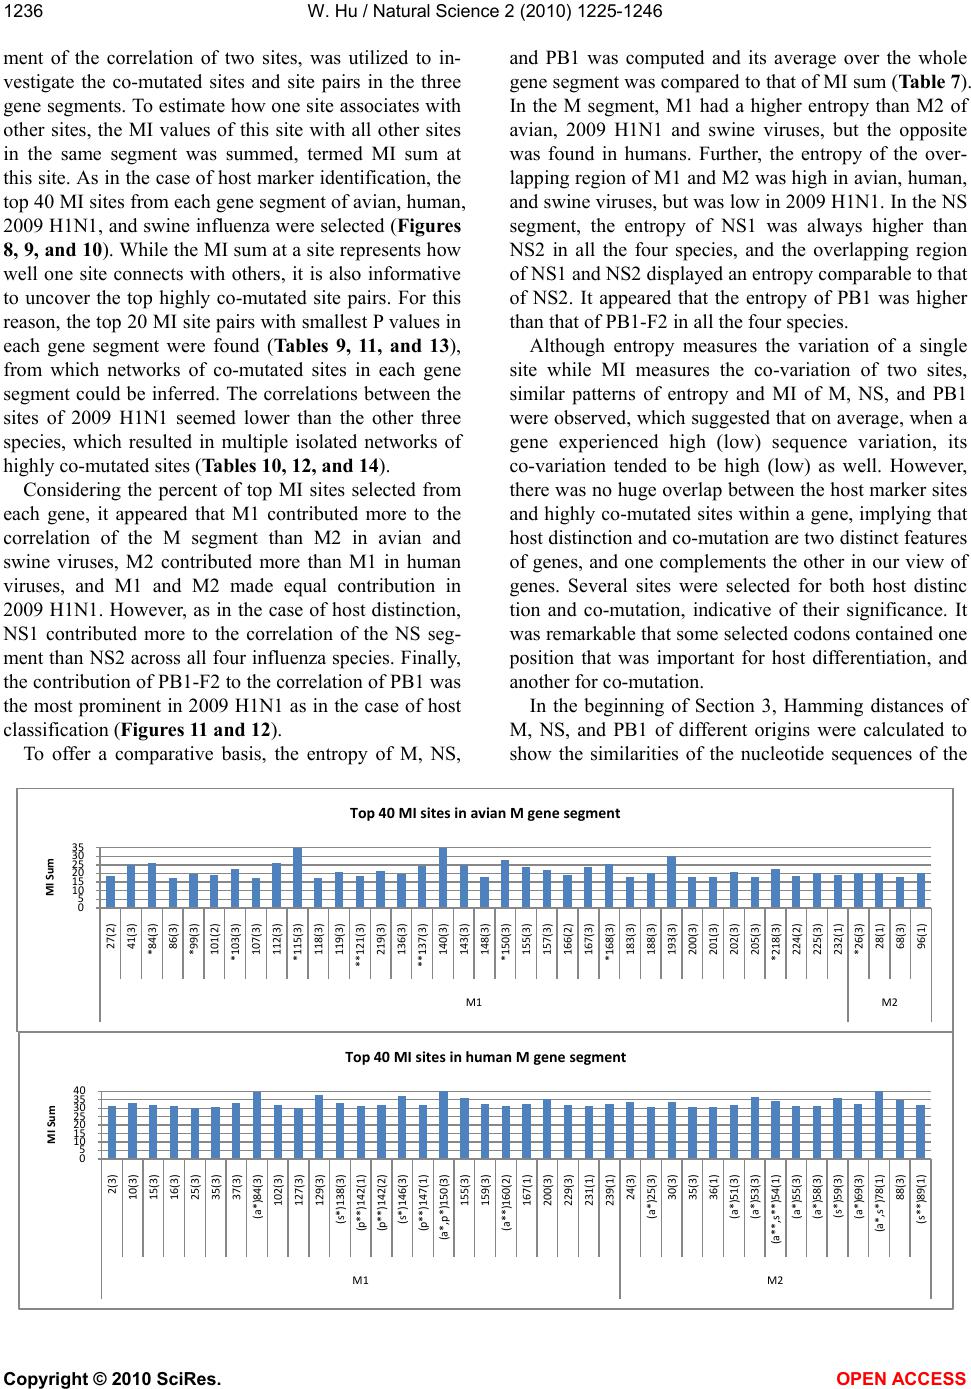 W. Hu / Natural Science 2 (2010) 1225-1246 Copyright © 2010 SciRes. OPEN ACCESS ment of the correlation of two sites, was utilized to in- vestigate the co-mutated sites and site pairs in the three gene segments. To estimate how one site associates with other sites, the MI values of this site with all other sites in the same segment was summed, termed MI sum at this site. As in the case of host marker identification, the top 40 MI sites from each gene segment of avian, human, 2009 H1N1, and swine influenza were selected (Figures 8, 9, and 10). While the MI sum at a site represents how well one site connects with others, it is also informative to uncover the top highly co-mutated site pairs. For this reason, the top 20 MI site pairs with smallest P values in each gene segment were found (Tables 9, 11, and 13), from which networks of co-mutated sites in each gene segment could be inferred. The correlations between the sites of 2009 H1N1 seemed lower than the other three species, which resulted in multiple isolated networks of highly co-mutated sites (Tables 10, 12, and 14). Considering the percent of top MI sites selected from each gene, it appeared that M1 contributed more to the correlation of the M segment than M2 in avian and swine viruses, M2 contributed more than M1 in human viruses, and M1 and M2 made equal contribution in 2009 H1N1. However, as in the case of host distinction, NS1 contributed more to the correlation of the NS seg- ment than NS2 across all four influenza species. Finally, the contribution of PB1-F2 to the correlation of PB1 was the most prominent in 2009 H1N1 as in the case of host classification (Figures 11 and 12). To offer a comparative basis, the entropy of M, NS, and PB1 was computed and its average over the whole gene segment was compared to that of MI sum (Table 7). In the M segment, M1 had a higher entropy than M2 of avian, 2009 H1N1 and swine viruses, but the opposite was found in humans. Further, the entropy of the over- lapping region of M1 and M2 was high in avian, human, and swine viruses, but was low in 2009 H1N1. In the NS segment, the entropy of NS1 was always higher than NS2 in all the four species, and the overlapping region of NS1 and NS2 displayed an entropy comparable to that of NS2. It appeared that the entropy of PB1 was higher than that of PB1-F2 in all the four species. Although entropy measures the variation of a single site while MI measures the co-variation of two sites, similar patterns of entropy and MI of M, NS, and PB1 were observed, which suggested that on average, when a gene experienced high (low) sequence variation, its co-variation tended to be high (low) as well. However, there was no huge overlap between the host marker sites and highly co-mutated sites within a gene, implying that host distinction and co-mutation are two distinct features of genes, and one complements the other in our view of genes. Several sites were selected for both host distinc tion and co-mutation, indicative of their significance. It was remarkable that some selected codons contained one position that was important for host differentiation, and another for co-mutation. In the beginning of Section 3, Hamming distances of M, NS, and PB1 of different origins were calculated to show the similarities of the nucleotide sequences of the 0 5 10 15 20 25 30 35 MI Sum Top 40 MI sites in avian M gene segment 0 5 10 15 20 25 30 35 40 MI Sum Top 40 MI sites in human M gene segment 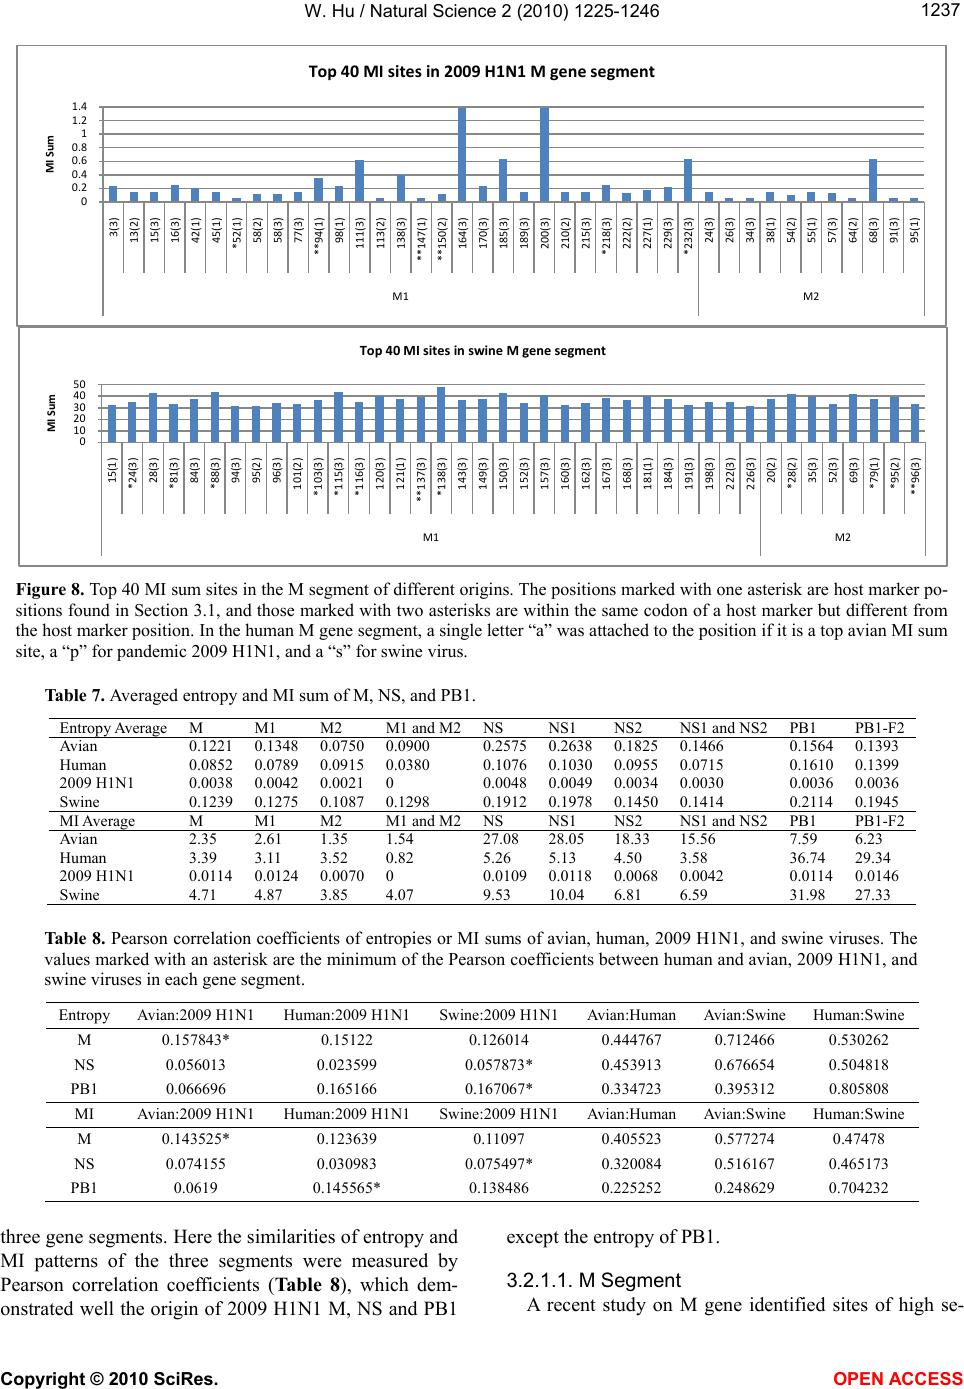 W. Hu / Natural Science 2 (2010) 1225-1246 Copyright © 2010 SciRes. OPEN ACCESS Figure 8. Top 40 MI sum sites in the M segment of different origins. The positions marked with one asterisk are host marker po- sitions found in Section 3.1, and those marked with two asterisks are within the same codon of a host marker but different from the host marker position. In the human M gene segment, a single letter “a” was attached to the position if it is a top avian MI sum site, a “p” for pandemic 2009 H1N1, and a “s” for swine virus. Table 7. Averaged entropy and MI sum of M, NS, and PB1. Table 8. Pearson correlation coefficients of entropies or MI sums of avian, human, 2009 H1N1, and swine viruses. The values marked with an asterisk are the minimum of the Pearson coefficients between human and avian, 2009 H1N1, and swine viruses in each gene segment. M 0.157843* 0.15122 0.126014 0.444767 0.712466 0.530262 NS 0.056013 0.023599 0.057873* 0.453913 0.676654 0.504818 MI Avian:2009 H1N1 Human:2009 H1N1 Swine:2009 H1N1 Avian:Human Avian:Swine Human:Swine NS 0.074155 0.030983 0.075497* 0.320084 0.516167 0.465173 PB1 0.0619 0.145565* 0.138486 0.225252 0.248629 0.704232 three gene segments. Here the similarities of entropy and MI patterns of the three segments were measured by Pearson correlation coefficients (Table 8), which dem- onstrated well the origin of 2009 H1N1 M, NS and PB1 except the entropy of PB1. 3.2.1.1. M Segment A recent study on M gene identified sites of high se- 0 0.2 0.4 0.6 0.8 1 1.2 1.4 MI Sum Top 40 MI sites in 2009 H1N1 M gene segment 0 10 20 30 40 50 MI Sum Top 40 MI sites in swine M gene segment 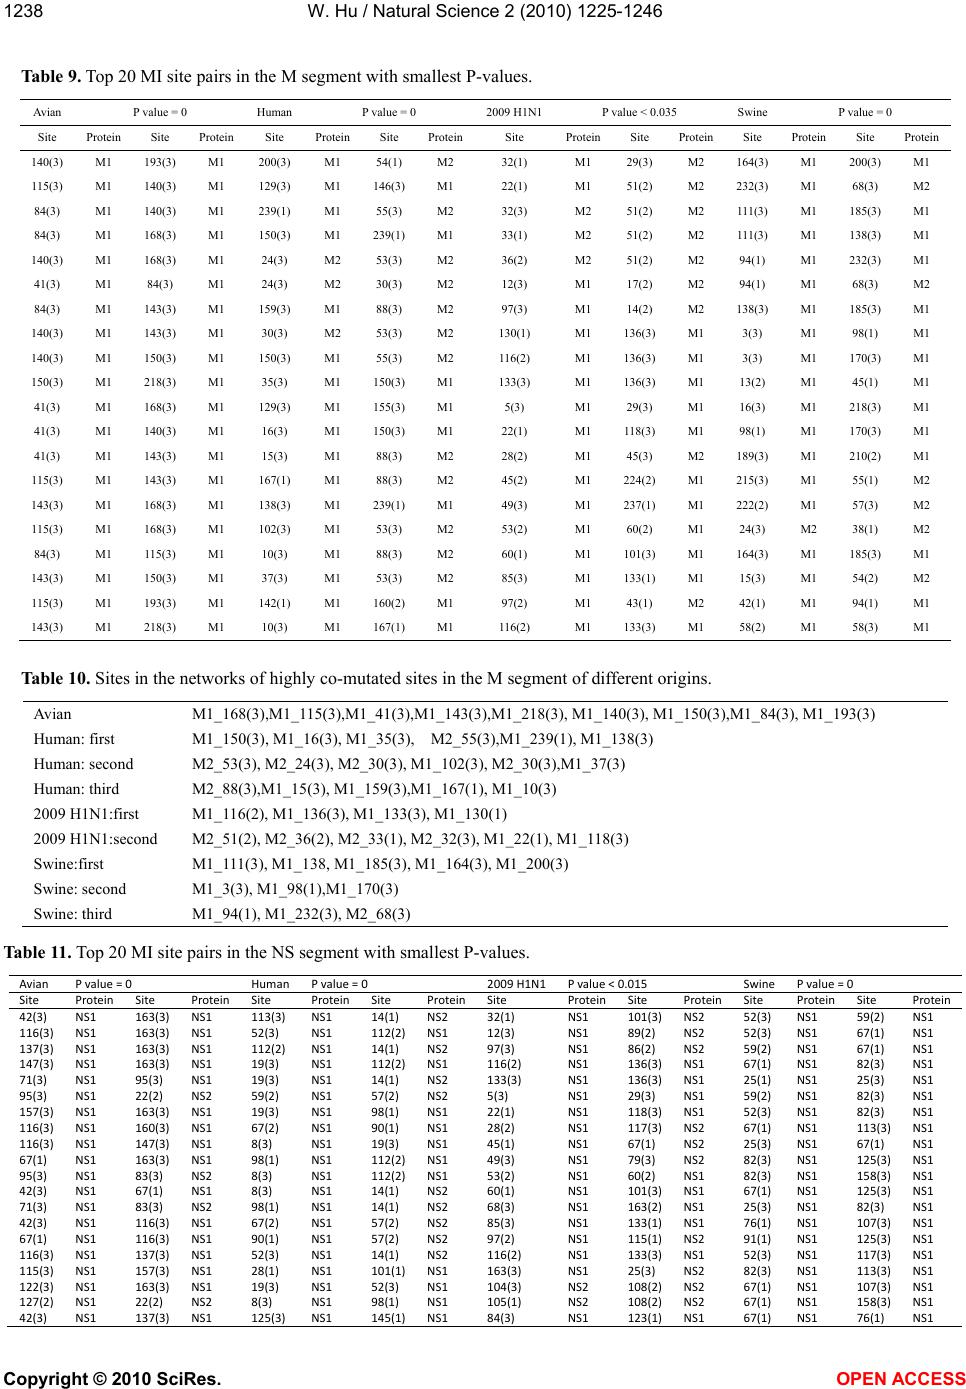 W. Hu / Natural Science 2 (2010) 1225-1246 Copyright © 2010 SciRes. OPEN ACCESS Table 9. Top 20 MI site pairs in the M segment with smallest P-values. Avian P value = 0 Hum an P value = 0 2009 H1N1 P value < 0.035 Swine P value = 0 Site Protein Site Protein Site Protein Site Protein Site Protein Site Protein Site Protein Site Protein 140(3) M1 193(3) M1 200(3) M1 54(1) M2 32(1) M1 29(3) M2 164(3) M1 200(3) M1 115(3) M1 140(3) M1 129(3) M1 146(3) M1 22(1) M1 51(2) M2 232(3) M1 68(3) M2 84(3) M1 140(3) M1 239(1) M1 55(3) M2 32(3) M2 51(2) M2 111(3) M1 185(3) M1 84(3) M1 168(3) M1 150(3) M1 239(1) M1 33(1) M2 51(2) M2 111(3) M1 138(3) M1 140(3) M1 168(3) M1 24(3) M2 53(3) M2 36(2) M2 51(2) M2 94(1) M1 232(3) M1 41(3) M1 84(3) M1 24(3) M2 30(3) M2 12(3) M1 17(2) M2 94(1) M1 68(3) M2 84(3) M1 143(3) M1 159(3) M1 88(3) M2 97(3) M1 14(2) M2 138(3) M1 185(3) M1 140(3) M1 143(3) M1 30(3) M2 53(3) M2 130(1) M1 136(3) M1 3(3) M1 98(1) M1 140(3) M1 150(3) M1 150(3) M1 55(3) M2 116(2) M1 136(3) M1 3(3) M1 170(3) M1 150(3) M1 218(3) M1 35(3) M1 150(3) M1 133(3) M1 136(3) M1 13(2) M1 45(1) M1 41(3) M1 168(3) M1 129(3) M1 155(3) M1 5(3) M1 29(3) M1 16(3) M1 218(3) M1 41(3) M1 140(3) M1 16(3) M1 150(3) M1 22(1) M1 118(3) M1 98(1) M1 170(3) M1 41(3) M1 143(3) M1 15(3) M1 88(3) M2 28(2) M1 45(3) M2 189(3) M1 210(2) M1 115(3) M1 143(3) M1 167(1) M1 88(3) M2 45(2) M1 224(2) M1 215(3) M1 55(1) M2 143(3) M1 168(3) M1 138(3) M1 239(1) M1 49(3) M1 237(1) M1 222(2) M1 57(3) M2 115(3) M1 168(3) M1 102(3) M1 53(3) M2 53(2) M1 60(2) M1 24(3) M2 38(1) M2 84(3) M1 115(3) M1 10(3) M1 88(3) M2 60(1) M1 101(3) M1 164(3) M1 185(3) M1 143(3) M1 150(3) M1 37(3) M1 53(3) M2 85(3) M1 133(1) M1 15(3) M1 54(2) M2 115(3) M1 193(3) M1 142(1) M1 160(2) M1 97(2) M1 43(1) M2 42(1) M1 94(1) M1 143(3) M1 218(3) M1 10(3) M1 167(1) M1 116(2) M1 133(3) M1 58(2) M1 58(3) M1 Table 10. Sites in the networks of highly co-mutated sites in the M segment of different origins. Avian M1_168(3),M1_115(3),M1_41(3),M1_143(3),M1_218(3), M1_140(3), M1_150(3),M1_84(3), M1_193(3) Human: first M1_150(3), M1_16(3), M1_35(3), M2_55(3),M1_239(1), M1_138(3) Human: second M2_53(3), M2_24(3), M2_30(3), M1_102(3), M2_30(3),M1_37(3) Human: third M2_88(3),M1_15(3), M1_159(3),M1_167(1), M1_10(3) 2009 H1N1:first M1_116(2), M1_136(3), M1_133(3), M1_130(1) 2009 H1N1:second M2_51(2), M2_36(2), M2_33(1), M2_32(3), M1_22(1), M1_118(3) Swine:first M1_111(3), M1_138, M1_185(3), M1_164(3), M1_200(3) Swine: second M1_3(3), M1_98(1),M1_170(3) Swine: third M1_94(1), M1_232(3), M2_68(3) Table 11. Top 20 MI site pairs in the NS segment with smallest P-values. 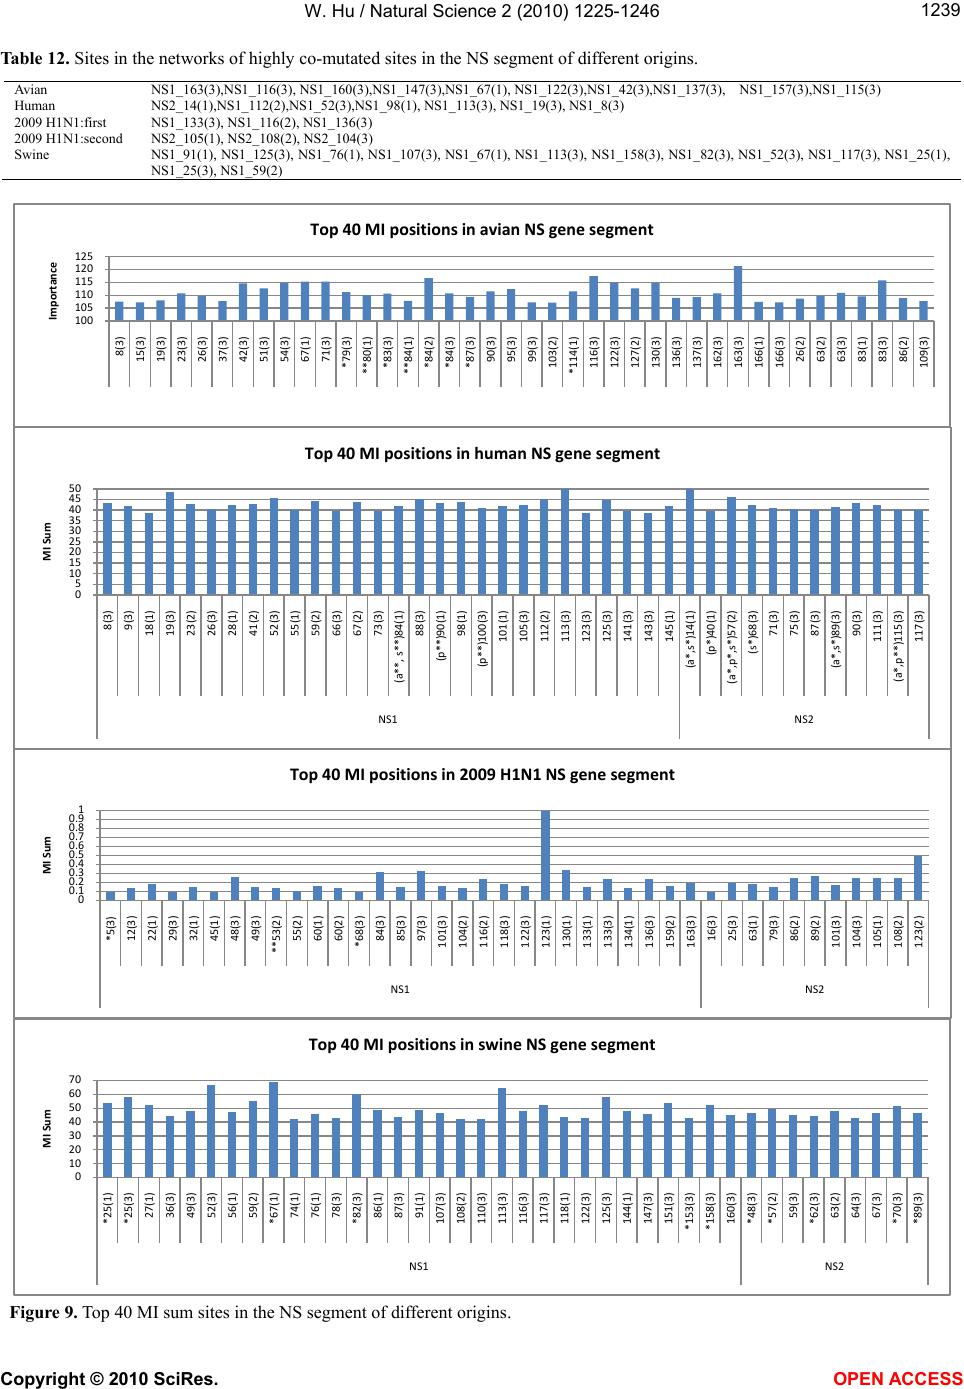 W. Hu / Natural Science 2 (2010) 1225-1246 Copyright © 2010 SciRes. OPEN ACCESS Table 12. Sites in the networks of highly co-mutated sites in the NS segment of different origins. NS1_163(3),NS1_116(3), NS1_160(3),NS1_147(3),NS1_67(1), NS1_122(3),NS1_42(3),NS1_137(3), NS1_157(3),NS1_115(3) NS2_14(1),NS1_112(2),NS1_52(3),NS1_98(1), NS1_113(3), NS1_19(3), NS1_8(3) NS1_133(3), NS1_116(2), NS1_136(3) NS2_105(1), NS2_108(2), NS2_104(3) NS1_91(1), NS1_125(3), NS1_76(1), NS1_107(3), NS1_67(1), NS1_113(3), NS1_158(3), NS1_82(3), NS1_52(3), NS1_117(3), NS1_25(1), NS1_25(3), NS1_59(2) Figure 9. Top 40 MI sum sites in the NS segment of different origins. 100 105 110 115 120 125 Importance Top 40 MI positions in avian NS gene segment 0 5 10 15 20 25 30 35 40 45 50 MI Sum Top 40 MI positions in human NS gene segment 0 0.1 0.2 0.3 0.4 0.5 0.6 0.7 0.8 0.9 1 MI Sum Top 40 MI positions in 2009 H1N1 NS gene segment 0 10 20 30 40 50 60 70 MI Sum Top 40 MI positions in swine NS gene segment 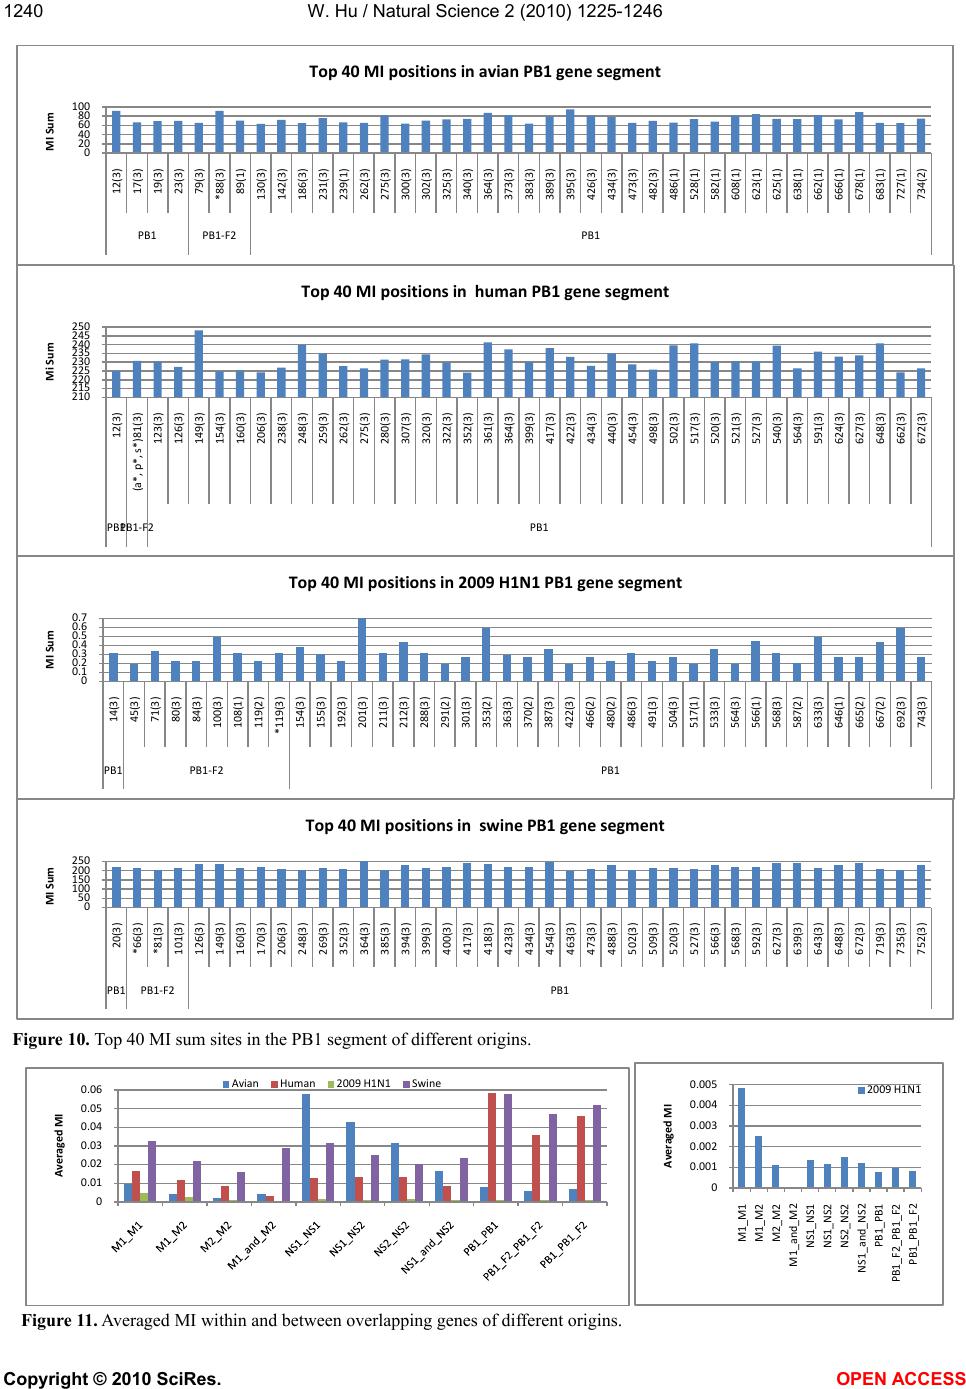 W. Hu / Natural Science 2 (2010) 1225-1246 Copyright © 2010 SciRes. OPEN ACCESS Figure 10. Top 40 MI sum sites in the PB1 segment of different origins. Figure 11. Averaged MI within and between overlapping genes of different origins. 0 20 40 60 80 100 MI Sum Top 40 MI positions in avian PB1 gene segment 210 215 220 225 230 235 240 245 250 Mi Sum Top 40 MI positions in human PB1 gene segment 0 0.1 0.2 0.3 0.4 0.5 0.6 0.7 MI Sum Top 40 MI positions in 2009 H1N1 PB1 gene segment 0 50 100 150 200 250 MI Sum Top 40 MI positions in swine PB1 gene segment 0 0.01 0.02 0.03 0.04 0.05 0.06 Averaged MI 0 0.001 0.002 0.003 0.004 0.005 Averaged MI 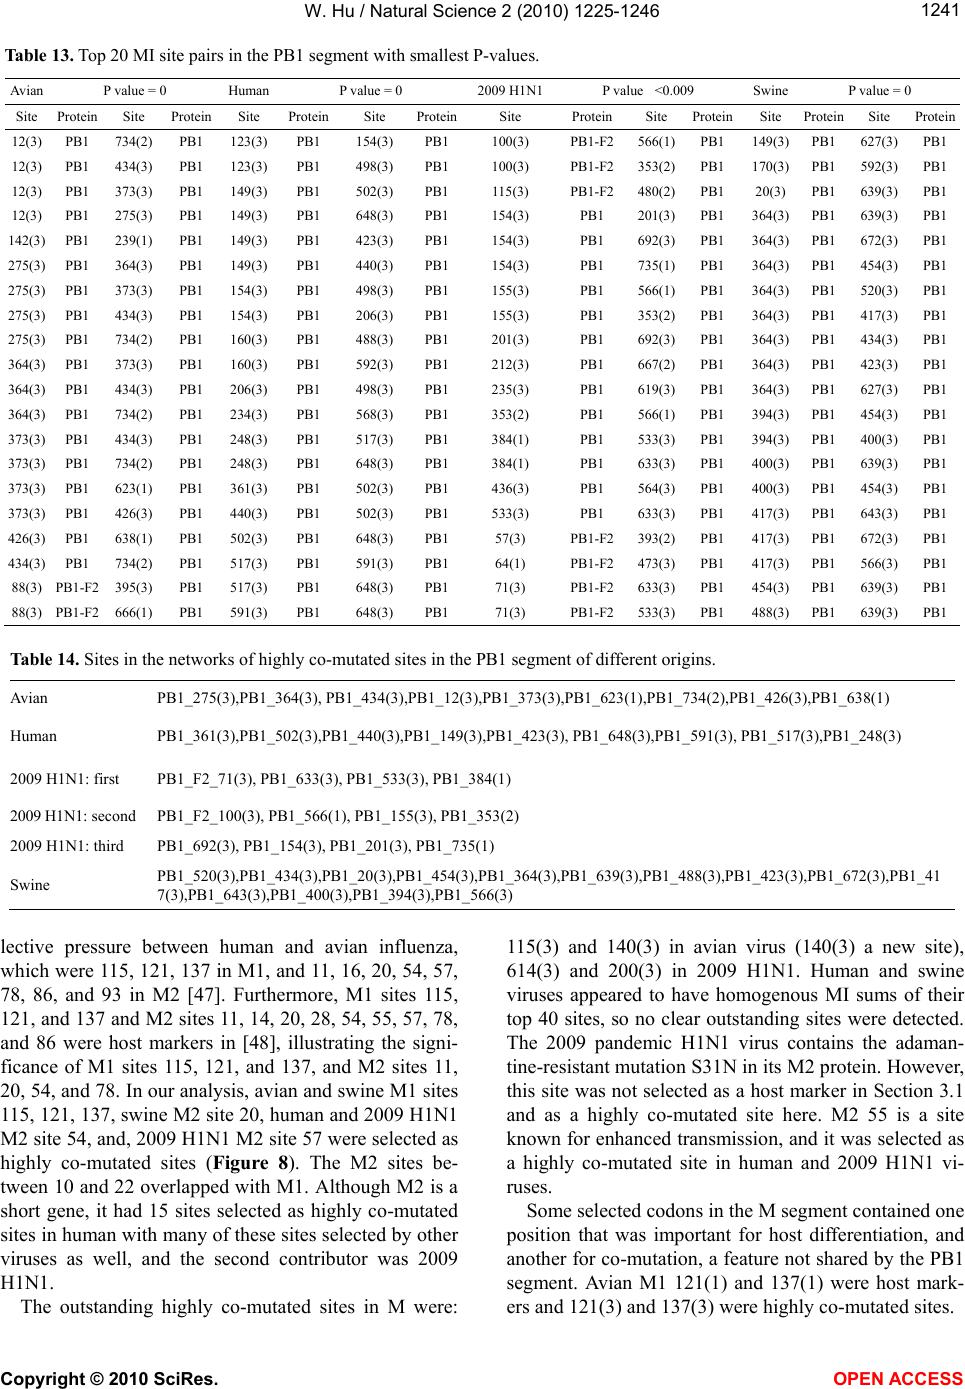 W. Hu / Natural Science 2 (2010) 1225-1246 Copyright © 2010 SciRes. OPEN ACCESS Table 13. Top 20 MI site pairs in the PB1 segment with smallest P-values. Avian P value = 0 Huma n P value = 0 2009 H1N1 P value <0.009 Swine P value = 0 Site Protein Site Protein Site Protein Site Protein Site Protein Site Protein Site Protein Site Protein 12(3) PB1 734(2) PB1 123(3) PB1 154(3) PB1 100(3) PB1-F2 566(1) PB1 149(3) PB1 627(3) PB1 12(3) PB1 434(3) PB1 123(3) PB1 498(3) PB1 100(3) PB1-F2 353(2) PB1 170(3) PB1 592(3) PB1 12(3) PB1 373(3) PB1 149(3) PB1 502(3) PB1 115(3) PB1-F2 480(2) PB1 20(3) PB1 639(3) PB1 12(3) PB1 275(3) PB1 149(3) PB1 648(3) PB1 154(3) PB1 201(3) PB1 364(3) PB1 639(3) PB1 142(3) PB1 239(1) PB1 149(3) PB1 423(3) PB1 154(3) PB1 692(3) PB1 364(3) PB1 672(3) PB1 275(3) PB1 364(3) PB1 149(3) PB1 440(3) PB1 154(3) PB1 735(1) PB1 364(3) PB1 454(3) PB1 275(3) PB1 373(3) PB1 154(3) PB1 498(3) PB1 155(3) PB1 566(1) PB1 364(3) PB1 520(3) PB1 275(3) PB1 434(3) PB1 154(3) PB1 206(3) PB1 155(3) PB1 353(2) PB1 364(3) PB1 417(3) PB1 275(3) PB1 734(2) PB1 160(3) PB1 488(3) PB1 201(3) PB1 692(3) PB1 364(3) PB1 434(3) PB1 364(3) PB1 373(3) PB1 160(3) PB1 592(3) PB1 212(3) PB1 667(2) PB1 364(3) PB1 423(3) PB1 364(3) PB1 434(3) PB1 206(3) PB1 498(3) PB1 235(3) PB1 619(3) PB1 364(3) PB1 627(3) PB1 364(3) PB1 734(2) PB1 234(3) PB1 568(3) PB1 353(2) PB1 566(1) PB1 394(3) PB1 454(3) PB1 373(3) PB1 434(3) PB1 248(3) PB1 517(3) PB1 384(1) PB1 533(3) PB1 394(3) PB1 400(3) PB1 373(3) PB1 734(2) PB1 248(3) PB1 648(3) PB1 384(1) PB1 633(3) PB1 400(3) PB1 639(3) PB1 373(3) PB1 623(1) PB1 361(3) PB1 502(3) PB1 436(3) PB1 564(3) PB1 400(3) PB1 454(3) PB1 373(3) PB1 426(3) PB1 440(3) PB1 502(3) PB1 533(3) PB1 633(3) PB1 417(3) PB1 643(3) PB1 426(3) PB1 638(1) PB1 502(3) PB1 648(3) PB1 57(3) PB1-F2 393(2) PB1 417(3) PB1 672(3) PB1 434(3) PB1 734(2) PB1 517(3) PB1 591(3) PB1 64(1) PB1-F2 473(3) PB1 417(3) PB1 566(3) PB1 88(3) PB1-F2 395(3) PB1 517(3) PB1 648(3) PB1 71(3) PB1-F2 633(3) PB1 454(3) PB1 639(3) PB1 88(3) PB1-F2 666(1) PB1 591(3) PB1 648(3) PB1 71(3) PB1-F2 533(3) PB1 488(3) PB1 639(3) PB1 Table 14. Sites in the networks of highly co-mutated sites in the PB1 segment of different origins. PB1_275(3),PB1_364(3), PB1_434(3),PB1_12(3),PB1_373(3),PB1_623(1),PB1_734(2),PB1_426(3),PB1_638(1) PB1_361(3),PB1_502(3),PB1_440(3),PB1_149(3),PB1_423(3), PB1_648(3),PB1_591(3), PB1_517(3),PB1_248(3) : first PB1_633(3), PB1_533(3), PB1_384(1) : second PB1_F2_100(3), PB1_566(1), PB1_155(3), PB1_353(2) : third PB1_692(3), PB1_154(3), PB1_201(3), PB1_735(1) PB1_520(3),PB1_434(3),PB1_20(3),PB1_454(3),PB1_364(3),PB1_639(3),PB1_488(3),PB1_423(3),PB1_672(3),PB1_41 7(3),PB1_643(3),PB1_400(3),PB1_394(3),PB1_566(3) lective pressure between human and avian influenza, which were 115, 121, 137 in M1, and 11, 16, 20, 54, 57, 78, 86, and 93 in M2 [47]. Furthermore, M1 sites 115, 121, and 137 and M2 sites 11, 14, 20, 28, 54, 55, 57, 78, and 86 were host markers in [48], illustrating the signi- ficance of M1 sites 115, 121, and 137, and M2 sites 11, 20, 54, and 78. In our analysis, avian and swine M1 sites 115, 121, 137, swine M2 site 20, human and 2009 H1N1 M2 site 54, and, 2009 H1N1 M2 site 57 were selected as highly co-mutated sites (Figure 8). The M2 sites be- tween 10 and 22 overlapped with M1. Although M2 is a short gene, it had 15 sites selected as highly co-mutated sites in human with many of these sites selected by other viruses as well, and the second contributor was 2009 H1N1. The outstanding highly co-mutated sites in M were: 115(3) and 140(3) in avian virus (140(3) a new site), 614(3) and 200(3) in 2009 H1N1. Human and swine viruses appeared to have homogenous MI sums of their top 40 sites, so no clear outstanding sites were detected. The 2009 pandemic H1N1 virus contains the adaman- tine-resistant mutation S31N in its M2 protein. However, this site was not selected as a host marker in Section 3.1 and as a highly co-mutated site here. M2 55 is a site known for enhanced transmission, and it was selected as a highly co-mutated site in human and 2009 H1N1 vi- ruse s. Some selected codons in the M segment contained one position that was important for host differentiation, and another for co-mutation, a feature not shared by the PB1 segment. Avian M1 121(1) and 137(1) were host mark- ers and 121(3) and 137(3) were highly co-mutated sites. 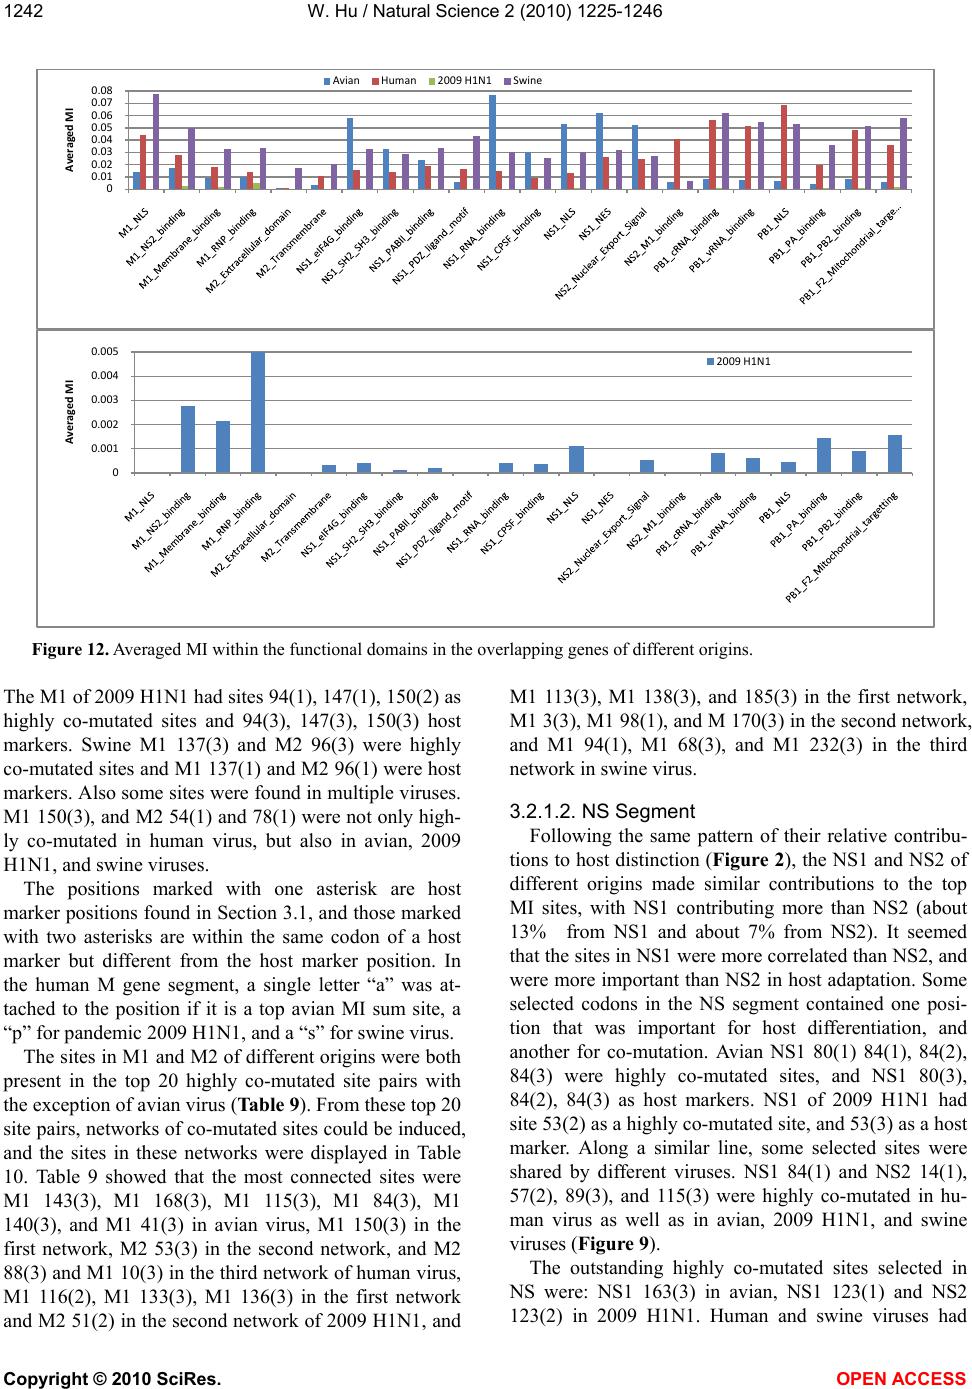 W. Hu / Natural Science 2 (2010) 1225-1246 Copyright © 2010 SciRes. OPEN ACCESS Figure 12. Averaged MI within the functional domains in the overlapping genes of different origins. The M1 of 2009 H1N1 had sites 94(1), 147(1), 150(2) as highly co-mutated sites and 94(3), 147(3), 150(3) host markers. Swine M1 137(3) and M2 96(3) were highly co-mutated sites and M1 137(1) and M2 96(1) were host markers. Also some sites were found in multiple viruses. M1 150(3), and M2 54(1) and 78(1) were not only high- ly co-mutated in human virus, but also in avian, 2009 H1N1, and swine viruses. The positions marked with one asterisk are host marker positions found in Section 3.1, and those marked with two asterisks are within the same codon of a host marker but different from the host marker position. In the human M gene segment, a single letter “a” was at- tached to the position if it is a top avian MI sum site, a “p” for pandemic 2009 H1N1, and a “s” for swine virus. The sites in M1 and M2 of different origins were both present in the top 20 highly co-mutated site pairs with the exception of avian virus (Table 9). From these top 20 site pairs, networks of co-mutated sites could be induced, and the sites in these networks were displayed in Table 10. Table 9 showed that the most connected sites were M1 143(3), M1 168(3), M1 115(3), M1 84(3), M1 140(3), and M1 41(3) in avian virus, M1 150(3) in the first network, M2 53(3) in the second network, and M2 88(3) and M1 10(3) in the third network of human virus, M1 116(2), M1 133(3), M1 136(3) in the first network and M2 51(2) in the second network of 2009 H1N1, and M1 113(3), M1 138(3), and 185(3) in the first network, M1 3(3), M1 98(1), and M 170(3) in the second network, and M1 94(1), M1 68(3), and M1 232(3) in the third network in swine virus. 3.2.1.2. NS Segment Following the same pattern of their relative contribu- tions to host distinction (Figure 2), the NS1 and NS2 of different origins made similar contributions to the top MI sites, with NS1 contributing more than NS2 (about 13% from NS1 and about 7% from NS2). It seemed that the sites in NS1 were more correlated than NS2, and were more important than NS2 in host adaptation. Some selected codons in the NS segment contained one posi- tion that was important for host differentiation, and another for co-mutation. Avian NS1 80(1) 84(1), 84(2), 84(3) were highly co-mutated sites, and NS1 80(3), 84(2), 84(3) as host markers. NS1 of 2009 H1N1 had site 53(2) as a highly co-mutated site, and 53(3) as a host marker. Along a similar line, some selected sites were shared by different viruses. NS1 84(1) and NS2 14(1), 57(2), 89(3), and 115(3) were highly co-mutated in hu- man virus as well as in avian, 2009 H1N1, and swine viruses (Figure 9). The outstanding highly co-mutated sites selected in NS were: NS1 163(3) in avian, NS1 123(1) and NS2 123(2) in 2009 H1N1. Human and swine viruses had 0 0.01 0.02 0.03 0.04 0.05 0.06 0.07 0.08 Averaged MI 0 0.001 0.002 0.003 0.004 0.005 Averaged MI  W. Hu / Natural Science 2 (2010) 1225-1246 Copyright © 2010 SciRes. OPEN ACCESS homogenous MI sums of their top 40 sites. In particular, the NS segment of 2009 H1N1 had NS1123 as its num- ber one site and carries a novel I123V mutation [49]. It was observed that avian NS1 had two clusters of highly co-mutated sites: the first located around codons 79 -- 90 that was in the eIF4G binding domain and the second around 162--166 that was in the SH2/SH3 binding do- main [48]. Mutation G92E in avian H5N1 NS1 is known to promote the inhibition of host immune responses, but was not selected as a highly co-mutated site. The amino acids at avian NS1 42 were a key determinant of viru- lence of H5N1 [46], and site 42 was selected as a highly co-mutated position in avian NS1 (Figure 9). Some selected sites in the NS segment overlapped with the host markers found in Section 3.1, which was in clear contrast to the PB1 segment. NS1 sites 22(1), 81(3), 84(2), 84(3), 215(1) (57(3) in NS2 numbering), and NS2 sites 60(1), 60(2), 70(1), 70(3), and 107(1) were host markers in [24,48]. NS1 sites 22(1) in 2009 H1N1, 84(1) in avian and human viruses, 84(2) in avian virus, 84(3) in avian and 2009 H1N1 viruses, NS2 57(2) in human and swine viruses, 70(3) in swine virus were se- lected as highly co-mutated sites. The NS2 sites between 12 and 74 overlapped with NS1. NS1 220 (63 in NS2 numbering) was an interesting site, since the NS1 genes of 2009 H1N1 and swine both had a stop codon (tga) at 220 but avian and human NS1 genes have cgg(R) at 220. Additionally, avian and swine NS2 site 63(2), avian and 2009 NS2 63(1) were selected as highly co-mutated sites in this study. The positions marked with one asterisk are host marker positions found in Section 3.1, and those marked with two asterisks are within the same codon of a host marker but different from the host marker position. In the human M gene segment, a single letter “a” was at- tached to the position if it is a top avian MI sum site, a “p” for pandemic 2009 H1N1, and a “s” for swine virus. The sites in NS1 and NS2 of different origins were both present in the top 20 highly co-mutated site pairs with the exception of swine virus (Table 11). From these top 20 site pairs, networks of co-mutated sites could be induced, and the sites in these networks were displayed in Table 12. Table 11 showed that the most connected sites were NS1 116(3) and NS1 163(3) in avian virus, NS1 112(2), NS1 19(3), NS1 98(1), and NS2 14(1) in human virus, NS1 116(2), NS1 133(3), NS1 136(3) in the first network and NS2 104(3), NS2 105(1), NS2 108(2) in the second network of 2009 H1N1, and NS1 25(3), NS1 52(3), NS1 67(1), and NS1 82(3) in swine virus. 3.2.1.3. PB1 Segment As the core subunit of viral polymerase of influenza, the regions at the start and end of PB1 (residues 1--25 and 600 -- 757) bind to PA and PB2 respectively. As in the case of host markers in Section 3.1, there was one highly co-mutated site selected in the PA binding region in human, 2009 H1N1, and swine viruses, and four in avian virus. However, avian and swine PB1 had a great number of sites selected (8 --10) in the PB2 binding re- gion. It was of note that swine PB1 had nine highly co-mutated sites in the range of codon 400 to codon 500, which were in the cRNA binding domain (Figure 10). The outstanding highly co-mutated sites in PB1 were: 149(3) in human virus, 201(3), 353(2), and 692(3) in 2009 H1N1. Avian and swine viruses had homogenous MI sums of their top 40 sites, so no clear outstanding sites were seen. Further, there were several sites in PB1 that were shared between viruses of different origins, which were significant sites as well. The PB1 segment seemed to have a much smaller overlap between host marker sites and highly co-mutated sites than the M and NS segments. PB1 81(3) (50(2) in PB1-F2 numbering) was the only site in the PB1-F2 re- gion selected as a highly co-mutated site in the human virus, and it also was selected in the swine virus. Further, PB1-F2 50(2) was a host marker in avian, 2009 H1N1 and swine viruses (Figure 4). Although there were sev- eral other key host markers in PB1-F2 such as 27(2) (58(3) in PB1 numbering) and 60(2) (91(3) in PB1 numbering) (Figure 4), they were not selected as highly co-mutated sites here. As in the case of host markers, PB1-F2 of 2009 H1N1 made a prominent contribution to the correlation of the whole PB1 segment with eight selected sites when compared to other species. PB1-F2 of 2009 H1N1 was more important in host distinction and was more correlated than that of avian, human, and swine viruses. The positions marked with one asterisk are host marker positions found in Section 3.1, and those marked with two asterisks are within the same codon of a host marker but different from the host marker position. In the human M gene segment, a single letter “a” was at- tached to the position if it is a top avian MI sum site, a “p” for pandemic 2009 H1N1, and a “s” for swine virus. The sites in PB1-F2 and PB1 of avian and 2009 H1N1 origins were both present in the top 20 highly co-mutated site pairs, but none of the selected sites of human and swine viruses contained the PB1-F2 sites (Table 13). From these top 20 site pairs, networks of co-mutated sites could be induced, and the sites in these networks were displayed in Table 14. Table 13 showed that the most connected sites were PB1 12(3), PB1 275(3), PB1 373(3), PB1 364(3), PB1 434(3), and PB1 734(2) in avian virus, PB1 149(3) and PB1 648(3) in human virus, PB1 533(3) and PB1 633(3) in the first network, PB1 353(2) and PB1 566(1) in the second net-  W. Hu / Natural Science 2 (2010) 1225-1246 Copyright © 2010 SciRes. OPEN ACCESS work , and PB1 154(3) in the third network of 2009 H1N1, and PB1 364(3), PB1 417(3), and PB1 454(3) in swine virus. 3.2.2. Correlations within and between Overlapping Genes in M, NS, and PB1 In addition to the highly co-mutated sites and site pairs in the overlapping genes found in Section 3.2.1, mutual information was employed to understand the co-mutations within and between these genes. The for- mer reflects the local correlation whereas the latter represents the global correlation of the genes. Our analy- sis indicated that the correlation within M1 was the highest, between M1 and M2 the second, and within M2 the least across avian, human, 2009 H1N1, and swine viruses. However, this correlation pattern was not ob- served in NS1 and NS2. PB1-F2 was found to be more correlated within itself than with PB1 of avian, human, and swine viruses, and exhibited similar correlations within itself and with PB1 of 2009 H1N1 (Figure 11). Furthermore, a similar analysis was applied to the co-mutations in the functional domains of a gene. It re- vealed that in general each gene had its own highest correlating domain (Figure 12). Among the various do- mains in M1, the highest correlating domain was NS2 binding in avian virus, NLS in human and swine viruses, RNP binding in 2009 H1N1. In M2, the co-mutation rate was higher in trans-membrane than extracellular domain in avian, human, 2009 H1N1, and swine viruses. In NS1, the highest correlating domain was RNA binding in avian virus, PABII binding in human virus, NLS in 2009 H1N1, and PDZ ligand motif in swine virus. In PB1, the highest correlating domain was PB2 binding in avian virus, NLS in human virus, PB1-F2 Mitochondrial targeting binding in 2009 H1N1, and cRNA binding in swine virus. There is only one functional domain exist- ing in PB1-F2, and the co-mutation rate was high in 2009 H1N1 and swine viruses relative to avian and hu- man viruses. 4. DISCUSSION The emergence of the pandemic 2009 H1N1 virus highlighted the importance of understanding the mole- cular basis for zoonotic influenza viruses to cross species barrier to infect humans. The segmented genome of in- fluenza makes it easy to generate a new virus through multiple reassortment with several influenza species, with 2009 H1N1 as the most recent example. Influenza viruses have several gene segments that encode multiple proteins, which provide ideal data for study of the inte- ractions between the proteins expressed from the same gene segment. The NS1 and PB1-F2 proteins are two key virulence factors of influenza. Through the integra- tive approach developed in this study, these two genes were investigated in the context of their native gene segments, NS and PB1 respectively, and of the interac- tion between their overlapping genes. Furthermore, the three stop codons in the PB1-F2 of 2009 H1N1 were identified as important host markers in 2009 H1H1. It is well known that the functions of a protein depend on the coordinated interactions among its residues. Mutations occurred at one site in a protein may need to be com- pensated by mutations at other sites, in order to maintain proper protein structure and function. While past re- search on overlapping genes targeted primarily the evo- lution of influenza, our current study focused on host markers and co-mutations in the overlapping genes of the M, NS, and PB1 segments, which revealed new in- sights that could not be gained through the study of these genes individually. 5. CONCLUSIONS We explored two aspects of the overlapping genes: host markers and co-mutations. In co-mutations, our analysis was further divided into local correlations of sites and site pairs in a gene and global correlations within and between genes. Besides the host markers discovered in the overlapping genes along with their relative significance calculated, Random Forests were able to predict the significance of the mutations at the three notable stop codons 12, 58, and 88 in the PB1-F2 gene of 2009 H1N1, revealing that the closer to the start of the gene the more important the mutation was. Also GC content analysis unexpectedly demonstrated that the full length PB1-F2 protein of 2009 H1N1 if all the three mutations occurred would function more like a swine protein than a human protein despite the human H3N2 origin of its PB1 segment. In the co-mutations of each gene segment, the top 40 highly co-mutated sites, top 20 highly co-mutated site pairs with P values less than 0.035, and networks of highly co-mutated sites were found. The correlation of the sites in M1 was higher than that of M2 of all the four viruses of avian, human, 2009 H1N1, and swine origins. However, the correlations of NS1 and NS2 of different origins varied. Finally, PB1-F2 was more correlated within itself than with PB1 of avian, human, and swine viruses, and exhibited simi- lar correlations within itself and with PB1 of 2009 H1N1. 6. ACKNOWLEDGEMENTS We thank Houghton College for its financial support. REFERENCES [1] Betakova, T. (2007) M2 Protein–a proton channel of  W. Hu / Natural Science 2 (2010) 1225-1246 Copyright © 2010 SciRes. OPEN ACCESS influenza a virus. Current Pharmaceutical Design, 13, 3231-3235. [2] Ma, C., Polishchuk, A.L., Ohigashi, Y., Stouffer, A.L., Schön, A., Magavern, E., Jing, X., Lear, J.D., Freire, E. and Lamb, R.A., (2009) Identification of the functional core of the influenza A virus A/M2 proton-selective ion channel. Proceedings of the National Academy of Sciences of the United States of America, 106, 12283- 12288. [3] Dua, Q.S., Wang, S.Q., Huang, R.B. and Chou, K.C. (2010) Computational 3D structures of drug-targeting proteins in the 2009-H1N1 influenza A virus. Chemical Physics Letters, 485, 191-195. [4] Pan, C., Cheung, B., Tan, S., Li, C., Li, L., et al. (2010) Genomic signature and mutation trend analysis of pan- demic (H1N1) 2009 influenza A virus. PLoS ONE, 5, e9549. [5] Jackson, D., Hossain, M.J., Hickman, D., Perez, D.R. and Lamb, R.A. (2008) A new influenza virus virulence de- terminant: The NS1 protein four C-terminal residues modulate pathogenicity. Proceedings of the National Academy of Sciences of the United States of America, 105, 4381-4386. [6] Soubies, S.M., Volmer, C., Croville, G., Loupias, J., Peralta, B., Costes, P., Lacroux, C., Guérin, J.L. and Volmer, R. (2010) Species-specific contribution of the four C-terminal amino acids of influenza A virus NS1 protein to virulence. The Journal of Virology, 84, 6733-6747. [7] Hale, B.G., Steel, J., Manicassamy, B., Medina, R.A., Ye, J., Hickman, D., Lowen, A.C., Perez, D.R. and García- Sastre, A. (2010) Mutations in the NS1 C-terminal tail do not enhance replication or virulence of the 2009 pan- demic H1N1 influenza A virus. The Journal of General Virology, 91, 1737-1742. [8] Long, J.X., Peng, D.X., Liu, Y.L., Wu, Y.T. and Liu, X.F. (2008). Virulence of H5N1 avian influenza virus en- hanced by a 15-nucleotide deletion in the viral nonstruc- tural gene. Virus Genes. 36, 471-478. [9] Seo, S.H., Hoffmann, E. and Webster, R.G. (2002) Le- thal H5N1 influenza viruses escape host anti-viral cyto- kine responses. Nature Medicine, 8, 950-954. [10] Henkel, M., Mitzner, D., Henklein, P., Meyer-Almes, F-J., Moroni, A. et al., (2010) The proapoptotic influenza A virus protein PB1-F2 forms a nonselective ion channel. PLoS ONE, 5, e 11112. [11] McAuley, J.L., Zhang, K. and McCullers, J.A. (2010) The effects of influenza a virus PB1-F2 protein on poly- merase activity are strain specific and do not impact pa- thogenesis. Journal of Virology, 84, 558-56 4. [12] Krejnusová, I. , Gocníková, H., By strick á, M., Bennink, H.J. and Russ, G. (2009) Antibodies to PB1-F2 protein are induced in response to influenza a virus infection . Archives of Virology, 154, 1599-1604 [13] Zell, R., Krumbholz, A., Eitner, A., Krieg, R., Halbhuber, K.J. and Wutzler, P. (2007) Prevalence of PB1-F2 of in- fluenza A viruses. Journal General Vi ro logy , 88, 536-546. [14] Conenello, G., Zamarin, D., Perrone, L., Tumpey, T., and Palese, P. (2007). A single mutation in the PB1-F2 of H5N1 (HK/97) and 1918 influenza A viruses contributes to increased virulence. PLoS Pathogens, 3, 1414-1421. [15] Mcauley, J., Hornung, F., Boy d, K., Smith, A., Mckeon, R., Bennink, J., Yewdell, J., and Mccullers, J. (2007) Ex- pression of the 1918 influenza A virus PB1-F2 enhances the pathogenesis of viral and secondary bacterial pneu- monia. Cell Host & Microbe, 2, 240-249. [16] Hai, R., Schmolke, M., Varga, Z.T., Manicassamy, B., Wang, T.T., Belser, J.A., Pearce, M.B., García-Sastre , A., Tumpey, T.M. and Palese, P. (2010) PB1-F2 expression by the 2009 pandemic H1N1 influenza virus has minimal impact on virulence in animal models. Journal Virology, 84, 4442-4450. [17] Opal, S. (2010) Understanding viral zoonoses: H1N1 influenza. Veterinary Medicine, 3, 131-135. [18] Pavesi, A. (2007) Pattern of nucleotide substitution in the overlapping nonstructural genes of influenza A virus and implication for the genetic diversity of the H5N1 subtype. Gene, 402, 28-34. [19] Campitelli, L., Ciccozzi, M., Salemi, M., Taglia, F., Bo- ros, S., et al. (2006) H5N1 influenza virus evolution: A comparison of different epidemics in birds and humans (1997-2004). Journal of General Virolo gy, 87, 955-960. [20] Obenauer, J.C., Denson, J., Mehta, P.K., Su, X., Mukati- ra, S., et al. (2006) Large-scale sequence analysis of avian influenza isolates. Science, 311, 1576-1580. [21] Li, K.S., Guan, Y., Wang, J., Smith, G.J., Xu, K.M., et al. (2004) Genesis of a highly pathogenic and potentially pandemic H5N1 influenza virus in eastern Asia. Nature, 430, 209-213. [22] Sabath, N., Landan, G. and Graur, D. (2008) A Method for the simultaneous estimation of selection intensities in overlapping genes. PLoS ONE, 3, e3996. [23] Hu, W. (2010) Novel host markers in the 2009 pandemic H1N1 influenza A virus. Journal of Biomedical Science and Engineering, 3, 584-601. [24] Hu, W. (2010) Nucleotide host markers in the influenza A viruses. Journal of Biomedical Science and Engineer- ing, 3, 684-699. [25] Katoh, K., Kuma, K., Toh, H. and Miyata, T. (2005) MAFFT version 5: Improvement in accuracy of multiple sequence alignment. Nucleic Acids Research, 33, 511- 518. [26] MacKay, D. (2003) Information theory, inference, and learning algorithms. Cambridge University Press, UK. [27] Breiman, L., (2001) Random forests. Machine Learning, 45, 5-32. [28] Díaz-Uriarte, R. and Alvarez de Andrés, S. (2006) Gene selection and classification of microarray data using random forest. BMC Bioinformatics, 7, 3. [29] Kellie, J.A. and Ryan, V.K. (2008) Empirical characteri- zation of random forest variable importance measures. Computational Statistics and Data Analysis, 52, 2249- 2260. [30] Reif, D.M., Motsinger, A.A., McKinney, B.A., Crowe, J.E., Moore, J.H. (2006) Feature Selection using a ran- dom forests classifier for the integrated analysis of mul- tiple data type. Proceedings of 2006 IEEE Symposium on Computational Intelligence and Bioinformatics and Computational Biology, CIBCB '06, 1-8. [31] Pablo, M.G., Furlanellob, C., Biasiolia, F. and Gasperia, F. (2006) Recursive feature elimination with random forest for PTR-MS analysis of agroindustrial products. Chemometrics and Intelligent Laboratory Systems, 83,  W. Hu / Natural Science 2 (2010) 1225-1246 Copyright © 2010 SciRes. OPEN ACCESS 83-90. [32] Bjoern, H.M., Kelm, B.M., Masuch, R., Himmelreich, U., Bachert, P., Petrich, W. and Hamprecht, F.A. (2009) A comparison of random forest and its Gini importance with standard chemometric methods for the feature se- lection and classification of spectral data. BMC Bioin- formatics, 10, 213. [33] Gao, D., Zhang, Y.X., Zhao, Y.H. (2009) Random forest algorithm for classification of multi-wavelength data. Research in Astronomy and Astrophysics, 9, 220-226. [34] Hu, W. (2009) Identifying predictive markers of chemo- sensitivity of breast cancer with random forests. Journal of Biomedical Science and Engineering, 3, 59-64. [35] Garten, R.J., Davis, C.T., Russell, C.A., Shu, B., et al., (2009) Antigenic and genetic characteristics of swine-origin 2009 A(H1N1) influenza viruses circulating in humans. Science, 325, 197-201. [36] Ozawa, M., Maeda, J., Iwatsuki-Horimoto, K., Watanabe, S., Goto, H., Horimoto, T. and Kawaoka , Y. (2009) Nuc- leotide sequence requirements at the 5' end of the in- fluenza A virus M RNA segment for efficient virus repli- cation. J Virol. 83(7):3384-8. [37] Wu B, Wang C M, Dong G Y, et al. (2009) Molecular characterization of H1N1 influenza A viruses from hu- man cases in North America. Chinese Sciences Bulletin, 54, 2179-2192 [38] Liu, T. and Ye, Z.P. (2005) Attenuating mutations of the matrix gene of influenza A/WSN/33 Virus. Journal of Virology, 79, 1918-1923. [39] Dey de, V.M., Sheu, T.G., Trujillo, A.A., Oko- mo-Adhiambo, M., Garten, R., Klimov, A.I., Gubareva, L.V. (2010) Detection of molecular markers of drug re- sistance in 2009 pandemic influenza A (H1N1) viruses by pyrosequencing. Antimicrob Agents Chemother, 54, 1102-1110. [40] Pan, C.G. and Jian g, S.B. (2009) E14-F55 combination in M2 protein: A putative molecular determinant respon- sible for swine-origin influenza A virus transmission in humans. PLoS Currents Influenza, 29, RRN1044. [41] Sabath, N., Landan, G. and Graur, D. (2008) A method for the simultaneous estimation of selection intensities in overlapping genes. PLoS ONE, 3, e3996. [42] Lin, D., Lan, J. and Zhang, Z. (2007) Structure and func- tion of the NS1 protein of influenza A virus. Acta Bio- chim Biophys Sin (Shanghai), 39, 155-162. [43] Suwannakhon, N., Pookorn, S., Sanguansermsri, D., Chamnanpood, C., Chamnanpood, P., Wongvilairat, R., Pongcharoen, S., Niumsup, P.R., Kunthalert, D. and Sanguansermsri, P. (2008) Genetic characterization of nonstructural genes of H5N1 avian influenza viruses iso- lated in Thailand in 2004-2005. Southeast Asian Journal of Tropical Medicine and Public Health, 39, 837-847. [44] Scalera, N.M. and Mossad, S.B. (2009) The first pan- demic of the 21st century: A review of the 2009 pan- demic variant influenza A (H1N1) virus. Postgraduate Medicine, 121, 43-47. [45] Gibbs, A.J., Armstrong, J.S., Downie, J.C. (2009) From where did the 2009 'swine-origin' influenza A virus (H1N1) emerge? Journal of Virology, 6, 207. [46] Jiao, P.R., Tian, G.B., Li, Y.B., Deng, G.H., Jiang, Y.P., Liu, C., Liu, W.L., Bu, Z.G., Kawaoka, Y. and Chen, H.L. (2008) A single-amino-acid substitution in the NS1 protein changes the pathogenicity of H5N1 avian in- fluenza viruses in mice. Journal of Virology , 82, 1146-1154. [47] Betakova1, T. and Hay, A.J. (2009) Stability and func- tion of the influenza A virus M2 ion channel protein is determined by both extracellular and cytoplasmic do- mains. Journal Archives of Virology, 154, 147-151. [48] Miotto, O., Heiny, A.T., Albrecht, R., García-Sastre, A., Tan, T.W., August, J.T. and Brusic, V. (2010) Com- plete-proteome mapping of human influenza a adaptive mutations: Implications for human transmissibility of zoonotic strains. PLoS ONE, 5, e9025. [49] Maurer-Stroh, S., Raphael, T.C.L., Eisenhaber, F., Lin C., Shiau, P. P. and Raymond, T.P.L. (2010) A new common mutation in the hemagglutinin of the 2009 (H1N1) in- fluenza A virus. PLoS Currents Influenza.
|