 Low Carbon Economy, 2013, 4, 71-79 doi:10.4236/lce.2013.42008 Published Online June 2013 (http://www.scirp.org/journal/lce) Copyright © 2013 SciRes. LCE 71 China’s New Energy Passenger Vehicle Development Scenario Analysis Based on Life Time Cost Modelling Xunmin Ou 1,2* , Qian Zhang 1,2 , Xu Zhang 1,2 , Xiliang Zhang 1,2 1 Institute of Energy, Environment and Economy, Tsinghua University, Beijing, China; 2 China Automotive Energy Research Center, Tsinghua University, Beijing, China. Email: * ouxm@tsinghua.edu.cn Received March 8 th , 2013; revised April 8 th , 2013; accepted May 8 th , 2013 Copyright © 2013 Xunmin Ou et al. This is an open access article distributed under the Creative Commons Attribution License, which permits unrestricted use, distribution, and reproduction in any medium, provided the original work is properly cited. ABSTRACT Based on the analysis on the development trend of vehicle technology, vehicle price, vehicle fuel economy and fuel supply price, the new energy vehicle (NEV) passenger car development scale is projected on different scenario with the application of life time cost model. Three scenarios are set to find electric vehicle (EV) and fuel cell vehicle (FCV) de- velopment potential in future to their pessimistic and optimistic assumptions in China. The results are demonstrated: 1) NEV development needs a long time due to high initial cost for vehicle buyer; 2) EV will develop quickly under if there is quick development of battery technology; and 3) FCV can only develop in a large scale in 20 - 30 years even in the optimistic scenario. Keywords: Life Time Cost; New Energy Vehicle; Scenario Analysis; China 1. Introduction As the energy security and Greenhouse gas (GHG) emis- sion issues are becoming urgent in transport sector in China, new energy vehicle (NEV) is considered as one of best options of reducing petroleum and GHG in this sec- tor in China from the long term. NEV development has been supported by a series of initiatives in China. But the scale of NEV is still on the small level and the enthusiasm of vehicle buyers to NEV is still low due to some reasons and one of them is the high cost issue. Generally, compared to the conventional gasoline and diesel vehicle, the NEV will consume the owner lower fuel costs and lower maintenance and repair costs, but in the current stage, the higher initial costs and higher in- surance costs have been unbeatable evils that eat up buy- ers’ plan for NEV buying and holding [1]. Electric vehicles and FCVs represent an important in- novation in new energy vehicle technologies. As with other technological innovations, the promotion of EV and FCV require three stages, and their penetration rate dis- plays an S-shaped curve [2]. So it is urgent to find: 1) what are both the real current and projected situation of buying and operating NEVs from the perspective of their lifetime; and 3) some useful options to improve the situation of high cost for NEVs and promote their large scale development as soon as possible. In this paper, the lifetime costs of the pathways of new energy vehicles are assessed by the application of the life-cycle cost (LCC) model with the conventional gaso- line vehicle as baseline vehicle to be compared; the fu- ture situations are estimated in different scenarios and some key factors affecting the final results are assumed and tested; At last, some concluding remarks are given on some discussion. 2. Methodology 2.1. Framework of LCC Module For the vehicle owner, the total cost (TC) of owning and operating one certain type of vehicle is the sum of two part of sub-section: initial cost (IC) of buying the vehicle and all other operating-related cost (OC, including all types of tax and fees, fuel cost, inspection and mainte- nance, repair cost and others) which is related to operate the vehicle, as the following equation (Equation (1)) shows [3,4]. TC=ICOC (1) * Corresponding author.  China’s New Energy Passenger Vehicle Development Scenario Analysis Based on Life Time Cost Modelling Copyright © 2013 SciRes. LCE 72 Here we can use manufacturer’s suggested retail price (MSRP) as one of alternative options of the IC of vehicle. And as Equation (2) shows, the OC of vehicle can be divided into two parts which are energy-related cost (EC) and non-energy-related cost (NEC). OCECNEC (2) 2.2. Calculation Methods from the Owner Perspective For IC of EV and FCV, they are calculated by adding the additional cost, which is price premium actually, to the IC of baseline vehicle pathway which is conventional gasoline vehicle in this article. The compared vehicles are based on similar transportation capacity. For the fulltime EC, it is calculated by multiplying the energy cost per unit and the energy consumption amount during the fulltime. For the fulltime NEC category, all the operating and maintenance costs excluding energy are categorized, in- cluding registration, tax, insurance, maintenance, repair, tires, lubricant oil, safety- and emission-inspection fees, parking, and tolls. Detailed and actual data in these specific categories are collected and analyzed to get the scientific and cor- rect results for LCC of vehicle. 3. Key Assumption and Data 3.1. Key Assumptions for Vehicle 3.1.1. Segments of Passenger Vehicle The segments were divided for passenger vehicle (PV) in the model:According to displacement of engine, PV is further divided into Micro, Small, Medium and Large segments as Table 1 shows. 3.1.2. VKT of Passenger Vehicle Here it assumes VKT of Micro-size vehicle drops rapidly, because more Micro cars become the second car of a family or the special car for commuting in working days, hence the average travel times or travel distance each trip will drop quickly [5-7], as Table 2 shows. 3.1.3. Future Cases for Vehicle and Battery Technology Two cases are also set up for future scenario of energy Table 1. Passenger vehicle division. Division Displacement of engine Micro <1.0 L Small 1 ~ 1.6 L Medium 1.6 - 2.5 L Large >2.5 L unit cost and the corresponding energy efficiency of ve- hicle and power battery cost reduction. In the base case, fuel price will have a moderate increasing rate and fuel economy of vehicle will be improved in a moderate trend correspondingly, and power battery cost will be de- creased slowly; In the alternative case, fuel price will have a quick increasing rate and fuel economy of vehicle will be improved in a tremendous trend correspondingly, and power battery cost will be decreased quickly. 3.2. Key Data for MSRP of Vehicle 3.2.1. ICE Vehicle In 2010, the MSRPs of vehicle in the four sub-segments are listed in Table 3. It is estimated that the conventional car MSRP will not be changed for many years to 2050 though the technology will be improved but the feed- stock and materials will encounter the increasing supply price. Here it presumes MRSP of ICE PVs keeps steady by 2050, based on the constant prices of 2010. There are price-up reasons: 1) Labor and material cost will further rise in China; while 2) HEV and other new technology to improve FE will cost more, as well as stricter emission control. The Price-down reason is China Auto market will further expand to bring up advantages of scale up to reduce vehicle cost. 3.2.2. EV For EV, the additional cost to the baseline car’ MSRP is majorly the cost of battery system, but the difference between ICE vehicle and EV without battery system is also factor for the final MSRP. Here the mark-up costs are included for all the vehicles. The battery system cost for EV will be different in fu- ture between Base case and Alternative case, as Table 4 shows. Table 2. VMT of passenger vehicle (km/year). 2010 2020 2030 2040 2050 Micro 14,00012,00010,000 8000 6000 Small 16,00014,00013,000 12,00011,000 Medium 18,00016,00014,000 13,00012,000 Large 20,00018,00015,000 14,00013,000 Table 3. MRSP of ICE PVs. MRSP (RMB) Micro 35,000 Small 120,000 Medium 223,700 Large 535,400 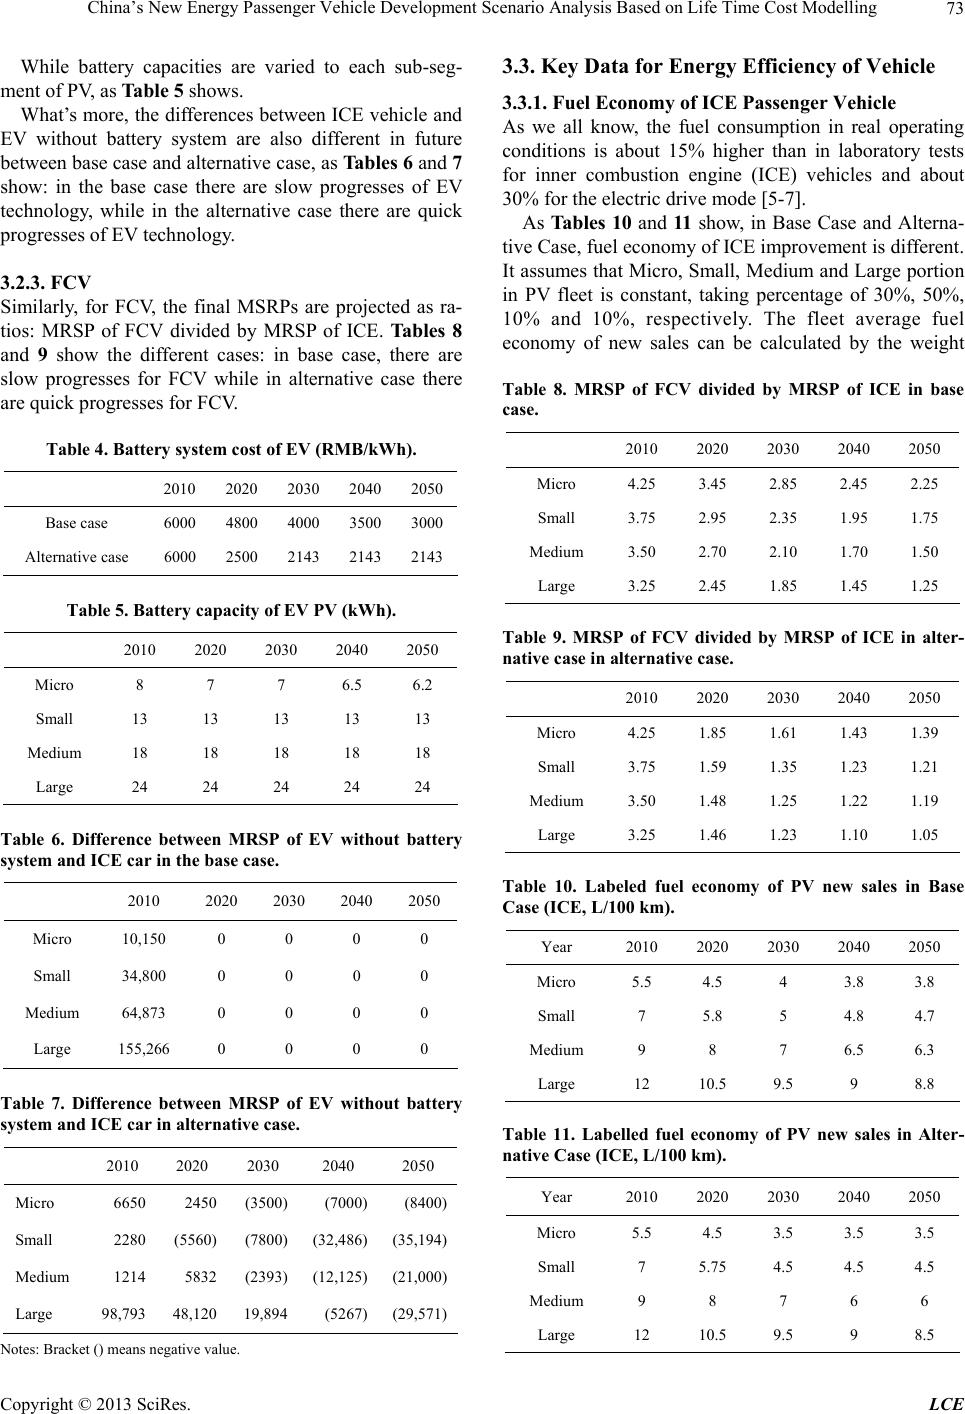 China’s New Energy Passenger Vehicle Development Scenario Analysis Based on Life Time Cost Modelling Copyright © 2013 SciRes. LCE 73 While battery capacities are varied to each sub-seg- ment of PV, as Table 5 shows. What’s more, the differences between ICE vehicle and EV without battery system are also different in future between base case and alternative case, as Tables 6 and 7 show: in the base case there are slow progresses of EV technology, while in the alternative case there are quick progresses of EV technology. 3.2.3. FCV Similarly, for FCV, the final MSRPs are projected as ra- tios: MRSP of FCV divided by MRSP of ICE. Tables 8 and 9 show the different cases: in base case, there are slow progresses for FCV while in alternative case there are quick progresses for FCV. Table 4. Battery system cost of EV (RMB/kWh). 2010 2020 2030 2040 2050 Base case 6000 4800 4000 3500 3000 Alternative case 6000 2500 2143 2143 2143 Table 5. Battery capacity of EV PV (kWh). 2010 2020 2030 2040 2050 Micro 8 7 7 6.5 6.2 Small 13 13 13 13 13 Medium 18 18 18 18 18 Large 24 24 24 24 24 Table 6. Difference between MRSP of EV without battery system and ICE car in the base case. 2010 2020 2030 2040 2050 Micro 10,150 0 0 0 0 Small 34,800 0 0 0 0 Medium 64,873 0 0 0 0 Large 155,266 0 0 0 0 Table 7. Difference between MRSP of EV without battery system and ICE car in alternative case. 2010 2020 2030 2040 2050 Micro 6650 2450 (3500) (7000) (8400) Small 2280 (5560) (7800) (32,486) (35,194) Medium 1214 5832 (2393) (12,125) (21,000) Large 98,793 48,120 19,894 (5267) (29,571) Notes: Bracket () means negative value. 3.3. Key Data for Energy Efficiency of Vehicle 3.3.1. Fuel Economy of ICE Passenger Vehicle As we all know, the fuel consumption in real operating conditions is about 15% higher than in laboratory tests for inner combustion engine (ICE) vehicles and about 30% for the electric drive mode [5-7]. As Tables 10 and 11 show, in Base Case and Alterna- tive Case, fuel economy of ICE improvement is different. It assumes that Micro, Small, Medium and Large portion in PV fleet is constant, taking percentage of 30%, 50%, 10% and 10%, respectively. The fleet average fuel economy of new sales can be calculated by the weight Table 8. MRSP of FCV divided by MRSP of ICE in base case. 2010 2020 2030 2040 2050 Micro 4.25 3.45 2.85 2.45 2.25 Small 3.75 2.95 2.35 1.95 1.75 Medium 3.50 2.70 2.10 1.70 1.50 Large 3.25 2.45 1.85 1.45 1.25 Table 9. MRSP of FCV divided by MRSP of ICE in alter- native case in alternative case. 2010 2020 2030 2040 2050 Micro 4.25 1.85 1.61 1.43 1.39 Small 3.75 1.59 1.35 1.23 1.21 Medium 3.50 1.48 1.25 1.22 1.19 Large 3.25 1.46 1.23 1.10 1.05 Table 10. Labeled fuel economy of PV new sales in Base Case (ICE, L/100 km). Year 2010 2020 2030 2040 2050 Micro 5.5 4.5 4 3.8 3.8 Small 7 5.8 5 4.8 4.7 Medium 9 8 7 6.5 6.3 Large 12 10.5 9.5 9 8.8 Table 11. Labelled fuel economy of PV new sales in Alter- native Case (ICE, L/100 km). Year 2010 2020 2030 2040 2050 Micro 5.5 4.5 3.5 3.5 3.5 Small 7 5.75 4.5 4.5 4.5 Medium 9 8 7 6 6 Large 12 10.5 9.5 9 8.5 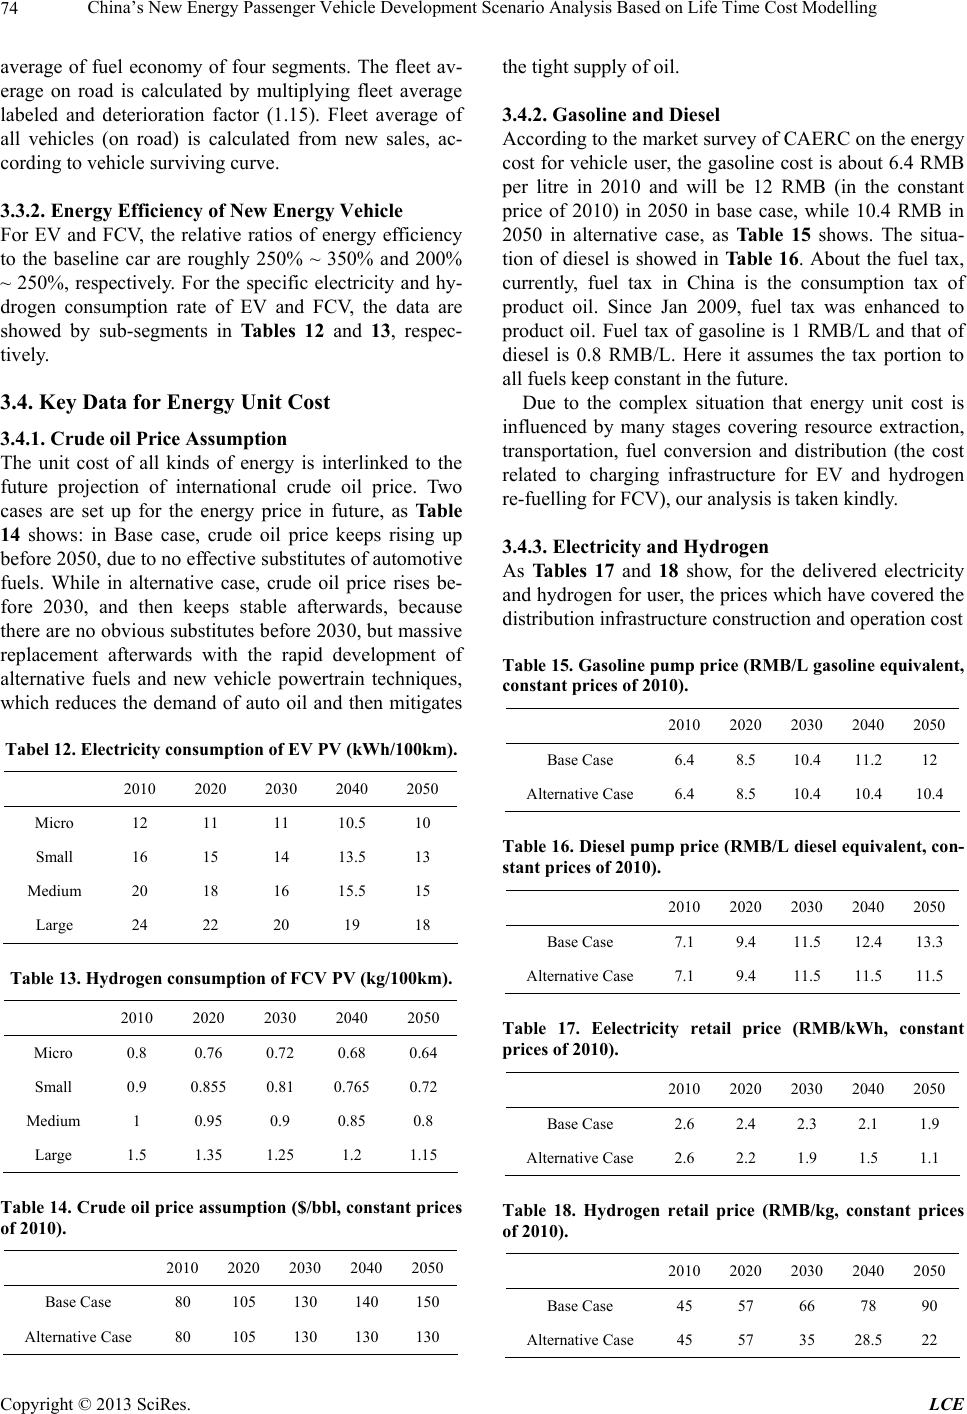 China’s New Energy Passenger Vehicle Development Scenario Analysis Based on Life Time Cost Modelling Copyright © 2013 SciRes. LCE 74 average of fuel economy of four segments. The fleet av- erage on road is calculated by multiplying fleet average labeled and deterioration factor (1.15). Fleet average of all vehicles (on road) is calculated from new sales, ac- cording to vehicle surviving curve. 3.3.2. Energy Efficiency of New Energy Vehicle For EV and FCV, the relative ratios of energy efficiency to the baseline car are roughly 250% ~ 350% and 200% ~ 250%, respectively. For the specific electricity and hy- drogen consumption rate of EV and FCV, the data are showed by sub-segments in Tables 12 and 13, respec- tively. 3.4. Key Data for Energy Unit Cost 3.4.1. Crude oil Price Assumption The unit cost of all kinds of energy is interlinked to the future projection of international crude oil price. Two cases are set up for the energy price in future, as Table 14 shows: in Base case, crude oil price keeps rising up before 2050, due to no effective substitutes of automotive fuels. While in alternative case, crude oil price rises be- fore 2030, and then keeps stable afterwards, because there are no obvious substitutes before 2030, but massive replacement afterwards with the rapid development of alternative fuels and new vehicle powertrain techniques, which reduces the demand of auto oil and then mitigates Tabel 12. Electricity consumption of EV PV (kWh/100km). 2010 2020 2030 2040 2050 Micro 12 11 11 10.5 10 Small 16 15 14 13.5 13 Medium 20 18 16 15.5 15 Large 24 22 20 19 18 Table 13. Hydrogen consumption of FCV PV (kg/100km). 2010 2020 2030 2040 2050 Micro 0.8 0.76 0.72 0.68 0.64 Small 0.9 0.855 0.81 0.765 0.72 Medium 1 0.95 0.9 0.85 0.8 Large 1.5 1.35 1.25 1.2 1.15 Table 14. Crude oil price assumption ($/bbl, constant prices of 2010). 2010 2020 2030 2040 2050 Base Case 80 105 130 140 150 Alternative Case 80 105 130 130 130 the tight supply of oil. 3.4.2. Gasoline and Diesel According to the market survey of CAERC on the energy cost for vehicle user, the gasoline cost is about 6.4 RMB per litre in 2010 and will be 12 RMB (in the constant price of 2010) in 2050 in base case, while 10.4 RMB in 2050 in alternative case, as Table 15 shows. The situa- tion of diesel is showed in Table 16. About the fuel tax, currently, fuel tax in China is the consumption tax of product oil. Since Jan 2009, fuel tax was enhanced to product oil. Fuel tax of gasoline is 1 RMB/L and that of diesel is 0.8 RMB/L. Here it assumes the tax portion to all fuels keep constant in the future. Due to the complex situation that energy unit cost is influenced by many stages covering resource extraction, transportation, fuel conversion and distribution (the cost related to charging infrastructure for EV and hydrogen re-fuelling for FCV), our analysis is taken kindly. 3.4.3. Electricity and Hydrogen As Tables 17 and 18 show, for the delivered electricity and hydrogen for user, the prices which have covered the distribution infrastructure construction and operation cost Table 15. Gasoline pump price (RMB/L gasoline equivalent, constant prices of 2010). 20102020 2030 20402050 Base Case 6.4 8.5 10.4 11.2 12 Alternative Case 6.4 8.5 10.4 10.4 10.4 Table 16. Diesel pump price (RMB/L diesel equivalent, con- stant prices of 2010). 20102020 2030 20402050 Base Case 7.1 9.4 11.5 12.4 13.3 Alternative Case 7.1 9.4 11.5 11.5 11.5 Table 17. Eelectricity retail price (RMB/kWh, constant prices of 2010). 20102020 2030 20402050 Base Case 2.6 2.4 2.3 2.1 1.9 Alternative Case 2.6 2.2 1.9 1.5 1.1 Table 18. Hydrogen retail price (RMB/kg, constant prices of 2010). 2010 2020 2030 2040 2050 Base Case 45 57 66 78 90 Alternative Case 45 57 35 28.5 22  China’s New Energy Passenger Vehicle Development Scenario Analysis Based on Life Time Cost Modelling Copyright © 2013 SciRes. LCE 75 is 2.6 and 1.9 RMB per kWh of electricity in 2010 and 2050 respectively in base case, and 45 and 90 RMB per kg of hydrogen in 2010 and 2050 respectively in base case. The situations for both the electricity and hydrogen are different in alternative case. Here we assume that in 2010 electricity charge station infrastructure construction and operation cost is nearly equal to the net electricity price to general user but in 2050 this ratio will change to about 0.5. 3.5 Key Data for NEC Based on CAERC’s research [4,8], for gasoline car the total non-energy cost is half of MSRP during the whole life time (NEC = MSRP * 50%), similar to the current situation in US. But for EV, the total lifetime NEC is roughly equal to the MSRP in 2010 and the situation will be similar to that of gasoline car. Some details are following: For gasoline vehicle, dur- ing buying stage (NEC = MSRP * 10%, including buying tax/VAT tax/registration/first time check fee); during driving stage (NEC = MSRP * 40%). NEC of EV is heav- ily depended on the life and replacing cost of battery. Here we can only get the expert opinion due to the lack of such kind of official or published data. For EV, due to battery replacement once for life time, the situation is varied from that of gasoline vehicle in 2010; but with the technology improvement to 2020, especial with the longer battery life which can be as long as the vehicle, its total non-energy cost will be half of MSRP just as gaso- line vehicle. For FCV, the total non-energy cost is half of MSRP during the whole life time (NEC = MSRP * 50%). 4. Scenario Design and Results 4.1. Scenario Design This section presents three scenarios for the future de- velopment of China’s new energy vehicle technology: a Reference Scenario; a scenario for developing electric vehicles (EV); and a scenario for developing fuel-cell vehicles (FCV). As Table 19 shows, each scenario has the assumptions combined for fuel economy of conventional vehicle, ad- ditional cost for new energy vehicle and energy unit price. 4.2. Results for Reference Scenario 4.2.1. EV Development Under the Reference Scenario, the cost of the battery, motor, and electronic control of pure electric vehicle un- dergoes only a slow reduction. A comparison of the inte- grated costs of electric passenger vehicles and petro- leum-based passenger vehicles is presented in Figure 1. Table 19. the assumptions for China’s new energy vehicle technology development scenario. Reference Scenario EV Scenario FCV Scenario Fuel economy of PV Base case Alternative case Base case MRSP difference between EV without battery system and ICE Base case Alternative case Base case Cost of EV battery systemBase case Alternative case Base case MRSP difference between FCV and ICE Base case Base case Alternative case Retail price of gasoline, diesel, electricity, hydrogen and other alternative fuels Base case Alternative case Alternative case Basically, Micro electric passenger vehicles cannot compete with petroleum-based passenger vehicles before 2040. Since pure electric mode vehicles will be unable to match the driving range of medium-sized and large pas- senger vehicles, plug-in hybrid electric vehicles (PHEV) and extended-range electric vehicles (EREV) will have to be employed. However, their integrated costs will still be higher than those of petroleum-based passenger vehicles. 4.2.2. Fuel-Cell Vehicles Development Under the reference scenario, the cost of fuel-cell vehicle technologies falls slowly. The integrated cost is unable to compete with that of petroleum-based vehicles before 2050, as Figure 2 shows. 4.3. Results for EV Development Scenario Under the scenario of developing electric vehicles, the R&D, demonstration, and promotion of battery, motor and electronic control technologies of pure electric vehi- cles achieve major breakthroughs in the near and me- dium term, and it is supposed that the associated cost will quickly fall. A comparison of the integrated cost of micro pure electric passenger vehicles and petroleum-based passen- ger vehicles is shown in Figure 3. Basically, micro elec- tric passenger vehicles are able to compete with petro- leum-based passenger vehicles in around 2025; micro electric passenger vehicles then go into a phase of rapid development as small pure electric passenger vehicles. For medium-size and large passenger vehicles, PHEVs and EREVs should be used, and their integrated cost can equal that of petroleum-based passenger vehicles by 2025; they will then go into a phase of rapid develop- ment. The EV PV penetration of new sales by sub-segments in EV Scenario are showed in Table 20 and Figure 4. 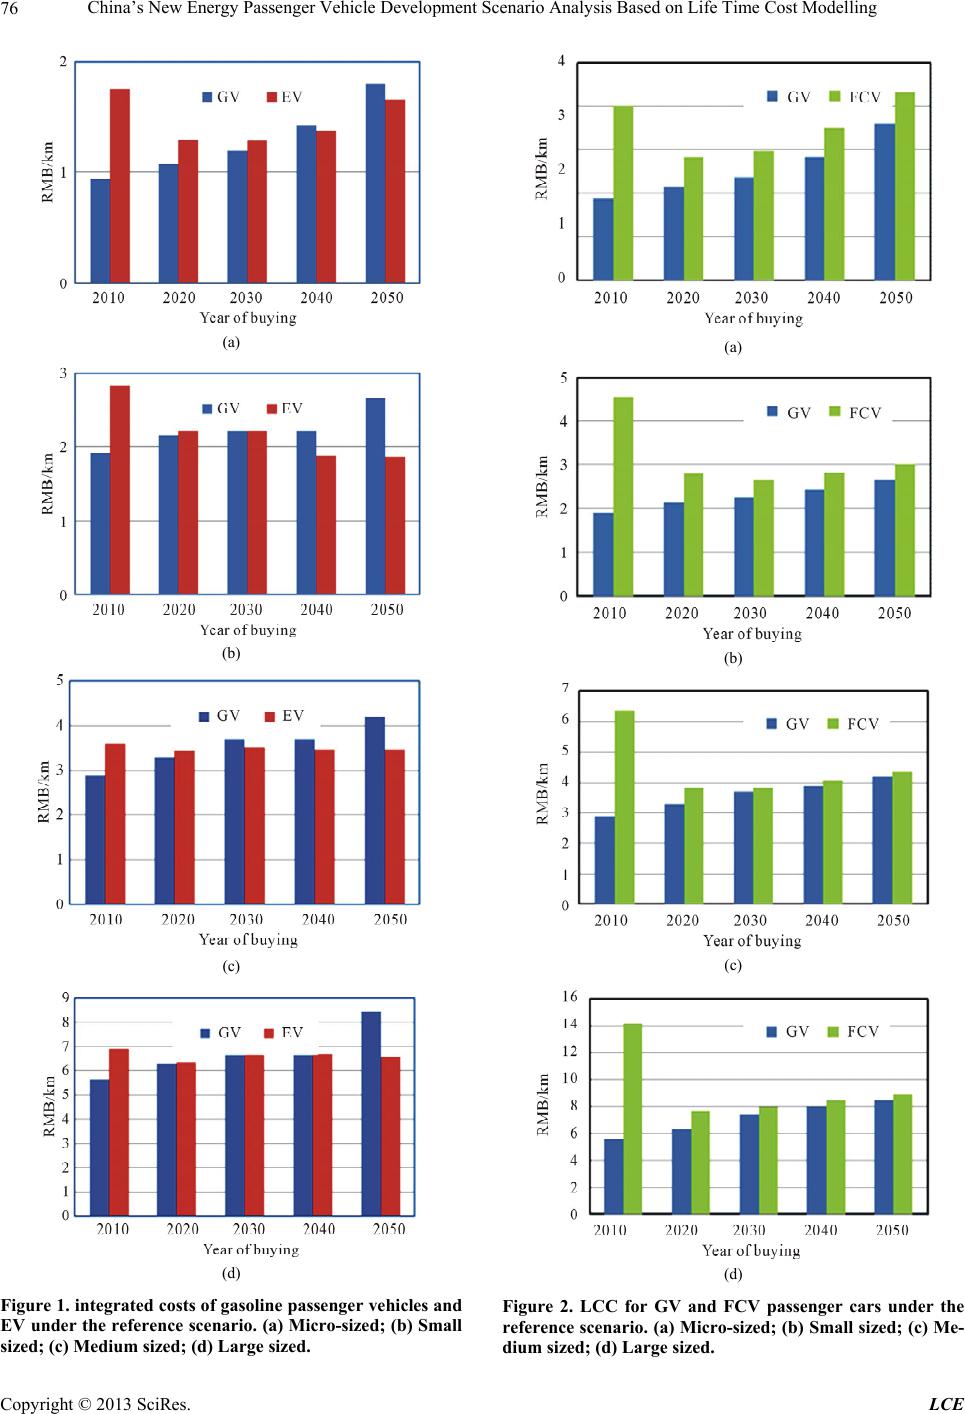 China’s New Energy Passenger Vehicle Development Scenario Analysis Based on Life Time Cost Modelling Copyright © 2013 SciRes. LCE 76 (a) (b) (c) (d) Figure 1. integrated costs of gasoline passenger vehicles and EV under the reference scenario. (a) Micro-sized; (b) Small sized; (c) Medium sized; (d) Large sized. (a) (b) (c) (d) Figure 2. LCC for GV and FCV passenger cars under the reference scenario. (a) Micro-sized; (b) Small sized; (c) Me- dium sized; (d) Large sized. 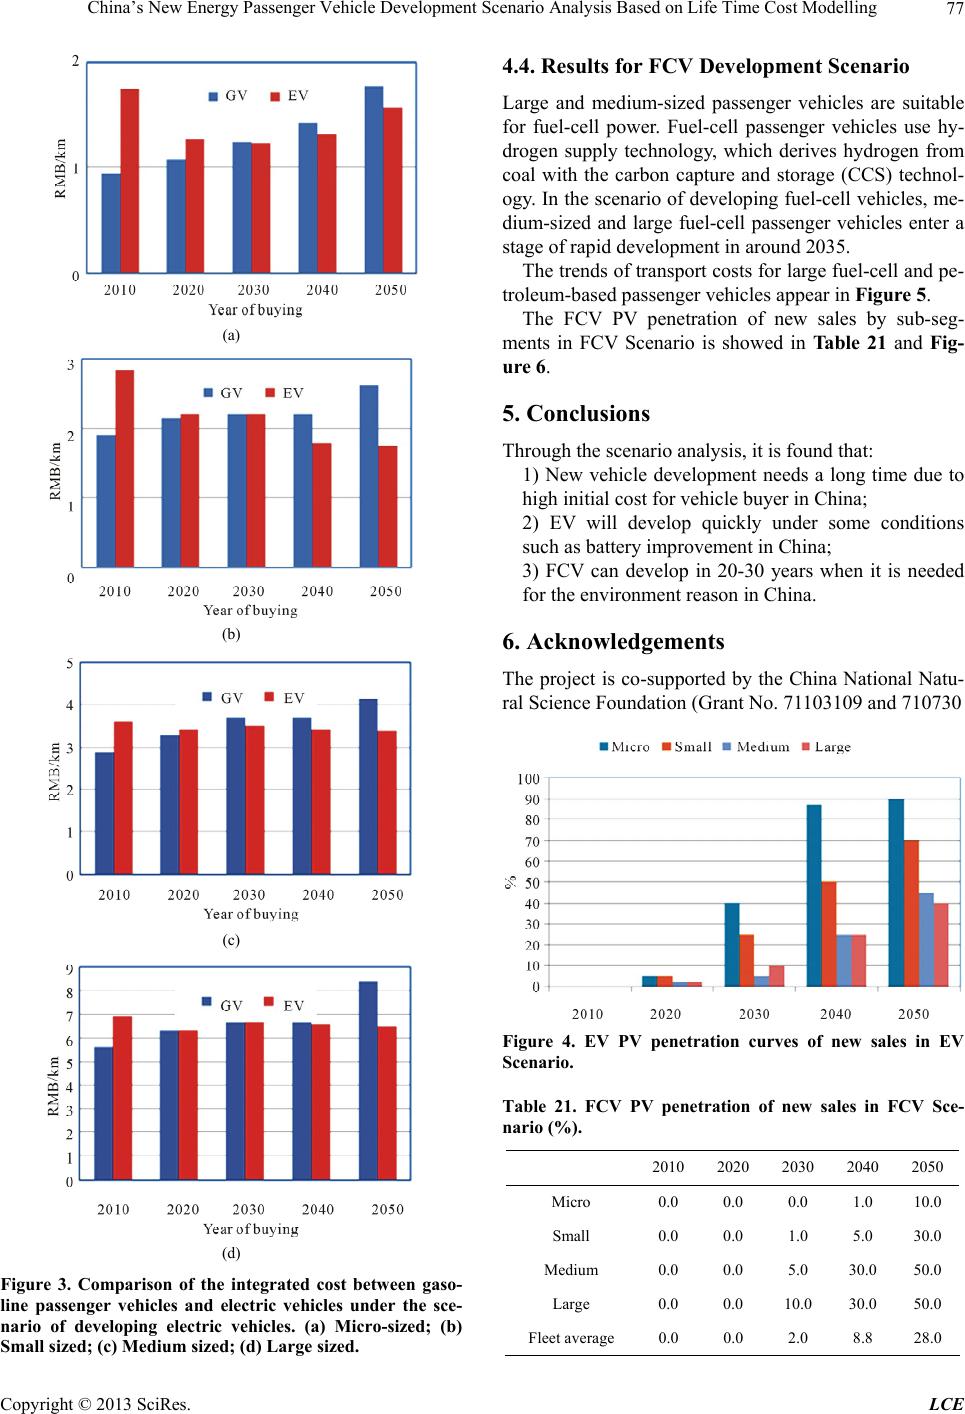 China’s New Energy Passenger Vehicle Development Scenario Analysis Based on Life Time Cost Modelling Copyright © 2013 SciRes. LCE 77 (a) (b) (c) (d) Figure 3. Comparison of the integrated cost between gaso- line passenger vehicles and electric vehicles under the sce- nario of developing electric vehicles. (a) Micro-sized; (b) Small sized; (c) Medium sized; (d) Large sized. 4.4. Results for FCV Development Scenario Large and medium-sized passenger vehicles are suitable for fuel-cell power. Fuel-cell passenger vehicles use hy- drogen supply technology, which derives hydrogen from coal with the carbon capture and storage (CCS) technol- ogy. In the scenario of developing fuel-cell vehicles, me- dium-sized and large fuel-cell passenger vehicles enter a stage of rapid development in around 2035. The trends of transport costs for large fuel-cell and pe- troleum-based passenger vehicles appear in Figure 5. The FCV PV penetration of new sales by sub-seg- ments in FCV Scenario is showed in Table 21 and Fig- ure 6. 5. Conclusions Through the scenario analysis, it is found that: 1) New vehicle development needs a long time due to high initial cost for vehicle buyer in China; 2) EV will develop quickly under some conditions such as battery improvement in China; 3) FCV can develop in 20-30 years when it is needed for the environment reason in China. 6. Acknowledgements The project is co-supported by the China National Natu- ral Science Foundation (Grant No. 71103109 and 710730 Figure 4. EV PV penetration curves of new sales in EV Scenario. Table 21. FCV PV penetration of new sales in FCV Sce- nario (%). 2010 2020 2030 2040 2050 Micro 0.0 0.0 0.0 1.0 10.0 Small 0.0 0.0 1.0 5.0 30.0 Medium 0.0 0.0 5.0 30.0 50.0 Large 0.0 0.0 10.0 30.0 50.0 Fleet average 0.0 0.0 2.0 8.8 28.0  China’s New Energy Passenger Vehicle Development Scenario Analysis Based on Life Time Cost Modelling Copyright © 2013 SciRes. LCE 78 (a) (b) (c) (d) Figure 5. Transport costs of fuel-cell and petroleum-based passenger vehicles in the scenario of developing fuel-cell vehicles. (a) Micro-sized; (b) Small sized; (c) Medium sized; (d) Large sized. Figure 6. FCV PV penetration curves of new sales in FCV Scenario. 95), China National Social Science Foundation (09&ZD0 29), MOE Project of Key Research Institute of Humani- ties and Social Sciences at Universities in China (2009 JJD790029) and the CAERC program (Tsinghua/GM/ SAIC-China). The authors would like to thank the re- viewers, Dr. Ting Zhang of GM-China and Dr. Hong Huo of Tsinghua University for their generous help. REFERENCES [1] X. Ou, X. Zhang and S. Chang, “Scenario Analysis on Alternative Fuel/Vehicle for China’s Future Road Trans- port: Life-Cycle Energy Demand and GHG Emissions,” Energy Policy, Vol. 38, No. 8, 2010, pp. 3943-3956. doi:10.1016/j.enpol.2010.03.018 [2] CAERC (China Automotive Energy Research Center, Tsinghua University), “Sustainable Automotive Energy System in China,” Springer Press, Berlin Heidelberg, 2013. [3] Y. Ren, H. Li, R. Sun and L. Guan, “Analysis on Model of Life Cycle Cost of Electric Vehicle Based on Con- sumer Perspective,” Technology Economics, Vol. 28, No. 11, 2009, pp. 54-58. [4] Z. H. Cai, X. M. Ou, Q. Zhang and X. L. Zhang, “Full Lifetime Cost Analysis of Battery, Plug-In Hybrid and FCEVs in China in the Near Future,” Frontier in Energy, Vol. 6, No. 2, 2012, pp. 107-111. doi:10.1007/s11708-012-0182-1 [5] D. V. Wagner, F. An and C. Wang, “Structure and Im- pacts of Fuel Economy Standards for Passenger Cars in China,” Energy Policy, Vol. 37, No. 10, 2009, pp. 3803- 3811. doi:10.1016/j.enpol.2009.07.009 [6] H. Hong, Z. L. Yao, K. B. He and X. Yu, “Fuel Con- sumption Rates of Passenger Cars in China: Labels versus Real-World,” Energy Policy, Vol. 39, No. 11, 2011, pp. 7130-7135. doi:10.1016/j.enpol.2011.08.031 [7] H. Huo, Q. Zhang, K. B. He, Z. L. Yao and M. Wang, “Vehicle-Use Intensity in China: Current Status and Fu- ture Trend,” Energy Policy, Vol. 43, 2012, pp. 6-16. doi:10.1016/j.enpol.2011.09.019  China’s New Energy Passenger Vehicle Development Scenario Analysis Based on Life Time Cost Modelling Copyright © 2013 SciRes. LCE 79 [8] CAERC (China Automotive Energy Research Center Tsinghua University), “Life Cycle Cost Data for Vehicle and Fuel in China,” Technology Report, Tsinghua University, Beijing, 2010.
|