 Journal of Water Resource and Protection, 2013, 5, 511-519 http://dx.doi.org/10.4236/jwarp.2013.55051 Published Online May 2013 (http://www.scirp.org/journal/jwarp) Quantitative Analysis of the Rate of Geochemical Weathering of Sulfur from Sedimentary Rocks Using Atmospheric Deposition, Concentration and River Discharge Data —A Case Study of the Mountainous Basin of the Tedori River, Japan, over a 16-Year Period Toshisuke Maruyama1, Masashi Yoshida1, Keiji Takase1, Hiroshi Takimoto1, Shigeo Ishikawa2, Sadao Nagasaka2 1Faculty of Environmental Science, Ishikawa Prefectural University, Ishikawa, Japan 2College of Bioresource Science, Nihon University, Kanagawa, Japan Email: maruyama@ishikawa-pu.ac.jp Received March 5, 2013; revised April 7, 2013; accepted April 27, 2013 Copyright © 2013 Toshisuke Maruyama et al. This is an open access article distributed under the Creative Commons Attribution License, which permits unrestricted use, distribution, and reproduction in any medium, provided the original work is properly cited. ABSTRACT Quantitative analysis of the rate of geochemical weathering of sulfur (S) from sedimentary rocks (GeoS) was conducted using concentration (Cs) and discharge (Qs) data from the Tedori River and atmospheric deposition (AtdepS) in the ba- sin. First, S fluxes were calculated using 16 years of Cs and Qs data. The annual average discharge of S (TotalS) was estimated at 8597 ton·year−1 (117.3 kg·ha−1·year−1). Of this, 1331 ton·year−1 was AtdepS (18.2 kg·ha−1·year−1) and an- other 7266 ton·year−1 was GeoS (99.1 kg·ha−1·year−1). Monthly changes in TotalS were investigated, which showed that GeoS was highest in summer, because of the air temperature, while AtdepS peaked in winter because of seasonal wind. Using Qs and AtdepS corrected for altitude, Tota lS, AtdepS and GeoS were estimated at six sites, and among these sites we found that the TotalS per unit area values were random, depending on the site characteristics. In particular, the dis- charge from the Kuwajima site was remarkably high suggesting that the sedimentary rocks at this site had higher pyrite content than at the other sites. Finally, we also assessed the relationship between the characteristics of sedimentary rocks and GeoS in a range of rivers in the Hokuriku Region, and found that there was a close relationship between con- centrations of greater than 10 mg·l−1 and sedimentary rocks containing the pyrite group. In addition, we esti- mated that the influence of GeoS was present when the concentration of 2 4 SO 2 4 SO in river water was greater than 2 - 3 mg· l −1 in the Hokuriku region. Keywords: Sulfur Balance; Wet and Dry Deposition; Sulfur Concentration; Altitude Dependence; Sulfur Discharge from Pyrite 1. Introduction There is great concern about sulfur (S) cycling in a river basin because it is closely related to acid deposition in soil, leads to sulfate contamination of irrigation water and has possible damaging consequences for human health. The S cycle in a mountainous river basin is governed by at- mospheric deposition (AtdepS) and geochemical weath- ering of sedimentary rocks (GeoS). The annual average discharge of S (TotalS) from a basin can be estimated by taking the product of the discharge (Qs) and the concen- tration of S (Cs) in the river. Based on the above, the objectives of this research were as follows: 1) to establish weathering rates of the sulfur mineral defined as GeoS using Qs and Cs of the river and AtdepS in the study area; 2) to estimate TotalS discharge from a river basin at various sites both within and beyond the study area; and 3) to investigate the ef- fect of GeoS from sedimentary rocks on different sulfate concentrations in river. Many studies on geochemical cycling of S have been conducted, including large-scale marine studies. Jamie- son et al. carried out a study on the concentrations of sulfate in seawater from sulfur isotopes in sulfide ore [1], C opyright © 2013 SciRes. JWARP  T. MARUYAMA ET AL. 512 while Newton et al. reported large shifts in the isotopic composition of seawater sulfate across the Permian-Tri- assic boundary in northern Italy [2]. Ooki reported size resolved sulfate and ammonium measurements in marine boundary layer from November 2001 to March 2002 over the North and South Pacific [3]. Much research has also been carried out on sulfur cy- cling in river basins. For example, Norman et al. exam- ined the biogenetic contribution to aerosols and precipi- tation using isotopes and oxygen [4]. Elimaers et al. in- vestigated the effects of climate on sulfate fluxes from forested catchments in south-central Ontario [5]. William et al. investigated the change in ion outputs from water- sheds resulting from acidification of precipitation [6]. Beaulieu et al. modeled the interactions between water and rocks in the Mackenzie Basin; and highlighted the competition between sulfuric and carbonic acid [7]. Huang et al. investigated weathering and soil formation rates based on geochemical mass balances in a small for- ested watershed [8]. Mine drainage water has also been studied by many researchers. Budakoglu et al. investigated the distribution of, and contamination from, sulfur-isotopes related to the Baya Pb-Zn mine in Turkey [9], while Edraki et al. in- vestigated the hydrochemistry, mineralogy and sulfur isotope geochemistry of acid mine drainage at the Mt. Morgan mine, Australia [10]. This study differs from those documented above, in that it reports the results of quantitative analysis of To- talS in a river, in which GeoS has been estimated quanti- tatively by analysis of Qs, Cs and AtdepS data. To date, there have been very few studies of quantitative analysis of S discharges from river basins [11]. 2. Methods 2.1. Fundamental Concept of Our Research We collected Qs and Cs data of river water and the At- depS (wet and dry) in a mountainous basin, to estimate fluxes of GeoS quantitatively, and analyzed the relation- ships among them. The relationship is relatively simple in mountainous basins when compared with lowland ba- sins, as land use is generally more complicated in low- land basins and may include agricultural land, residential and industrial areas. The S cycle in this study is based on the hypothesis that the TotalS (the product of Qs and Cs) is consist of AtdepS and GeoS in locations where there is little artifi- cial disturbance (Figure 1). Among them, GeoS is a source of S from inside and AtdepS is an input of S from outside of the basin. The hypothesis contains the change in storage of S in the basin is negligible small due to At- depS without including GeoS, In other words, this study assumes a steady state, in which the effect of AtdepS in AtdepS Geo Total Flow out Atomospheric deposition S Sedimentary rock (FeS2 group) Moutainous basin River Figure 1. Flow of sulfur (S) in mountainous basin. the study area remained constant during the study period. On the other hand, river basin usually has sedimentary rock layers, which sometimes contain S compounds. These layers will have been subject to long-term weathering, resulting in the release of into the river. 2 4 SO This research procedure consists of the three following steps: 1) Estimation of the total outflow of S (TotalS) from a test basin using Qs and Cs; 2) Estimation of AtdepS using 2 4 SO atmospheric depo- sition data measured near the test basin; 3) Estimation of GeoS by subtracting the AtdepS from the TotalS. To verify the relationships mentioned above, long- term data are required to 1) eliminate the short-term variation in stored S inside of the basin, and 2) minimize the influence of high flows through flooding periods on Cs concentrations. In other words, the S cycle is assumed to be in a dynamic steady state as follows: If AtdepS is deposited into a basin, the S will be distributed through- out the soil, water, grass, trees and wild animals. The forest (basin) will gradually become saturated with S, and the excess S from AtdepS will then flow out to the river. If this S cycle continues over a prolonged period, the flow of S in the forest will approach a steady state. Based on the above hypothesis, AtdepS data for a 16-year pe- riod (divided into yearly intervals) were analyzed. We applied the approach which has been taken in the nitro- gen balance analysis already [12,13]. Because the sulfur and nitrogen ions may behave in a similar manner, we applied the same procedure to sulfur analysis. 2.2. Research Site The research site is located in the southern part of Ishi- kawa prefecture, Japan. The research river is the Tedori River which has an area of 809 km2, as shown in Figure 2. The source of the river is at Mount Hakusan, which has an altitude of 2702 m, and flows down a ravine be- tween mountains to Nakajima point (at which point the basin area is 733 km2), from where the river flows Copyright © 2013 SciRes. JWARP  T. MARUYAMA ET AL. 513 Figure 2. The upland area of the Tedori river basin and the discharge (Qs) and total nitrogen concentration (Cs) moni- toring sites. through an alluvial fan into the Sea of Japan. The alluvial area comprises developed fertile agricultural land and important industrial and residential areas, all of which are supported by surface water and groundwater from the Tedori River. Plant cover in the basin varies according to the alti- tude. There is a mountainous belt (altitude 400 - 1500 m), a semi-high mountain belt (1500 - 2000 m) and a high mountain belt (>2000 m). The upstream area belongs to the high mountain belt, is dominated by the Hakusan National Park and is covered with low height pine trees. In the semi-high mountain belt there is high mountain grass, known as flower meadow. Betula Ermanii Cha- nisso and Abies Mariesii Mast are typical of this area, with the former tree more common in higher areas than the latter. In the mountainous area, there are mature high quality beech trees, while Quercus Crisoula Blume and Japan Marple are found in the lowland areas. Red pine trees are found on ridges and cedars are found in the val- ley areas of mountains [14-16]. The catchment is in an area of high precipitation, and the annual average precipitation recorded at Kanazawa is 2348 mm. Of this total, 1059 mm falls between April and September, while 1289 mm falls from October to May, including much snowfall. The average temperature is 14.9˚C, with an average maximum of 26.1˚C recorded in August and an average minimum of 4.0˚C recorded in January. 2.3. Investigation of At depS, Cs and Qs The AtdepS was monitored weekly by the Ishikawa pre- fectural government over a 16 year period at the Taiyou- gaoka site, located at an altitude of 120 m and at a dis- tance of 10 km from the study area [17]. The samples were collected by a 20 cm diameter rain gauge. The S in AtdepS was analyzed by the ion chromatograph method. In addition to wet deposition, there is dry deposition of S from the atmosphere, which was investigated only for 5 years from 2003 to 2007 [18-21]. To account for dry deposition in other years, the average of the dry depo- sition of S data collected was added to wet deposition of the other years because the ratio of dry deposition to wet deposition was very small. Furthermore, the AtdepS (wet deposit) was investi- gated at Torigoe, located close to the center of the study area, over 7-year period (1997 and 1999-2004) [17]. When compared with the Taiyougaoka and Taiyougaoka data, similar trends are apparent; therefore we considered that the Taiyougaoka data was sufficiently reliable to be used for estimating the quantity of sulfur even though the ob- servation site was located outside of the study area. To assess the TotalS in the study area, Cs data (as 2 4 SO ) was collected at the following six sites (Figure 2): the Hirose site located near the Nakajima discharge ob- servation site, the Tedori dam site located at the No. 1 Hydroelectric Power Generation Station just downstream of the Tedori dam, and the Kamikawai site located downstream of the Dainichi dam. The Senami site is lo- cated at the water outlet of the Senami and the Ozo rivers because the basin was changed so that it flows into the Tedori dam. The Shiramine site is located in the up- stream section of the Tedori River and the Kuwajima site is at the intake for the Kuwajima Hydroelectric Power Generation Station. Cs was sampled monthly from 1994 to 2003 and quar- terly after 2004 (May, August, November, February), except at the Tedori dam site, where monthly sampling continued after 2004. 2 4 SO was measured by the ion chromatograph method. The data were reported in an Annual Report by the Ishikawa Water Supply Office of the Tedori River [21]. The Qs was recorded at the Nakajima site, which is located in the lower reaches of the basin near the Hirose site (Figure 2). The Qs data were supplied by the Ho- kuriku Hydroelectric Company. The Tota lS outflow from the basin was estimated by multiplying the Qs and Cs. 2.4. Altitude Correction for Qs and AtdepS To estimate the TotalS at the above six sites, Qs and At- depS had to be corrected for Qs and AtdepS based on the altitude because both are strongly affected by basin height. Full details of how we analyzed the altitude de- pendence of Qs and AtdepS are available elsewhere [12, 13], but brief details of the procedure are as follows: Copyright © 2013 SciRes. JWARP  T. MARUYAMA ET AL. 514 The altitude correction was conducted at 200 m inter- vals. To make the calculation simple, the weighted cen- tral height of the basin was obtained previously by the following formula. 1 1n i cHi A Ai (1) Here, Hc(m) is the central altitude within the 200 m belt weighted area, Hi(m) is the central altitude of the each belt, Ai (ha) is the area of the belt, n is the number of belts and A (ha) is the total area of the test basin sites. The Hc for relevant test sites is shown in Table 1. 2.4.1. Altitude Dependence of Qs Qs in the Tedori River basin at Kanazawa was not re- corded, but was estimated using precipitation minus evapotranspiration. The evapotranspiration was estimated by complementary relationship using the Penman equa- tion. The result was obtained using 16 years data. The relationship between the two sites is: 2 akajima1.153Kanazawa 1406 0.689, 0.0007 Qs Qs Rp (2) Here, the unit of Qs is mm·year−1. The altitude dependence of Qs between sites at Kana- zawa (Qs is 1603 mm·year−1 and Hc is 7 m) and Naka- jima (Qs is 3299 mm·year−1 and Hc is 943 m) was de- termined by a straight line passing through the altitude and the Qs of two sites Figure 3. The following experi- mental formula was obtained: 1.757 1594Qs Hc (3) To estimate Qs at relevant sites, the experimental For- mula (3) was rewritten by standardization with Nakajima site which have investigated Qs data. 0.000540 0.4908 Nakajima Qs Hc Qs (4) The relative Qs [Qs/Qs (Nakajima)] was shown in Ta- ble 1 for estimation of Qs at the relevant sites. 2.4.2. Altitude Dependence of AtdepS The altitude dependence of AtdepS between Taiyougaoka and Sanpoiwa was based on the average of 7 years’ data from June to October as shown in Figure 4 (1995-2001) [17]. The relationship is: Sanpoiwa 0.554TaiyougaokaAdepS AtdepS altitude dependence was determined by a straight line (5) where, unit of AtdepS is kg·ha−1·5 month−1. The experimental formula was applied for entire year. The average of observed AtdepS at Taiyougaoka was 25.08 kg·ha−1·year−1 and the AtdepS of Sanpoiwa was 13.89 kg·ha−1·year−1 estimated by Equation (5), then, the passing through the above two AtdepS values and each altitude (Taiyougaoka altitude Hc is 120 m and Sanpoiwa altitude Hc is 1450 m above sea level respectively). The experimental formula was obtained as follows: 26.09 0.00841 tdepS Hc (6) where, the unit of AtdepS is kg·ha−1·year−1 ate AtdepS at relevant sites, the experimental Fo at any altitude Hc (m). To estim rmula (6) was rewritten by standardization with Taiy- ougaoka site which have investigated AtdepS data. 1.040 0.000335 Taiyougaoka AtdepS c AtdepS (7) The relative AtdepS [AtdepS/AtdepS (Taiyougaoka)] w areas for relevant Cs observation sites, the he 3. Results om Test Basin res of Qs, Cs and Total S as shown in Table 1 for estimation of AtdepS at rele- vant sites. The basin ight of the center (Hc) of the relevant basins, the rela- tive discharge based on Nakajima data calculated by Equation (4) and the relative AtdepS based on Taiyou- gaoka data calculated by Equation (7) at relevant sites are shown in Table 1. 3.1. Total S fr Table 2 shows the statistical featu 0 500 1000 1500 2000 2500 3000 3500 4000 4500 05001000 1500 2000 2500 Kanazawa anual Qs(mm.year-1) Nakajima anual Qs (mm.year-1) Nq=1.153Kq+1406 Figure 3. Relationship between Qs at Nakajima and Kana- zawa (mm·year−1). Figure 4. AtdepS relationship between Sanpoiwa and Tiy- ougaoka. a Copyright © 2013 SciRes. JWARP 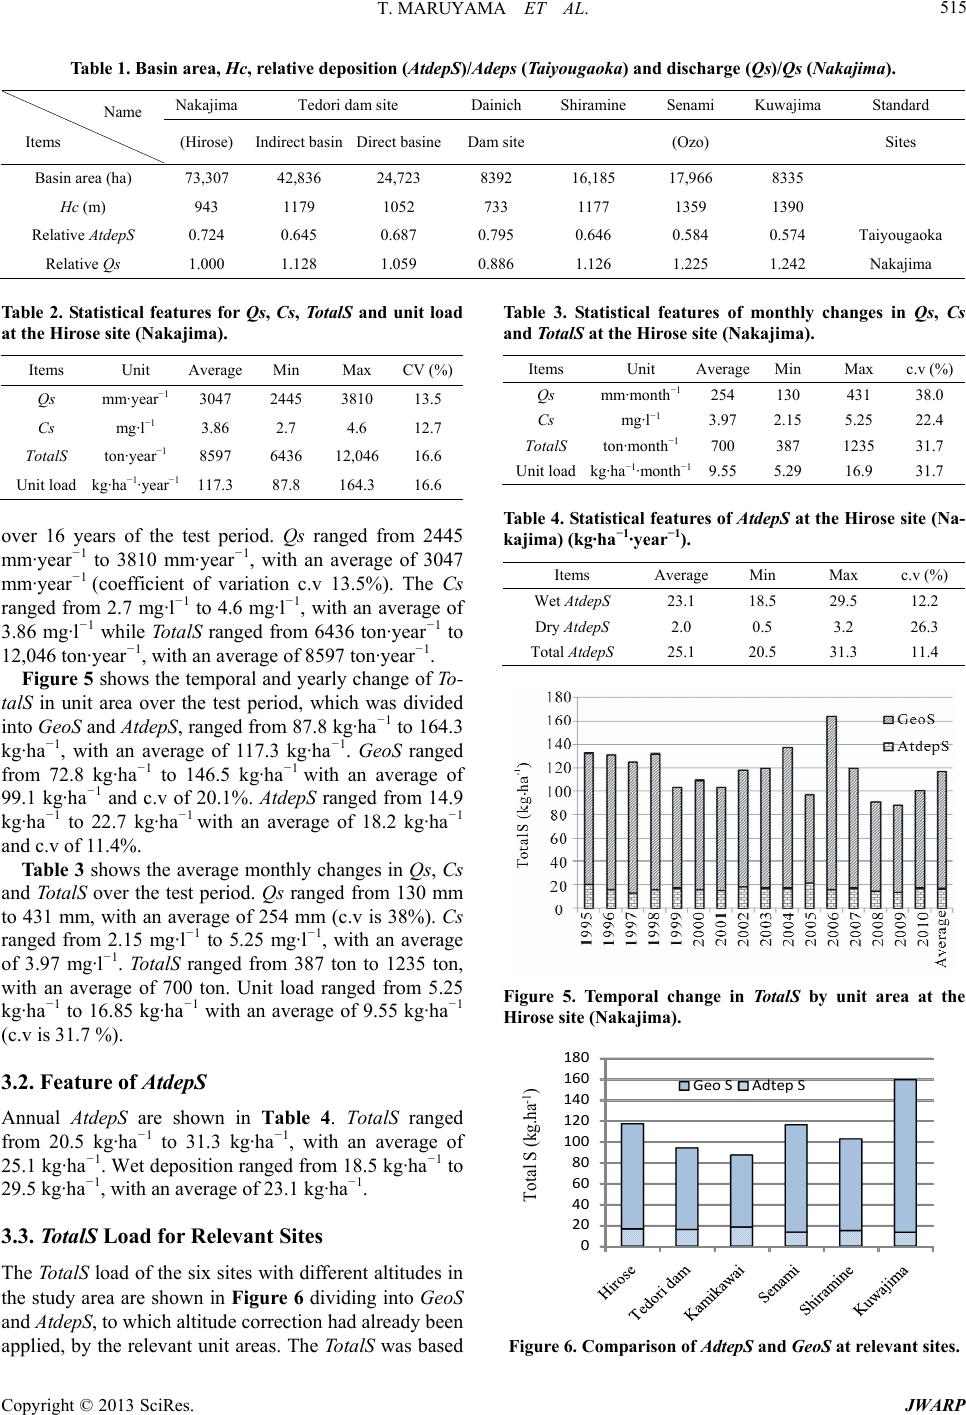 T. MARUYAMA ET AL. Copyright © 2013 SciRes. JWARP 515 de aoka) and discharge (Qs)/Qs (Nakajima). Table 1. Basin area, Hc, relative deposition (AtdepS)/As (Taiyougp NakajimaTedori dam site Dainich ShiramineSenami Kuwajima Standard Name Items (Hirose) Indirect basin DamDirect basine site (Ozo) Sites Basin area (ha) 17,73,307 42,836 24,723 8392 16,185 966 8335 Hc (m) 943 1179 1052 733 1177 1359 1390 Rela pS Taiyougaoka tive Atde0.724 0.645 0.687 0.795 0.646 0.584 0.574 Relative Qs 1.000 1.128 1.059 0.886 1.126 1.225 1.242 Nakajima able 2. Statistical features for Qs, Cs, TotalS and unit load Min Max CV (%) T at the Hirose site (Nakajima). Items Unit Average Qs m−1 m·year 3047 2445 3810 13.5 Cs mg·l−1 3.86 2.7 4.6 12.7 TotalS t 8597 1 Unit load k1 on·year−16436 2,04616.6 g·ha−1·year−117.3 87.8 164.3 16.6 ver 16 years of the test period. Qs ranged from 2445 o- ta he average monthly changes in Qs, Cs an 3.2. Feature of AtdepS in Table 4. TotalS ranged 3.3. TotalS Load for Relevant Sites t altitudes in Table 3. Statistical features of monthly changes in Qs, Cs o mm·year−1 to 3810 mm·year−1, with an average of 3047 mm·year−1 (coefficient of variation c.v 13.5%). The Cs ranged from 2.7 mg·l−1 to 4.6 mg·l−1, with an average of 3.86 mg·l−1 while Tota lS ranged from 6436 ton·year−1 to 12,046 ton·year−1, with an average of 8597 ton·year−1. Figure 5 shows the temporal and yearly change of T lS in unit area over the test period, which was divided into GeoS and AtdepS , ranged from 87.8 kg·ha−1 to 164.3 kg·ha−1, with an average of 117.3 kg·ha−1. GeoS ranged from 72.8 kg·ha−1 to 146.5 kg·ha−1 with an average of 99.1 kg·ha−1 and c.v of 20.1%. AtdepS ranged from 14.9 kg·ha−1 to 22.7 kg·ha−1 with an average of 18.2 kg·ha−1 and c.v of 11.4%. Table 3 shows t d TotalS over the test period. Qs ranged from 130 mm to 431 mm, with an average of 254 mm (c.v is 38%). Cs ranged from 2.15 mg·l−1 to 5.25 mg·l−1, with an average of 3.97 mg·l−1. TotalS ranged from 387 ton to 1235 ton, with an average of 700 ton. Unit load ranged from 5.25 kg·ha−1 to 16.85 kg·ha−1 with an average of 9.55 kg·ha−1 (c.v is 31.7 %). Annual AtdepS are shown from 20.5 kg·ha−1 to 31.3 kg·ha−1, with an average of 25.1 kg·ha−1. Wet deposition ranged from 18.5 kg·ha−1 to 29.5 kg·ha−1, with an average of 23.1 kg·ha−1. The TotalS load of the six sites with differen the study area are shown in Figure 6 dividing into GeoS and AtdepS, to which altitude correction had already been applied, by the relevant unit areas. The Tota lS was based and TotalS at the Hirose site (Nakajima). Items Unit Average Min Max c.v (%) Qs mm·month−1254 130 431 38.0 Cs mg·l−1 3.97 2.15 5.25 22.4 TotalS Unit loadkg·h −1 ton·month−1700 387 1235 31.7 a−1·month9.55 5.29 16.9 31.7 Ttes tde these sia- ajima) (kg·ha−1·year−1). able 4. S atistical featur of ApS at Hirote (N k Items AverageMin Max c.v (%) Wet AtdepS 1 18.23.5 29.5 12.2 Dr S y Atdep 2.0 0.5 3.2 26.3 Total AtdepS 25.1 20.5 31.3 11.4 Figure 5. Temporal change in TotalS by unit area at the Hirose site (Nakajima). 0 20 40 60 80 100 120 140 160 180 GeoSAdtepS Total S (kg.ha -1 ) Figure 6. Comparison of AdtepS and GeoS at relevant sites. 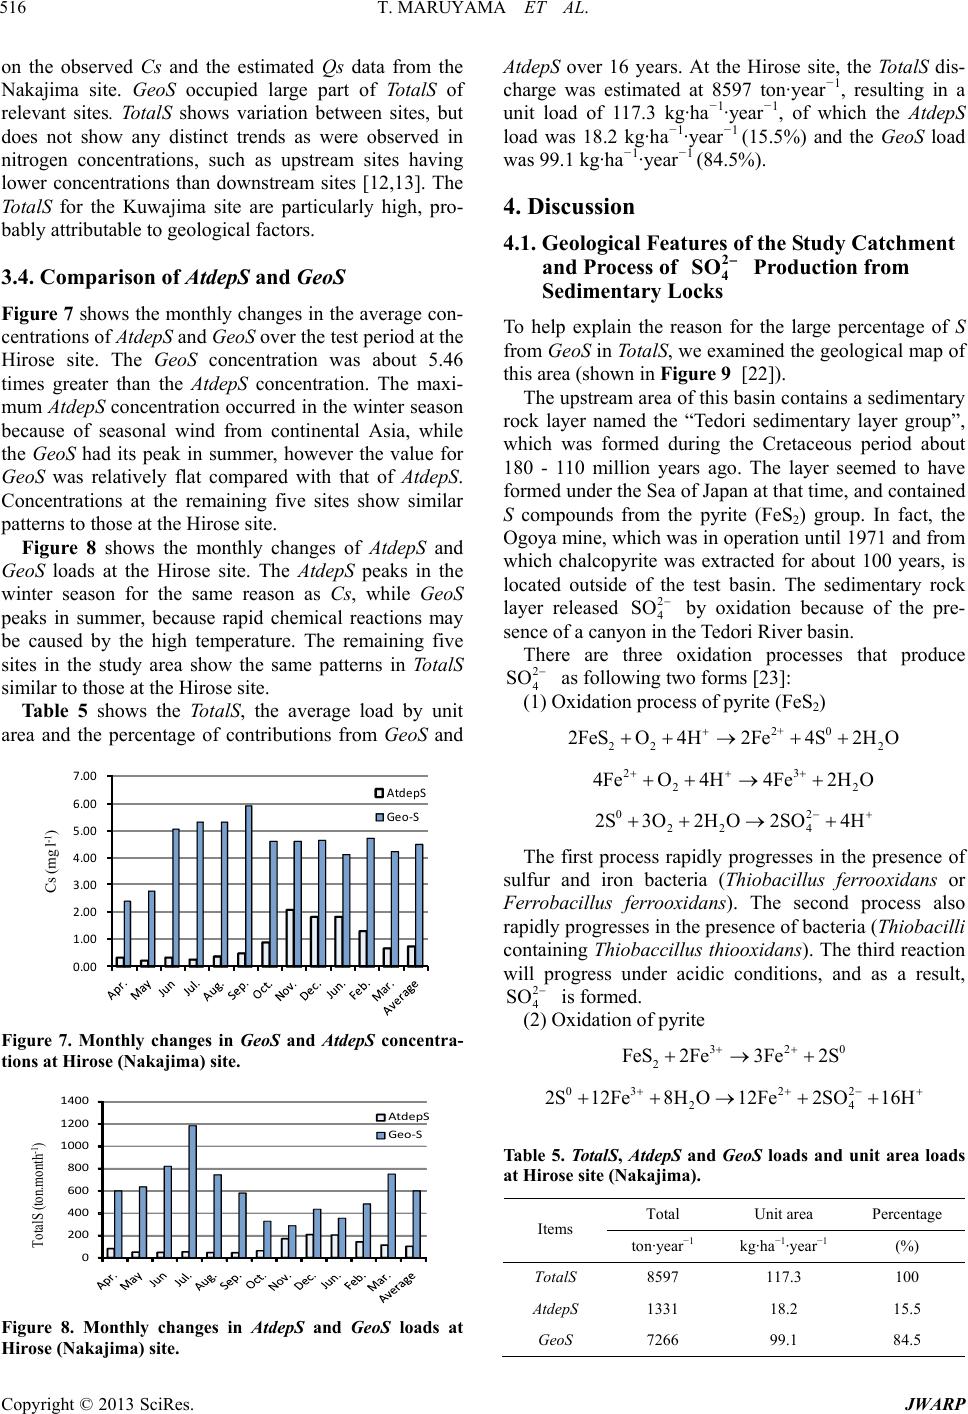 T. MARUYAMA ET AL. 516 on the observed Cs and the estimated Qs data from the Nakajima site. GeoS occupied large part of TotalS of relevant sites. TotalS shows variation between sites, but does not show any distinct trends as were observed in nitrogen concentrations, such as upstream sites having lower concentrations than downstream sites [12,13]. The TotalS for the Kuwajima site are particularly high, pro- bably attributable to geological factors. 3.4. Comparison of AtdepS and GeoS Figure 7 shows the monthly changes in the average co s of AtdepS and peaks in the ile GeoS n- centrations of AtdepS and GeoS over the test period at the Hirose site. The GeoS concentration was about 5.46 times greater than the AtdepS concentration. The maxi- mum AtdepS concentration occurred in the winter season because of seasonal wind from continental Asia, while the GeoS had its peak in summer, however the value for GeoS was relatively flat compared with that of AtdepS. Concentrations at the remaining five sites show similar patterns to those at the Hirose site. Figure 8 shows the monthly change GeoS loads at the Hirose site. The AtdepS winter season for the same reason as Cs, wh peaks in summer, because rapid chemical reactions may be caused by the high temperature. The remaining five sites in the study area show the same patterns in TotalS similar to those at the Hirose site. Table 5 shows the To talS, the average load by unit area and the percentage of contributions from GeoS and 0.00 1.00 2.00 3.00 4.00 5.00 6.00 7.00 AtdepS Geo‐S Cs (mg l -1 ) Figure 7. Monthly changes in GeoS and AtdepS concentra- tions at Hirose (Nakajima) site. 0 200 400 600 800 1000 1200 1400 AtdepS Geo‐S TotalS (ton.month -1 ) Figure 8. Monthly changes in AtdepS and GeoS loads at irose site, the TotalS dis- harge was estimated at 8597 ton·year−1, resulting in a unit load of 117.3 kg·ha−1·year−1, of which the AtdepS load was 18.2 kg·ha−1·year−1 (15.5%) and the GeoS load was 99.1 kg·ha−1·year−1 (84.5%). 4. Discussion 4.1. Geological Features of the Study Catchment and Process of Production from Sedimentary e examined the geological map of layer seemed to have formed under the Sea of Japan at that time, and contained m the pyrite (FeS2) group. In fact, the tr locatock laye Hirose (Nakajima) site. AtdepS over 16 years. At the H c 2 4 SO Locks To help explain the reason for the large percentage of S from GeoS in TotalS, w this area (shown in Figure 9 [22]). The upstream area of this basin contains a sedimentary rock layer named the “Tedori sedimentary layer group”, which was formed during the Cretaceous period about 180 - 110 million years ago. The S compounds fro Ogoya mine, which was in operation until 1971 and from which chalcopyrite was exacted for about 100 years, is ed outside of the test basin. The sedimentary r r released 2 4 SO by oxidation because of the pre- sence of a canyon in the Tedori River basin. There are three oxidation processes that produce 2 4 SO as following two forms [23]: (1) Oxidation process of pyrite (FeS2) 2+ 0 22 2 2FeSO4H2Fe4S2H O 23 22 4FeO4H4Fe2H O 02 22 4 2S3O2H O2SO4H The first process rapidly progresses in the presence of sulfur and iron bacteria (Thiobacillus ferrooxidans or Ferrobacillus ferrxidans). The second process also rapidly progresses in the presence of bacteria (Thiobacilli co oo wi ntaining Thiobaccillus thiooxidans). The third reaction ll progress under acidic conditions, and as a result, 2 4 OS is formed. (2) Oxidation of pyrite 32 2 FeS 2Fe3Fe2S 0 032 2 24 2S12Fe8H O12Fe2SO6H1 Table 5. TotalS, AtdepS and GeoS loads and unit area loads at Hirose site (Nakajima). Total Unit area Percentage Items ton·year−1 kg·ha−1·year−1 (%) TotalS 8597 117.3 100 At 31 18.2 15.5 99.1 84.5 depS 13 GeoS 7266 Copyright © 2013 SciRes. JWARP 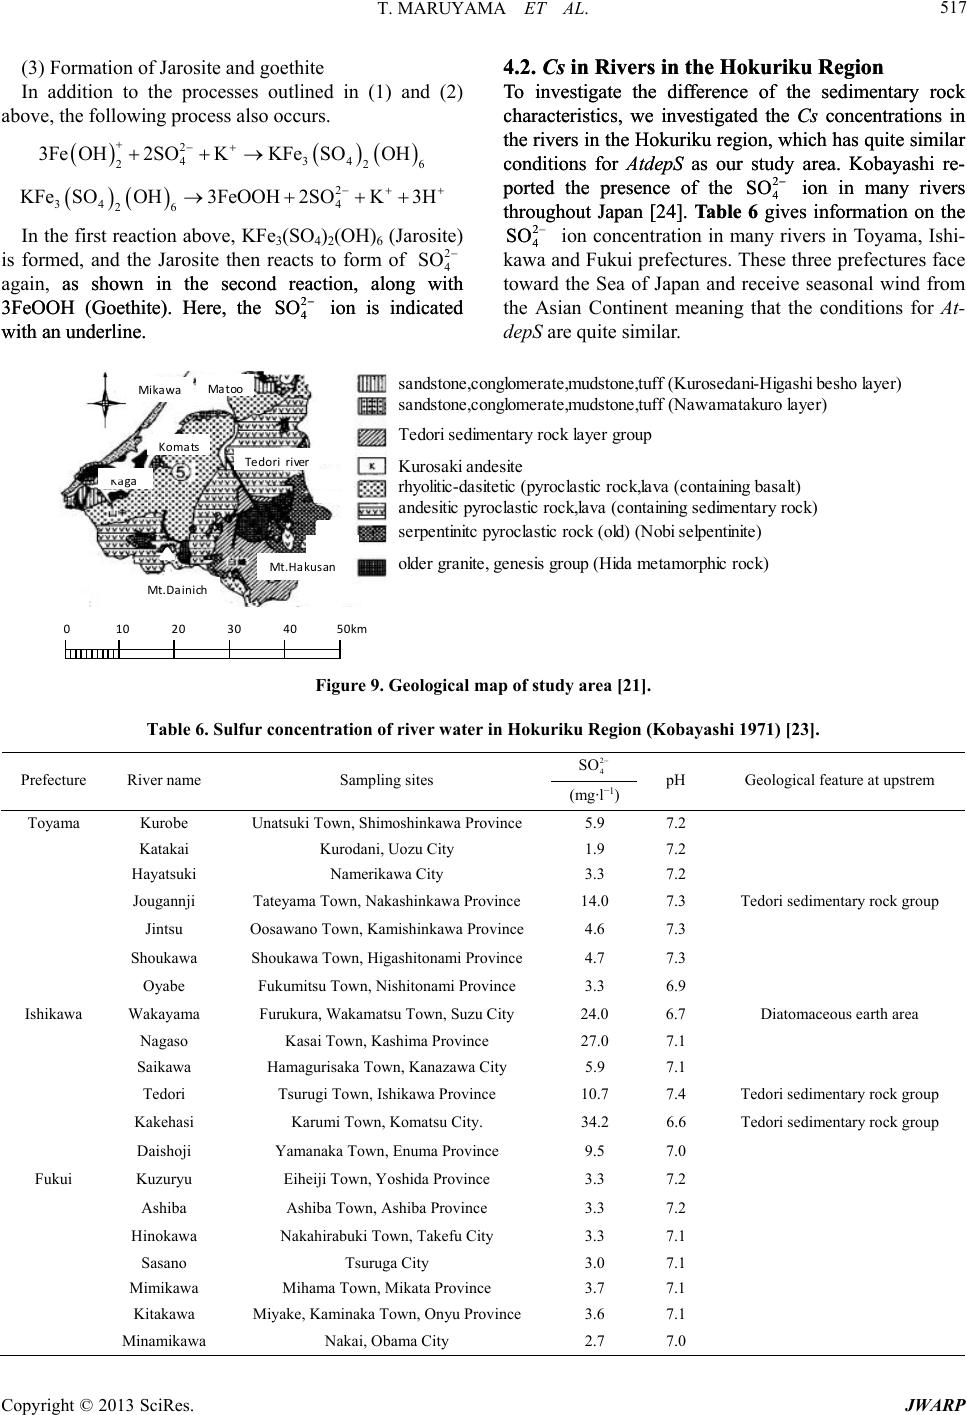 T. MARUYAMA ET AL. Copyright © 2013 SciRes. JWARP 517 (3) Formation of Jarosite and goethite In addition to the processes outlined in (1) and (2) above, the following process also occurs. Iirst reacbove, K)2(OH ) is form, and te t form 4.2. Cs in Rivers in the Hokuriku Region 4.2. Cs in Rivers in the Hokuriku Region 2 3Fe OH2SOKKFeSOOH 43 4 226 34 26 KFe SOOH To investigate the difference of the sedimentary rock characteristics, we investigated the Cs concentrations in the rivers in the Hokuriku region, which has quite similar conditions for AtdepS as our study area. Kobayashi re- ported the presence of the 4 ion in many rivers throughout Japan [24]. Table 6 gives information on the 4 To investigate the difference of the sedimentary rock characteristics, we investigated the Cs concentrations in the rivers in the Hokuriku region, which has quite similar conditions for AtdepS as our study area. Kobayashi re- ported the presence of the ion in many rivers throughout Japan [24]. Table 6 gives information on the 2 SO 2 4 SO 2 SO 2 4 SO ion concentration in many rivers in Toyama, Ishi- kawa and Fukui prefectures. These three prefectures face toward the Sea of Japan and receive seasonal wind from the Asian Continent meaning that the conditions for At- depS are quite similar. 2 4 3FeOOH 2SOK3H n the f ed tion aFe3(SO4)6 (Jarosite the Jarosihen reacts toof SO2 4 along with along with agashownthe second reaction, 3FeOOH (Goethite). Here, the ion is indicated wit derline shownthe second reaction, 3FeOOH (Goethite). Here, the ion is indicated wit derline in, as as in in 2 SO 2 4 4 SO h an unh an un. . sandstone,conglomerate,mudstone,tuff (Kurosedani-Higashi besho layer) onglomerate,mudstone,tuff (Nawamatakuro layer) Kuroaki andesite rhyolitic-dasitetic (pyroclastic rock,lava (containing basalt) andesit pyroclastic rock,lava (containing sedimentary rock) serpentinitc pyroclastic rock (old) (Nobi selpentinite) te, genesis group (Hida metamorphic rock) Tedori sedimentary rock layer group Mikawa Ma too sandstone,c Komats Tedoriri ver u s Kaga ic older grani Mt.H akusan Mt. Da i nich 0 10 20 30 50km40 Figure 9. Geological map of study area [21]. Table 6. Sulfur concentration of river water in Hokuriku Region (Kobayashi 1971) [23]. 2 4 SO Prefecture River name Sampling sites (mg·l−1) pH Geological feature at upstrem Toyama Kurobe Unatsuki Town, Shimoshinkawa Province 5.9 7.2 Katakai Kurodani, Uozu City 1.9 7.2 Hayatsuki Namerikawa City 3.3 7.2 Jougannji Tateyama Town, Nakashinkawa Province 14.0 7.3 Tedori sedimentary rock group Jintsu Oosawano Town, Kamishinkawa Province 4.6 7.3 Shoukawa Shoukawa Town, Higashitonami Province 4.7 7.3 Oyabe Fukumitsu Town, Nishitonami Province 3.3 6.9 Ishikawa Wakayama Furukur6.7 Diatomaceous earth area Saikawa Hamagurisaka Town, Kanazawa City 5.9 7.1 Tsurugi Trovince 10.7 Kakehasi Karumi Town, Komatsu City. 6.6 Tedori sedimentary rock group Fukui Eiheiji Town, Yoshida Province Hinokawa Kitakawa a, Wakamatsu Town, Suzu City 24.0 Nagaso Kasai Town, Kashima Province 27.0 7.1 Tedori own, Ishikawa P 7.4 Tedori sedimentary rock group 34.2 Daishoji Yamanaka Town, Enuma Province 9.5 7.0 Kuzuryu 3.3 7.2 Ashiba Ashiba Town, Ashiba Province 3.3 7.2 Nakahirabuki Town, Takefu City 3.3 7.1 Sasano Mimikawa Tsuruga City Mihama Town, Mikata Province 3.0 3.7 7.1 7.1 Miyake, Kaminaka Town, Onyu Province 3.6 7.1 Minamikawa Nakai, Obama City 2.7 7.0 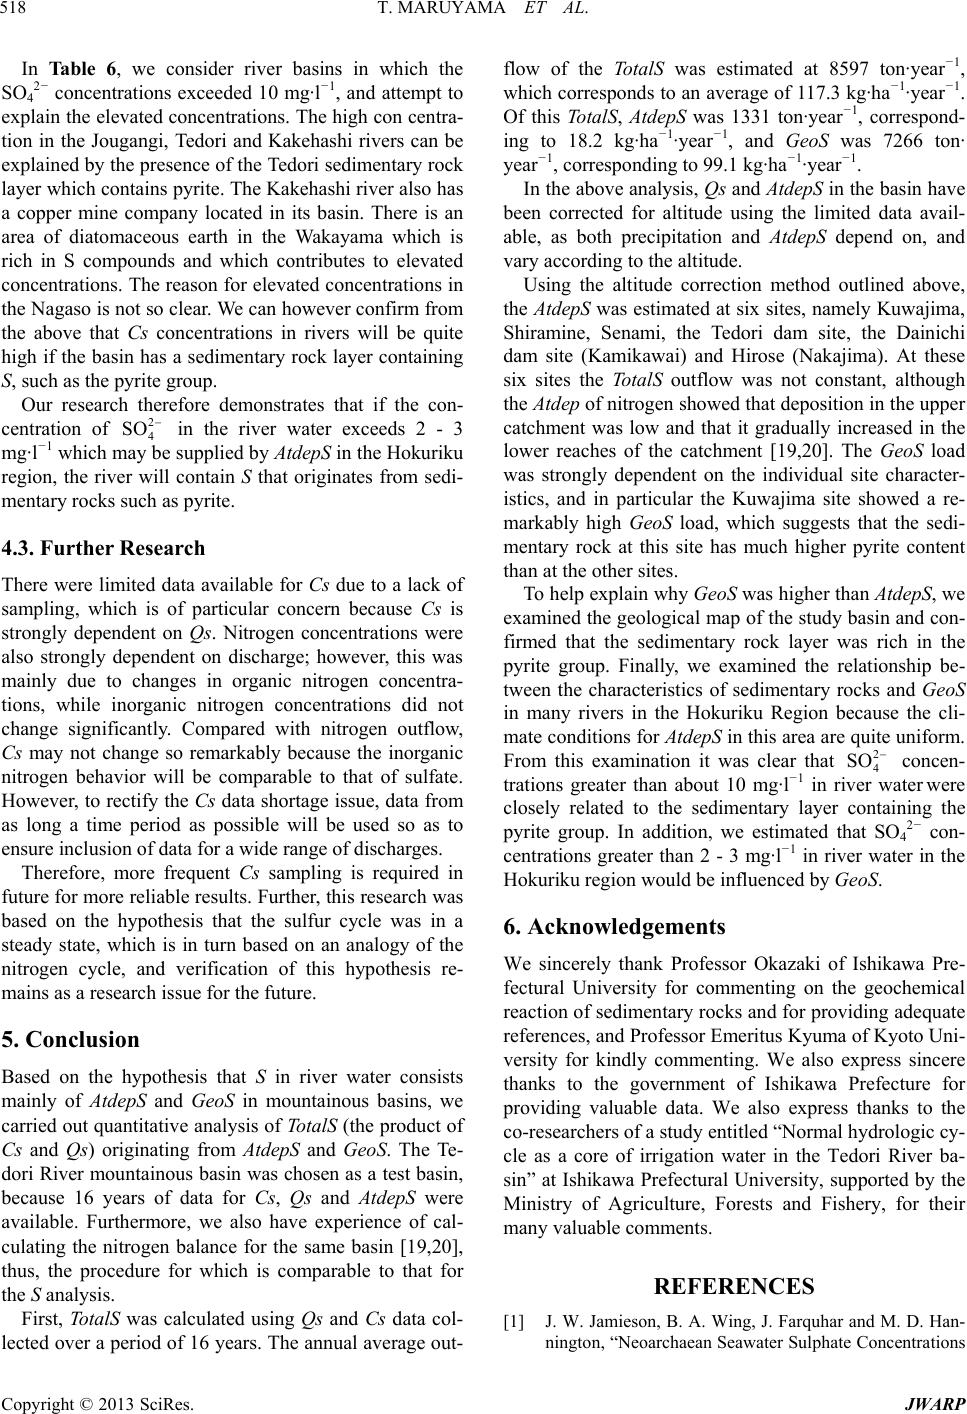 T. MARUYAMA ET AL. 518 In able 6, wider river SO4 2−oncentrad 1 explain the elevaration tion in the Jougri and Ka explained by the pe of the T layer which contains The Ka a coine clocated in area of diatomaceous earth in the rich inompwhich concerations. Ton for elevated co in the Nagaso is n. We can the above that ntratio high ihe basimentary rock , s nge of discharges. nt Cs sampling is required in Cs data col- lected over a period of 16 years. The annual average out- flow of talS estimated at 8597 ton·year−1, hich cornds erage of 117.3 kg·ha−1·year−1. Of this TAtde as 1d- ing to 1·ha−r−1, n· year−1, coondin99.1 kg·ha·year . In the abo analQs and AtdepS in the basin have been corrected for altitude using the limited data avail- able, as bn and AtdepS depend on, and Using titudmethod utlined above, the Atdep esti at six sites, namely Kuwajima, ramine, SenamiTedori dam site, the Dainichi site (aw Hirose (Nakajima). At these six sites totalS ow was not constant, although en showed that deposition in the upper and that it gradually increased in the Te cons basins in which the ctions exceede0 mg·l−1, and attempt to w ted concents. The high con centra- angi, Tedokehashi rivers can be resenc pyrite. edori sedimentary rock kehashi river also has pper mompany its basin. There is an Wakayama which is S counds and contributes to elevated vary according to the altitude. nthe reasncentrations ot so clear however confirm from Cs concens in rivers will be quite Shi dam f tin has a sed layer containing Such as the pyrite group. Our research therefore demonstrates that if the con- centration of 2 4 SO in the river water exceeds 2 - 3 mg· l −1 which may be supplied by AtdepS in the Hokuriku region, the river will contain S that originates from sedi- mentary rocks such as pyrite. 4.3. Further Research There were limited data available for Cs due to a lack of sampling, which is of particular concern because Cs is strongly dependent on Qs. Nitrogen concentrations were also strongly dependent on discharge; however, this was mainly due to changes in organic nitrogen concentra- tions, while inorganic nitrogen concentrations did not change significantly. Compared with nitrogen outflow, Cs may not changeso remarkably because the inorganic nitrogen behavior will be comparable to that of sulfate. However, to rectify the Cs data shortage issue, data from as long a time period as possible will be used so as to ensure inclusion of data for a wide ra Therefore, more freque future for more reliable results. Further, this research was based on the hypothesis that the sulfur cycle was in a steady state, which is in turn based on an analogy of the nitrogen cycle, and verification of this hypothesis re- mains as a research issue for the future. 5. Conclusion Based on the hypothesis that S in river water consists mainly of AtdepS and GeoS in mountainous basins, we carried out quantitative analysis of TotalS (the product of Cs and Qs) originating from AtdepS and GeoS. The Te- dori River mountainous basin was chosen as a test basin, because 16 years of data for Cs, Qs and AtdepS were available. Furthermore, we also have experience of cal- culating the nitrogen balance for the same basin [19,20], thus, the procedure for which is comparable to that for the S analysis. First, TotalS was calculated using Qs and the To was respoto an av otalS, pS w 1 331 ton·year−1, correspon 8.2 kg·yea and GeoS was 7266 to −1−1 rresp ve g to ysis, oth precipitatio the ale correction o S wasmated , the Kamik he T ai) and outfl the Atdep of nitrog catchment was low lower reaches of the catchment [19,20]. The GeoS load was strongly dependent on the individual site character- istics, and in particular the Kuwajima site showed a re- markably high GeoS load, which suggests that the sedi- mentary rock at this site has much higher pyrite content than at the other sites. To help explain why GeoS was higher than AtdepS, we examined the geological map of the study basin and con- firmed that the sedimentary rock layer was rich in the pyrite group. Finally, we examined the relationship be- tween the characteristics of sedimentary rocks and GeoS in many rivers in the Hokuriku Region because the cli- mate conditions for AtdepS in this area are quite uniform. From this examination it was clear that 2 4 SO concen- trations greater than about 10 mg·l−1 in river water were closely related to the sedimentary layer containing the pyrite group. In addition, we estimated that SO4 2− con- ce −1 ntrations greater than 2 - 3 mg·l in river water in the Hokuriku region would be influenced by GeoS. 6. Acknowledgements We sincerely thank Professor Okazaki of Ishikawa Pre- fectural University for commenting on the geochemical reaction of sedimentary rocks and for providing adequate references, and Professor Emeritus Kyuma of Kyoto Uni- versity for kindly commenting. We also express sincere thanks to the government of Ishikawa Prefecture for providing valuable data. We also express thanks to the co-researchers of a study entitled “Normal hydrologic cy- cle as a core of irrigation water in the Tedori River ba- sin” at Ishikawa Prefectural University, supported by the Ministry of Agriculture, Forests and Fishery, for their many valuable comments. REFERENCES [1] J. W. Jamieson, B. A. Wing, J. Farquhar and M. D. Han- nington, “Neoarchaean Seawater Sulphate Concentrations Copyright © 2013 SciRes. JWARP  T. MARUYAMA ET AL. 519 from Sulphur Isotopes in Massive Sulphide Ore,” Nature Geosciene, Vol. 6, No. 1, 2013, pp. 61-64. [2] R. J. Newton, E. L. Pevitt, P. B. Wignall and S. H. Bot- trell, “Large Shifts in the Isotopic Comon of Sea- water Sulphate across the Permo-Triassic Boundary in Northern Italy,” Earth and Planetary Science Letters, Vol. 218, No. 3-4, 2004, pp. 331-345. positi doi:10.1016/S0012-821X(03)00676-9 [3] A. Ooki, “Size-Resolved Sulfate and Ammonium Meas- urements in Marine Boundary Layer over the North and tional Repositories, Vol . South Pacific,” Japanese Institu 41, No. 1, 2007, pp. 81-91. [4] A. L. Norman, W. Belzer and L. Barrie, “Insights into the Biogenic Contribution to Total Sulphate in Aerosol and Precipitation in the Fraser Valley Afforded by Isotopes of Sulphur and Oxygen,” Journal of Geophysical Research- Atmospheres, Vol. 109, No. D5, 2004. doi:10.1029/2002JD003072 [5] M. C. Eimers and P. J. Dillon, “Climate Effects on Sul- phate Flux from Forested Catchments in South-Central Ontario,” Biogeochemistry, Vol. 61, No. 3, 2002 pp. 337- 355. doi:10.1023/A:1020261913618 [6] W. M. Lewis Jr. and M. C. Grant, “Changes in the Output of Ions from a Watershed as a Result of the Acidification of Precipitation,” Ecology, Vol. 60, No. 6, 1979, pp. 1093- 1097. [7] E. Beaulieu, Y. elandt, D. C mels and J. Gaater-Rock Interac- hemical 6, 2005, pp. 773- Godderis, D. Labat, C. Ro illardet, “Modeling of W al- tion in the Mackenzie Basin; Competition between Sulfu- ric and Carbonic Acids,” Elsevier, Amsterdam. [8] L.-M. Hang, G.-L. Zhang and J.-L. Yang, “Weathering and Soil Formation Rates Based on Geo C Mass Balance in a Small Forested Watersheds under Acid Pre- cipitation in Subtropical China Catena,” CATENA, Vol. 105, 2013, pp. 11-20. [9] M. Budakoglu, “Sulfur-Isotope Distribution and Conta- mination Related to the Balya Pb-Zn Mine in Turkey,” Environmental Geology, Vol. 47, No. 781. doi:10.1007/s00254-004-1202-1 [10] M. Edraki, S. D. Golding, K. A. Baublys and M. G. Law- rence, “Hydrochemistry, Mineralogy and Sulfur Isotope Geochemistry of Acid Mine Drainage at the Mt. Morgan Mine Environment, Queensland, Australia,” Pergamon Oxford, New York and Beijing, International, GeoRef. [11] M. Aikawa, T. Hiraki, Y. Komai, U. Satoshi and N. To- aka, “Relationship between Nitro- 2013.53029 kuch, “A Case Study on Input-Output of Sulfur in a Catchment Area in Japan,” Journal of Atmosphere Envi- ronment, Vol. 43, No. 1, 2008, pp. 23-30. [12] T. Maruyama, M. Yoshida, K. Takase, H. Takimoto, S. Ishikawa and S. Nagas gen Atmospheric Deposition, Discharge and Concentra- tion, and Monthly Change of Those in a River, Japan,” Journal of Water Resources and Protection, Vol. 5, No. 3, 2013, pp. 283-293. doi:10.4236/jwarp. ort of nt, “Forth Report of Lowland in South- . [13] T. Maruyama and M. Yoshida, “Relation between Rain- fall Deposit, Nitrogen Concentration and Discharge Height,” Applied Hydrology, 2013, pp. 1-14. [14] Shiramine, “History of Shiramine,” Vol. 1, 1961, pp. 18- 20. [15] Oguch, “History of Oguch,” Ishikawa Prefecture, Vol. 1, 1978, pp. 66-74. [16] Construction Bureau of Hokuriku Region, “Kanazawa Office of Construction Works, History of Flood Control,” 1985, pp. 13-15. [17] Ishikawa Prefecture, “Investigation Report on Environ- ment and Air. 2006-2010,” Research Institute of Ishikawa Environment and Health, 2007-2011. [18] Japanese Association of Environment, “Forth Rep Acid Rainfall in Japan 2005,” Environment Research Committee, 2007. [19] Japanese Association of Environme Acid Rainfall in Japan, 2006,” Environment Research Committee, 2008. [20] Japanese Association of Environment, “Forth Report of Acid Rainfall in Japan, 2007,” Environment Research Committee, 2009. [21] Ishikawa Prefecture Water Supply Office of Tedori River, “Annual Report of Water Quality, 1977-2011,” [22] “Geological Map of Ishikawa Prefecture,” www.jisuberi-kyokai.or.jp/kobetu/isikawa/okada/12.html [23] Tropical Agricultural Center, “Swampy Asian Countries,” Tropical Agricultural Center, 1986. [24] J. Kobayashi, “Health Examination of River Water, Iwa- nami Series,” 1971 Copyright © 2013 SciRes. JWARP
|