Paper Menu >>
Journal Menu >>
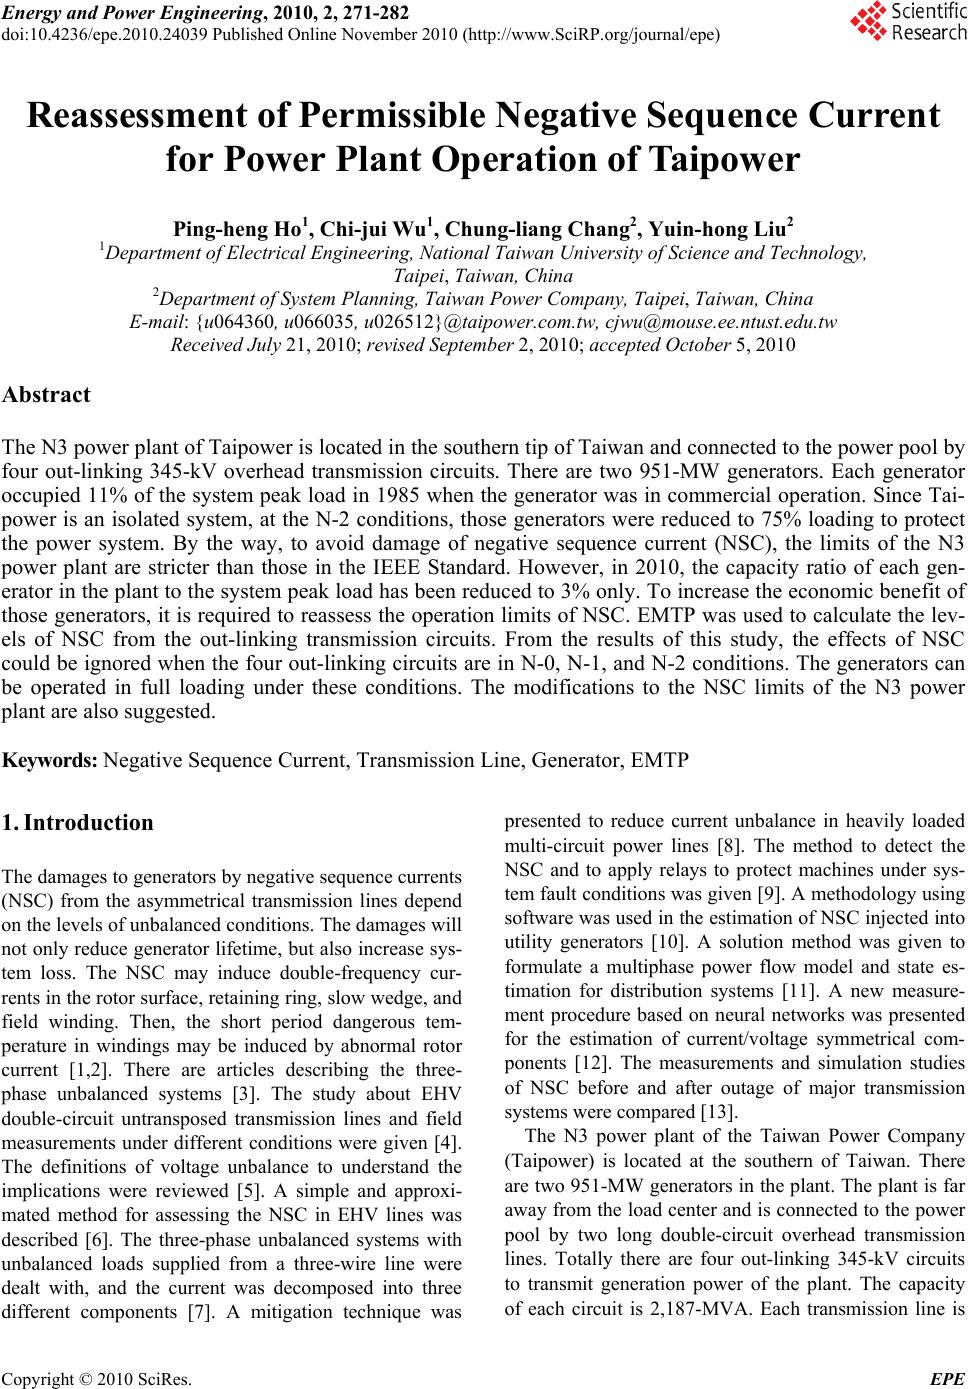 Energy and Power Engineering, 2010, 2, 271-282 doi:10.4236/epe.2010.24039 Published Online November 2010 (http://www.SciRP.org/journal/epe) Copyright © 2010 SciRes. EPE Reassessment of Permissible Negative Sequence Current for Power Plant Operation of Taipower Ping-heng Ho1, Chi-jui Wu1, Chung-liang Chang2, Yuin-hong Liu2 1Department of Electrical Engineering, National Taiwan University of Science and Technology, Taipei, Taiwan, China 2Department of System Planning, Taiwan Power Company, Taipei, Taiwan, China E-mail: {u064360, u066035, u026 512}@taipower.com.tw, cjwu@mouse.ee.ntust.edu.tw Received July 21, 2010; revised September 2, 2010; accepted October 5, 2010 Abstract The N3 power plant of Taipower is located in the southern tip of Taiwan and connected to the power pool by four out-linking 345-kV overhead transmission circuits. There are two 951-MW generators. Each generator occupied 11% of the system peak load in 1985 when the generator was in commercial operation. Since Tai- power is an isolated system, at the N-2 conditions, those generators were reduced to 75% loading to protect the power system. By the way, to avoid damage of negative sequence current (NSC), the limits of the N3 power plant are stricter than those in the IEEE Standard. However, in 2010, the capacity ratio of each gen- erator in the plant to the system peak load has been reduced to 3% only. To increase the economic benefit of those generators, it is required to reassess the operation limits of NSC. EMTP was used to calculate the lev- els of NSC from the out-linking transmission circuits. From the results of this study, the effects of NSC could be ignored when the four out-linking circuits are in N-0, N-1, and N-2 conditions. The generators can be operated in full loading under these conditions. The modifications to the NSC limits of the N3 power plant are also suggested. Keywords: Negative Sequence Current, Transmission Line, Generator, EMTP 1. Introduction The damages to generators by negative sequence currents (NSC) from the asymmetrical transmission lines depend on the levels of unbalanced conditions. The damages will not only reduce generator lifetime, but also increase sys- tem loss. The NSC may induce double-frequency cur- rents in the rotor surface, retaining ring, slow wedge, and field winding. Then, the short period dangerous tem- perature in windings may be induced by abnormal rotor current [1,2]. There are articles describing the three- phase unbalanced systems [3]. The study about EHV double-circuit untransposed transmission lines and field measurements under different conditions were given [4]. The definitions of voltage unbalance to understand the implications were reviewed [5]. A simple and approxi- mated method for assessing the NSC in EHV lines was described [6]. The three-phase unbalanced systems with unbalanced loads supplied from a three-wire line were dealt with, and the current was decomposed into three different components [7]. A mitigation technique was presented to reduce current unbalance in heavily loaded multi-circuit power lines [8]. The method to detect the NSC and to apply relays to protect machines under sys- tem fault conditions was given [9]. A methodology using software was used in the estimation of NSC injected into utility generators [10]. A solution method was given to formulate a multiphase power flow model and state es- timation for distribution systems [11]. A new measure- ment procedure based on neural networks was presented for the estimation of current/voltage symmetrical com- ponents [12]. The measurements and simulation studies of NSC before and after outage of major transmission systems were compared [13]. The N3 power plant of the Taiwan Power Company (Taipower) is located at the southern of Taiwan. There are two 951-MW generators in the plant. The plant is far away from the load center and is connected to the power pool by two long double-circuit overhead transmission lines. Totally there are four out-linking 345-kV circuits to transmit generation power of the plant. The capacity of each circuit is 2,187-MVA. Each transmission line is 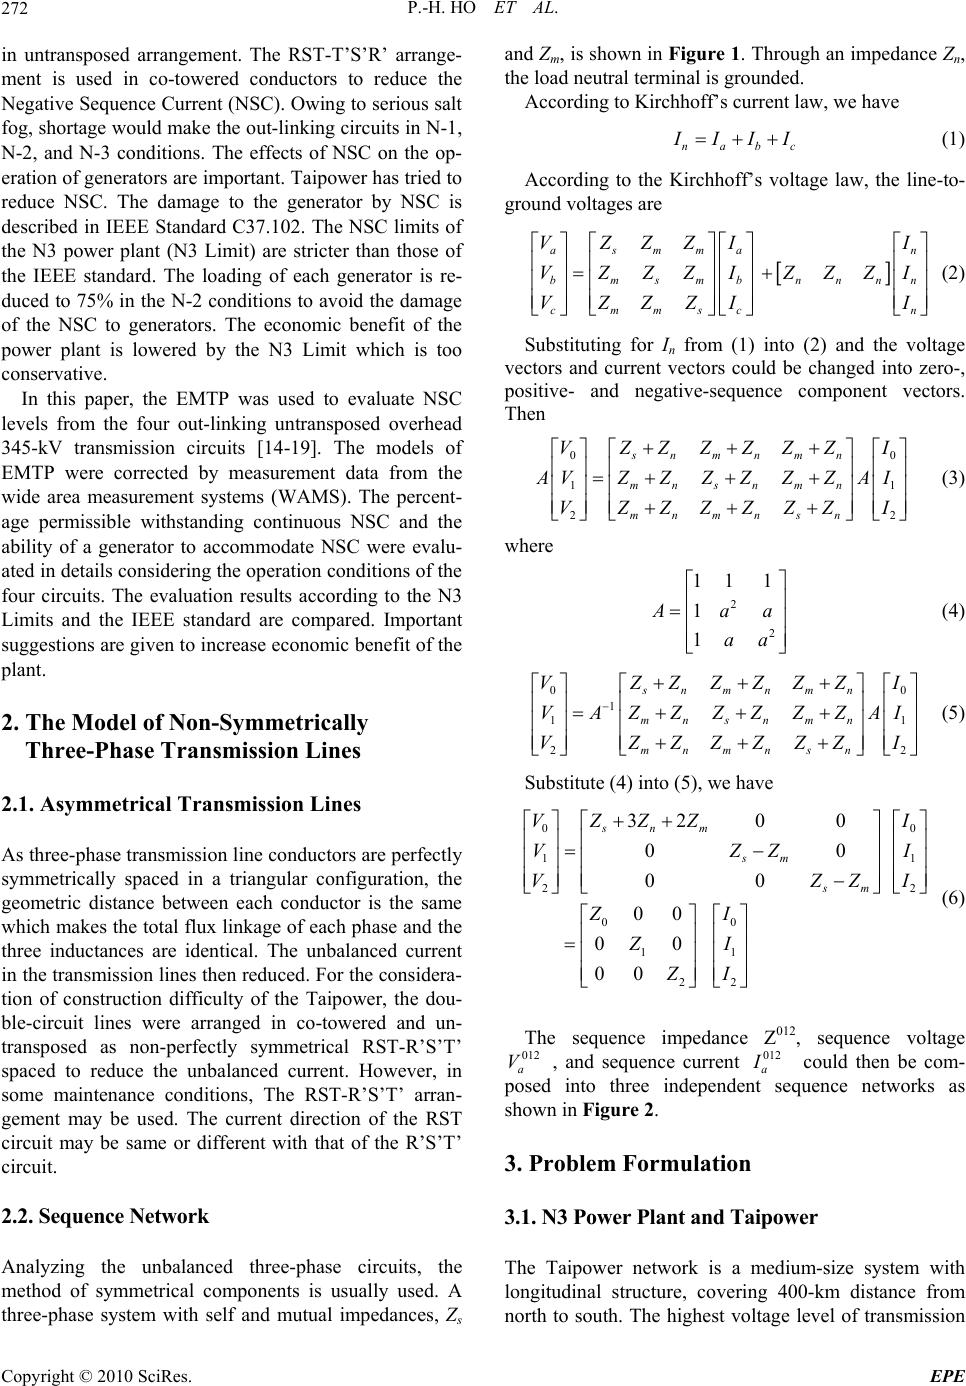 P.-H. HO ET AL. Copyright © 2010 SciRes. EPE 272 in untransposed arrangement. The RST-T’S’R’ arrange- ment is used in co-towered conductors to reduce the Negative Sequence Current (NSC). Owing to serious salt fog, shortage would make the out-linking circuits in N-1, N-2, and N-3 conditions. The effects of NSC on the op- eration of generators are important. Taipower has tried to reduce NSC. The damage to the generator by NSC is described in IEEE Standard C37.102. The NSC limits of the N3 power plant (N3 Limit) are stricter than those of the IEEE standard. The loading of each generator is re- duced to 75% in the N-2 conditions to avoid the damage of the NSC to generators. The economic benefit of the power plant is lowered by the N3 Limit which is too conservative. In this paper, the EMTP was used to evaluate NSC levels from the four out-linking untransposed overhead 345-kV transmission circuits [14-19]. The models of EMTP were corrected by measurement data from the wide area measurement systems (WAMS). The percent- age permissible withstanding continuous NSC and the ability of a generator to accommodate NSC were evalu- ated in details considering the operation conditions of the four circuits. The evaluation results according to the N3 Limits and the IEEE standard are compared. Important suggestions are given to increase economic benefit of the plant. 2. The Model of Non-Symmetrically Three-Phase Transmission Lines 2.1. Asymmetrical Transmission Lines As three-phase transmission line conductors are perfectly symmetrically spaced in a triangular configuration, the geometric distance between each conductor is the same which makes the total flux linkage of each phase and the three inductances are identical. The unbalanced current in the transmission lines then reduced. For the considera- tion of construction difficulty of the Taipower, the dou- ble-circuit lines were arranged in co-towered and un- transposed as non-perfectly symmetrical RST-R’S’T’ spaced to reduce the unbalanced current. However, in some maintenance conditions, The RST-R’S’T’ arran- gement may be used. The current direction of the RST circuit may be same or different with that of the R’S’T’ circuit. 2.2. Sequence Network Analyzing the unbalanced three-phase circuits, the method of symmetrical components is usually used. A three-phase system with self and mutual impedances, Zs and Zm, is shown in Figure 1. Through an impedance Zn, the load neutral terminal is grounded. According to Kirchhoff’s current law, we have nabc I III (1) According to the Kirchhoff’s voltage law, the line-to- ground voltages are asmma n bm s mbnnnn cmmscn VZZZI I VZZZIZZZI VZZZI I (2) Substituting for In from (1) into (2) and the voltage vectors and current vectors could be changed into zero-, positive- and negative-sequence component vectors. Then 00 11 22 sn mnmn mn sn mn mnmn sn VZZZZZZI A V ZZZZZZAI VZZZZZZI (3) where 2 2 11 1 1 1 A aa aa (4) 00 1 11 22 sn mnmn mn sn mn mnmn sn VZZZZZZI V AZZZZZZAI VZZZZZZI (5) Substitute (4) into (5), we have 00 11 22 00 11 22 32 00 00 00 00 00 00 snm sm sm VZZZI VZZI VZZI ZI ZI ZI (6) The sequence impedance Z012, sequence voltage 012 a V, and sequence current 012 a I could then be com- posed into three independent sequence networks as shown in Figure 2. 3. Problem Formulation 3.1. N3 Power Plant and Taipower The Taipower network is a medium-size system with longitudinal structure, covering 400-km distance from north to south. The highest voltage level of transmission 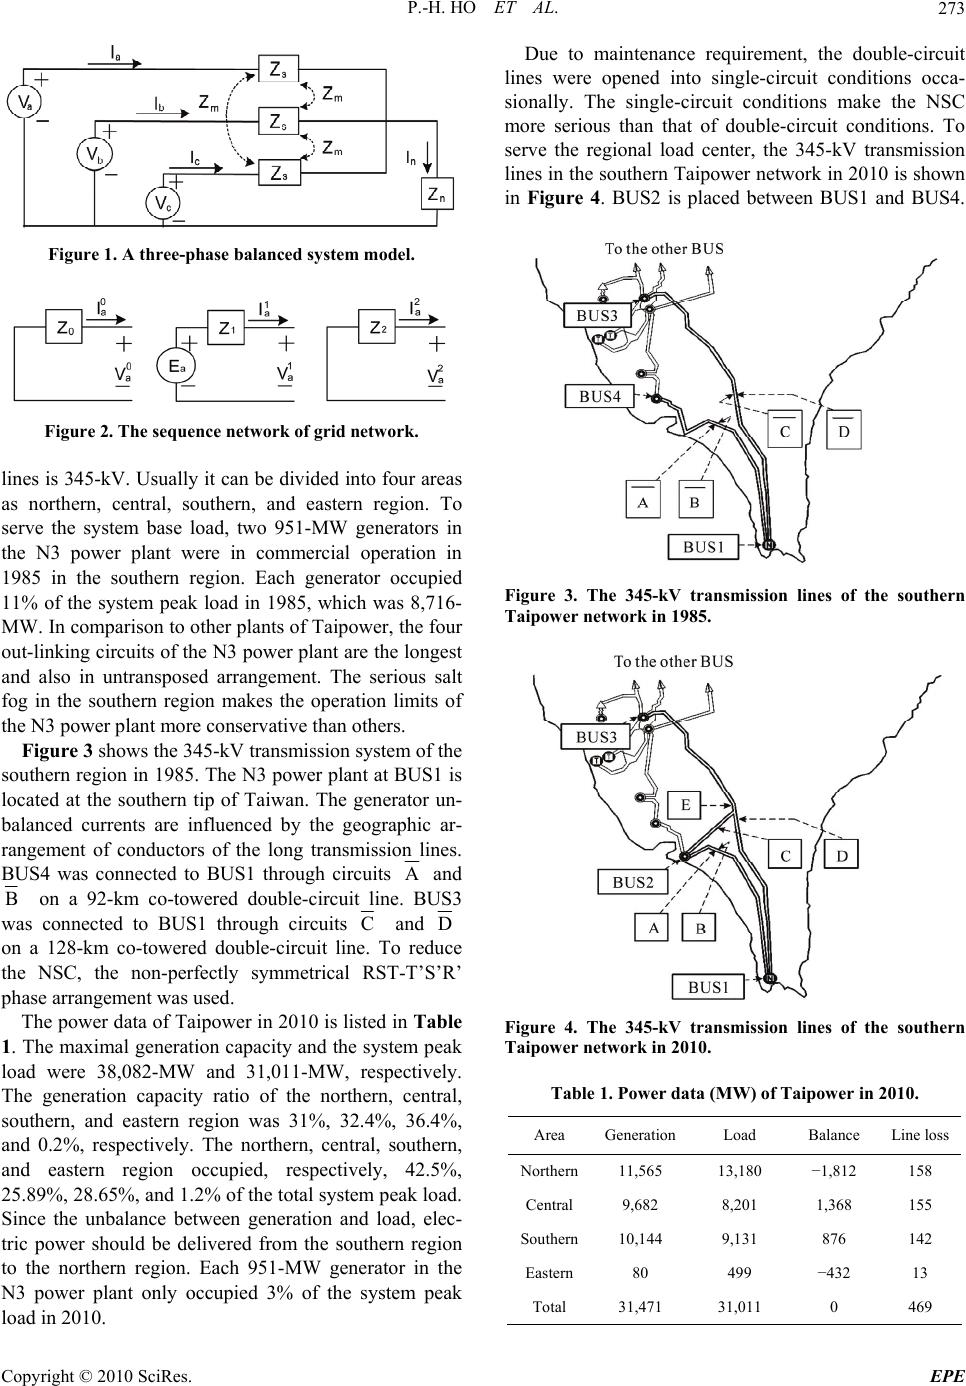 P.-H. HO ET AL. Copyright © 2010 SciRes. EPE 273 Figure 1. A three-phase balanced system model. Figure 2. The sequence network of grid network. lines is 345-kV. Usually it can be divided into four areas as northern, central, southern, and eastern region. To serve the system base load, two 951-MW generators in the N3 power plant were in commercial operation in 1985 in the southern region. Each generator occupied 11% of the system peak load in 1985, which was 8,716- MW. In comparison to other plants of Taipower, the four out-linking circuits of the N3 power plant are the longest and also in untransposed arrangement. The serious salt fog in the southern region makes the operation limits of the N3 power plant more conservative than others. Figure 3 shows the 345-kV transmission system of the southern region in 1985. The N3 power plant at BUS1 is located at the southern tip of Taiwan. The generator un- balanced currents are influenced by the geographic ar- rangement of conductors of the long transmission lines. BUS4 was connected to BUS1 through circuits A and B on a 92-km co-towered double-circuit line. BUS3 was connected to BUS1 through circuits C and D on a 128-km co-towered double-circuit line. To reduce the NSC, the non-perfectly symmetrical RST-T’S’R’ phase arrangement was used. The power data of Taipower in 2010 is listed in Table 1. The maximal generation capacity and the system peak load were 38,082-MW and 31,011-MW, respectively. The generation capacity ratio of the northern, central, southern, and eastern region was 31%, 32.4%, 36.4%, and 0.2%, respectively. The northern, central, southern, and eastern region occupied, respectively, 42.5%, 25.89%, 28.65%, and 1.2% of the total system peak load. Since the unbalance between generation and load, elec- tric power should be delivered from the southern region to the northern region. Each 951-MW generator in the N3 power plant only occupied 3% of the system peak load in 2010. Due to maintenance requirement, the double-circuit lines were opened into single-circuit conditions occa- sionally. The single-circuit conditions make the NSC more serious than that of double-circuit conditions. To serve the regional load center, the 345-kV transmission lines in the southern Taipower network in 2010 is shown in Figure 4. BUS2 is placed between BUS1 and BUS4. Figure 3. The 345-kV transmission lines of the southern Taipower network in 1985. Figure 4. The 345-kV transmission lines of the southern Taipower network in 2010. Table 1. Power data (MW) of Taipower in 2010. Area GenerationLoad Balance Line loss Northern11,565 13,180 −1,812 158 Central 9,682 8,201 1,368 155 Southern10,144 9,131 876 142 Eastern 80 499 −432 13 Total 31,471 31,011 0 469 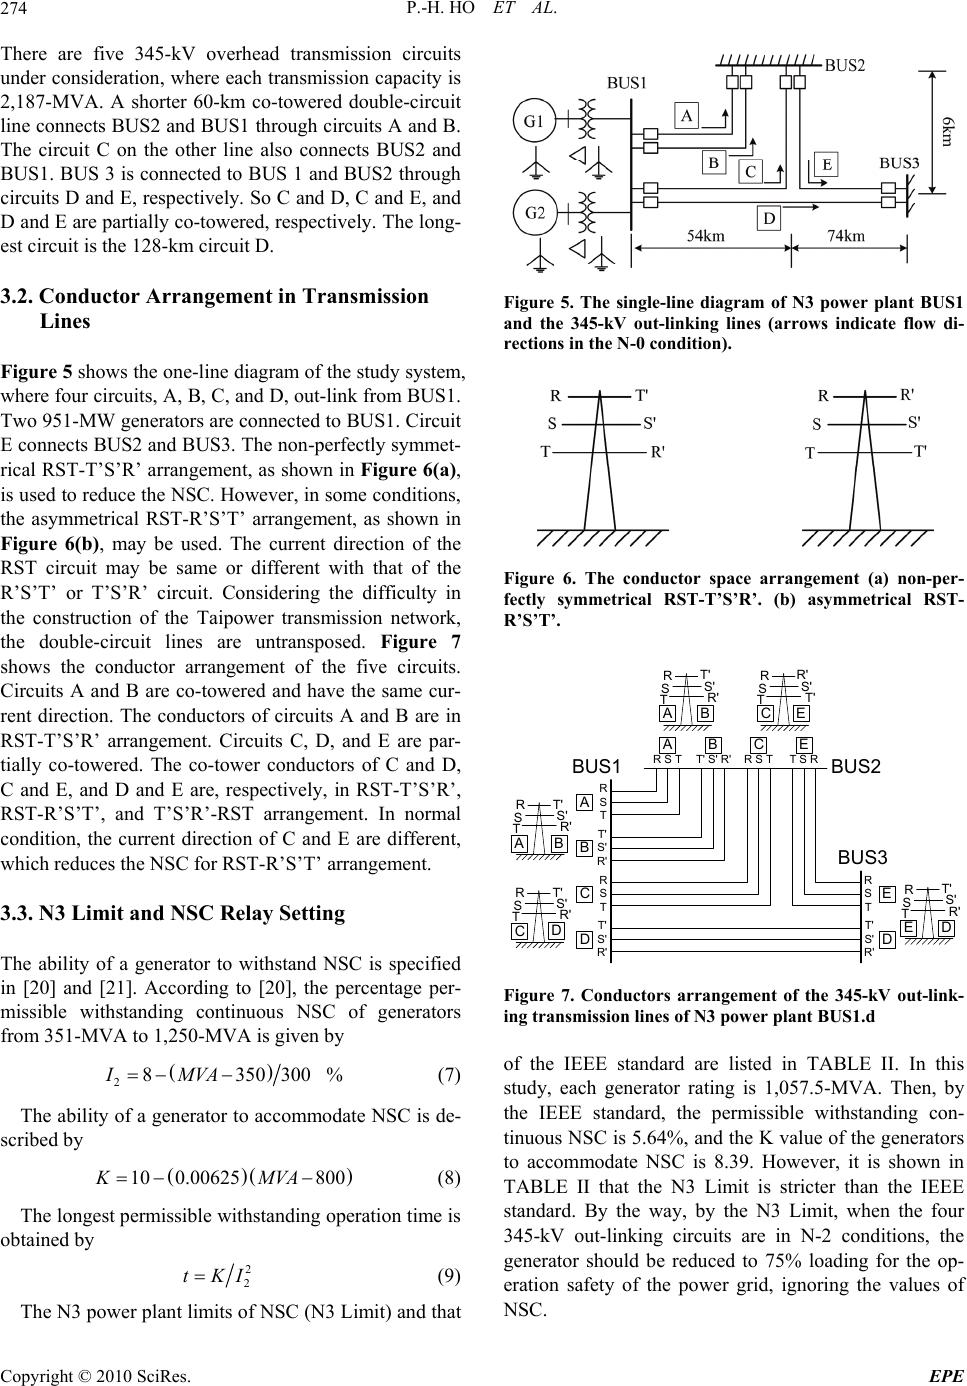 P.-H. HO ET AL. Copyright © 2010 SciRes. EPE 274 There are five 345-kV overhead transmission circuits under consideration, where each transmission capacity is 2,187-MVA. A shorter 60-km co-towered double-circuit line connects BUS2 and BUS1 through circuits A and B. The circuit C on the other line also connects BUS2 and BUS1. BUS 3 is connected to BUS 1 and BUS2 through circuits D and E, respectively. So C and D, C and E, and D and E are partially co-towered, respectively. The long- est circuit is the 128-km circuit D. 3.2. Conductor Arrangement in Transmission Lines Figure 5 shows the one-line diagram of the study system, where four circuits, A, B, C, and D, out-link from BUS1. Two 951-MW generators are connected to BUS1. Circuit E connects BUS2 and BUS3. The non-perfectly symmet- rical RST-T’S’R’ arrangement, as shown in Figure 6(a), is used to reduce the NSC. However, in some conditions, the asymmetrical RST-R’S’T’ arrangement, as shown in Figure 6(b), may be used. The current direction of the RST circuit may be same or different with that of the R’S’T’ or T’S’R’ circuit. Considering the difficulty in the construction of the Taipower transmission network, the double-circuit lines are untransposed. Figure 7 shows the conductor arrangement of the five circuits. Circuits A and B are co-towered and have the same cur- rent direction. The conductors of circuits A and B are in RST-T’S’R’ arrangement. Circuits C, D, and E are par- tially co-towered. The co-tower conductors of C and D, C and E, and D and E are, respectively, in RST-T’S’R’, RST-R’S’T’, and T’S’R’-RST arrangement. In normal condition, the current direction of C and E are different, which reduces the NSC for RST-R’S’T’ arrangement. 3.3. N3 Limit and NSC Relay Setting The ability of a generator to withstand NSC is specified in [20] and [21]. According to [20], the percentage per- missible withstanding continuous NSC of generators from 351-MVA to 1,250-MVA is given by 28350300 %IMVA (7) The ability of a generator to accommodate NSC is de- scribed by 10 0.00625800KMVA (8) The longest permissible withstanding operation time is obtained by 2 2 tKI (9) The N3 power plant limits of NSC (N3 Limit) and that Figure 5. The single-line diagram of N3 power plant BUS1 and the 345-kV out-linking lines (arrows indicate flow di- rections in the N-0 condition). Figure 6. The conductor space arrangement (a) non-per- fectly symmetrical RST-T’S’R’. (b) asymmetrical RST- R’S’T’. R S TR' S' T' R S TT' S' R' R S TR' S' T' R S TR' S' T' R S TR' S' T' R S T T' S' R' R S T T' S' R' R S TT' S' R'R S TT S R R S T T' S' R' A B C D E D ABC E E D CD A B ABC E BUS1 BUS3 BUS2 Figure 7. Conductors arrangement of the 345-kV out-link- ing transmission lines of N3 power plant BUS1.d of the IEEE standard are listed in TABLE II. In this study, each generator rating is 1,057.5-MVA. Then, by the IEEE standard, the permissible withstanding con- tinuous NSC is 5.64%, and the K value of the generators to accommodate NSC is 8.39. However, it is shown in TABLE II that the N3 Limit is stricter than the IEEE standard. By the way, by the N3 Limit, when the four 345-kV out-linking circuits are in N-2 conditions, the generator should be reduced to 75% loading for the op- eration safety of the power grid, ignoring the values of NSC.  P.-H. HO ET AL. Copyright © 2010 SciRes. EPE 275 Table 2. The NSC limits of generator in N3 Limit and IEEE Standard. N3 Limit IEEE Standard percentage permissible withstand- ing continuous NSC 5% 5.64% ability of a generator to accom- modate NSC (K) 7 8.39 generator loading in N-2 condition of four out-linking circuit 75% - 4. Assessment Method 4.1. NSC Expression The expression of NSC is based on [20] and [21]. The normalized NSC of transmission circuits is defined as 2, 100% L Negativesequencecurrent IPositivesequencecurrent (10) For the generators, it is defined as 2, 100% G Negative sequence current IRated stator current (11) 4.2. EMTP Models The analysis models were established in EMTP. The LINE CONSTANTS supporting routines of EMTP could be used to solve the steady-state problems, considering complicated coupling effects under the power frequency [22]. According to the data about tower types, geometri- cal space, line material, conductor specification, and length, the transmission circuit matrices [R], [L], and [C] are calculated. The standard type A, 345-kV steel towers are used. The cross section of the power line corridor is shown in Figure 8. The resistance of the tower to ground is 10-20 ohms. The characteristics of conductors are listed in Ta- ble 3. The conductor type and circuit length are listed in Table 4. The 795-MCM (26/7) ACSR/AW conductors are used. The radius of the conductor is 2.8143 cm. The DC resistance is 0.064907 ohm/km in 20 degrees Celsius. The bundling and skin effects are considered. The radius of the overhead grounded wire is 1.632 cm. Its DC resis- tance is 0.275 ohm/km in 20 degrees Celsius. Each 23.75/345-kV, △-Y connected main transformer of generators consists of three single-phase units. The rating of each single-phase unit is 336-MVA. The equi- valent impedance, Zps, is 0.2289 + j17.0256 ohm/phase. The exciting admittance is 273.43-j825.64 micro-siemens /phase. In the open-circuit test, there are 100% voltage, 0.075% current, and 170-kW loss. In the short-circuit test, there are 14.4% impedance and 660-kW loss. 4.3. Adjustment of EMTP Model by WAMS The data in the EMTP model were adjusted by the wide area measurement systems (WAMS). In order to monitor the dynamic and transient behaviors of the 345-kV net- work, Taipower had installed 10 phasor measurement units (PMU). Figure 9 shows the schematic arrangement of the WAMS hardware. The functions include power system real-time monitoring, analysis of dynamical be- haviors, fault recording, and steady state analysis of phasor recording. The block diagram of the PMU in WAMS is shown in Figure 10. The PMU is composed of the signal condi- Figure 8. Cross section of the 345kV power line corridor. Figure 9. Schematic arrangement of the WAMS hardware. Figure 10. Block diagram of synchronous phasor measure- ment unit.  P.-H. HO ET AL. Copyright © 2010 SciRes. EPE 276 Table 3. Parameters of 345-kv conductors. Phase Radius (cm) DC esistance (ohm/km) Horiz (m)Vtower (m)Vmid (m)Separ (cm) Per Phase Conductor Number R 1.408 0.064907 −7.05 34.35 30.35 40 4 S 1.408 0.064907 −7.4 25.45 21.45 40 4 T 1.408 0.064907 −7.8 16.5 12.5 40 4 R’ 1.408 0.064907 7.8 16.5 12.5 40 4 S’ 1.408 0.064907 7.4 25.45 21.45 40 4 T’ 1.408 0.064907 7.05 34.35 30.35 40 4 0 0.816 0.275 −8 45.35 41.35 0 1 0 0.816 0.275 8 45.35 41.35 0 1 Table 4. Conductor type and Length of 345-kv circuit. Circuit Conductor Type Length (km) A ACSR795Q/26 60 B ACSR795Q/26 60 C ACSR795Q 60 D ACSR795Q 128 E ACSR795Q 80 tioning unit (SCU), the measurement unit (MU), and the satellite signal synchronizing unit (SSU). To acquire the phase angles and bus frequency data among substations, the time stamp of the PMU is the same as the global po- sitioning system (GPS). The data are then computed by using the discrete Fourier transform algorithm on a common time base. The symmetrical components of voltages and currents are computed from the instantane- ous values. In this study, the data from WAMS of the four out-linking circuits at BUS1 and the inter-linking circuit between BUS2 and BUS3, as shown in Figure 5, were adopted. The measurement values from WAMS are used to correct the models in EMTP. Table 5 gives six meas- urement cases to adjust the EMTP models. The models are modified until the simulation results and the meas- urement values are approximated. 5. Assessment Results with Two Generators Connected Two generators are connected to BUS1. The output power of each generator is 951-MW. Considering the four out-linking circuits from BUS1, the N-0 condition means that the four circuits are used normally. The N-1, N-2, N-3, and N-4 conditions mean that 1, 2, 3, and 4 circuits, respectively, have been opened. Then, there are 32 study cases, as listed in Table 6. The I2,G and I2,L were calculated by EMTP. The results of the longest permissi- ble withstanding operation time were calculated by the N3 Limit and IEEE Standard. 5.1. N-0 and N-1 Conditions In N-0 conditions, such as Cases 0-A and 0-B, I2,G are 1.665% and 2.016%, respectively. In N-1 conditions, there are 8 cases, i.e., Case 1-1A to Case 1-4B, and I2,G lies in 1.952% to 3.297%. Then, the generators would not be affected by NSC. 5.2. N-2 Conditions In N-2 conditions, there are four cases with co-towered arrangement. They are Case 2-1A, Case 2-1B, Case 2-6A, and Case 2-6B. In these cases, I2,G lies in 1.915% to 3.532%. The generators would not be affected by NSC. Table 5. Measurement cases of circuits for EMTP model adjustment. Circuit WAMS Case ABCDE Date Time 0-A XXXXX 2007.08.02 16:50:00 0-B XXXX- 2007.03.27 04:20:00 1-1A -XXXX 2007.05.21 02:48:00 1-2AX -XXX 2007.02.12 08:00:00 1-3AXX -XX 2007.05.18 06:24:00 1-4AXX X -X 2006.10.11 07:52:00 Note: “X” circuits closed, “-” circuits opened  P.-H. HO ET AL. Copyright © 2010 SciRes. EPE 277 Table 6. I2,G, I2,L, and the longest permissible withstanding operation time of generators. I2,L (%) Out-linking circuit Inter-linking circuit Longest permissible withstanding operation time (Min) I 2 Condition Case I2,G (%) A B C D E N3 Limit IEEE Standard 0-A 1.665 0.76 1.31 1.97 3.39 2.79 ∞ ∞ N-0 0-B 2.016 0.42 0.83 0.82 6.27 - ∞ ∞ 1-1A 3.071 - 4.78 1.42 2.94 2.16 ∞ ∞ 1-1B 3.297 - 4.44 0.54 4.93 - ∞ ∞ 1-2A 3.013 4.55 - 1.58 2.73 2.16 ∞ ∞ 1-2B 3.233 4.29 - 0.65 4.96 - ∞ ∞ 1-3A 2.339 1.04 1.42 - 6.32 0.66 ∞ ∞ 1-3B 2.733 0.71 0.73 - 7.94 - ∞ ∞ 1-4A 2.461 1.01 1.08 5.91 - 9.04 ∞ ∞ N-1 1-4B 1.952 0.3 0.65 5.38 - - ∞ ∞ 2-1A 3.532 - - 3.64 3.33 5.44 ∞ ∞ 2-1B 2.284 - - 3.42 4.32 - ∞ ∞ 2-2A 5.383 - 4.94 - 6 3.19 40.26 ∞ 2-2B 5.545 - 4.8 - 6.63 - 37.98 ∞ 2-3A 4.776 - 4.76 4.32 - 10.42 ∞ ∞ 2-3B 3.986 - 4.14 3.7 - - ∞ ∞ 2-4A 5.188 4.76 - - 5.89 1.64 43.38 ∞ 2-4B 5.352 4.56 - - 6.67 - 40.74 ∞ 2-5A 4.715 4.5 - 4.34 - 10.54 ∞ ∞ 2-5B 3.974 3.91 - 3.88 - - ∞ ∞ 2-6A 2.492 3.45 2.61 - - 9.35 ∞ ∞ N-2 2-6B 1.915 1.81 2.05 - - - ∞ ∞ 3-1A 9.564 - - - 9 29.76 12.78 15.29 3-1B 8.661 - - - 8.2 - 15.54 18.64 3-2A 6.246 - - 6.3 - 11.34 29.88 35.84 3-2B 5.888 - - 5.82 - - 33.72 40.33 3-3A 6.514 - 6.36 - - 12.47 27.48 32.95 3-3B 5.95 - 5.8 - - - 32.94 39.50 3-4A 6.167 6.23 - - - 12.31 30.66 36.77 N-3 3-4B 5.776 5.69 - - - - 34.98 41.91 4-1A - - - - - - - - N-4 4-1B - - - - - - - - Note: “-” circuits opened  P.-H. HO ET AL. Copyright © 2010 SciRes. EPE 278 Also in some N-2 conditions at different towers and with circuit D being opened, such as Case 2-3A, Case 2-3B, Case 2-5A, and Case 2-5B, I2,G lies in 3.974% to 4.776%. The generators also would not be affected by NSC. In the other N-2 conditions at different towers and with the short length circuits being opened, the 60-km long circuit A or B and the 128-km long circuit D are closed. There are Case 2-2A, Case 2-2B, Case 2-4A, and Case 2-4B, as shown in Figure 11. The value of I2,G lies (a) (b) (c) (d) Figure 11. N-2 conditions at different towers with short length circuits being opened (a) Case 2-2A (circuits A and C being opened), (b) Case 2-2B (circuits A, C, and E being opened), (c) Case 2-4A (circuits B and C being opened), (d) Case 2-4B (circuits B, C, and E being opened). in 5.188% to 5.545%. According to the N3 Limit, the generators would be affected by NSC in these four cases. The longest permissible withstanding operation time of the generators is finite and lies in 37.98 minutes to 43.38 minutes. However, according to the IEEE Standard, the generators would not be affected by NSC. 5.3. N-3 Conditions Figure 12 shows Case 3-1A and Case 3-1B for the N-3 conditions with short length circuits being opened. In these conditions, only one circuit is connected to BUS1. The value of I2,G is 9.564% and 8.661%, respectively. Six cases are given in Figure 13 for the N-3 conditions with long circuit D being opened. The value of I2,G lies in 5.776% to 6.246%. According to the N3 Limit or the IEEE Standard, the generators would be affected by NSC. However, according to the N3 Limit, the longest permis- sible withstanding operation time of the generators is still smaller. By the N3 Limit, the shortest operation time is 12.78 minutes. But it is 15.29 minutes by the IEEE Standard. 5.4. N-4 Conditions When the four out-linking circuits are opened, such as Case 4-1A and Case 4-1B, it is impossible to transmit the power of generators. (a) (b) Figure 12. N-3 conditions with short length circuits being opened (a) Case 3-1A (circuits A, B, and C being opened), (b) Case 3-1B (circuits A, B, C, and E being opened).  P.-H. HO ET AL. Copyright © 2010 SciRes. EPE 279 (a) (b) (c) (d) (e) (f) Figure 13. N-3 conditions with long length circuits being opened (a) Case 3-2A (circuits A, B, and D being opened), (b) Case 3-2B (circuits A, B, D, and E being opened), (c) Case 3-3A (circuits A, C, and D being opened), (d) Case 3-3B (circuits A, C, D, and E being opened), (e) Case 3-4A (circuits B, C, and D being opened), (f) Case 3-4B (circuits B, C, D, and E being opened). 6. Reducing Generator Loading in N-3 Conditions In the N-3 conditions, there is only one out-linking cir- cuit. A 2,187-MVA circuit is still enough to transmit the electric power of two 951-MW generators. However, either by the N3 Limit or the IEEE Standard, the genera- tors would be affected by NSC. To protect the generators, the loading of each generator could be reduced. Table 7 gives the maximal generator loading in N-3 conditions to avoid the effect of NSC according to the IEEE Standard. For example, the loading of each generator should be reduced to 59% in case 3-1A. 7. Assessment Results with One Generator Connected If one of the two generators is under maintenance, only one generator is connected to BUS1. Table 8 gives the assessment results with only one 951-MW generator. In all of the 32 cases, the generator would not be affected by NSC. Table 7. Maximal generator loading in N-3 conditions to avoid effect of NSC. Case Output power of each generator (MW) Loading (%) I2,G (%) Longest permissible withstanding operation time (Min) 3-1A561 59 5.63 ∞ 3-1B619 65 5.63 ∞ 3-2A859 90 5.63 ∞ 3-2B911 96 5.63 ∞ 3-3A823 87 5.63 ∞ 3-3B901 95 5.63 ∞ 3-4A870 91 5.63 ∞ 3-4B929 98 5.63 ∞  P.-H. HO ET AL. Copyright © 2010 SciRes. EPE 280 Table 8. I2,G, I2,L, and the longest permissible withstanding operation time with only one generator connected. I2,L (%) Out-linking circuit Inter linking circuit Longest permissible withstanding operation time (Min) I2 Condition Case I2,G (%) A B C D E N3 Limit IEEE Standard 0-A 0.749 0.342 0.590 0.887 1.526 1.256 ∞ ∞ N-0 0-B 0.907 0.189 0.374 0.369 2.822 - ∞ ∞ 1-1A 1.382 - 2.151 0.639 1.323 0.972 ∞ ∞ 1-1B 1.484 - 1.998 0.243 2.219 - ∞ ∞ 1-2A 1.356 2.048 - 0.711 1.229 0.972 ∞ ∞ 1-2B 1.455 1.931 - 0.293 2.232 - ∞ ∞ 1-3A 1.053 0.468 0.639 - 2.844 0.297 ∞ ∞ 1-3B 1.230 0.320 0.329 - 3.573 - ∞ ∞ 1-4A 1.107 0.455 0.486 2.660 - 4.068 ∞ ∞ N-1 1-4B 0.878 0.135 0.293 2.421 - - ∞ ∞ 2-1A 1.589 - - 1.638 1.499 2.448 ∞ ∞ 2-1B 1.028 - - 1.539 1.944 - ∞ ∞ 2-2A 2.422 - 2.223 - 2.700 1.436 ∞ ∞ 2-2B 2.495 - 2.160 - 2.984 - ∞ ∞ 2-3A 2.149 - 2.142 1.944 - 4.689 ∞ ∞ 2-3B 1.794 - 1.863 1.665 - - ∞ ∞ 2-4A 2.335 2.142 - - 2.651 0.738 ∞ ∞ 2-4B 2.408 2.052 - - 3.002 - ∞ ∞ 2-5A 2.122 2.025 - 1.953 - 4.743 ∞ ∞ 2-5B 1.788 1.760 - 1.746 - - ∞ ∞ 2-6A 1.121 1.553 1.175 - - 4.208 ∞ ∞ N-2 2-6B 0.862 0.815 0.923 - - - ∞ ∞ 3-1A 4.304 - - - 4.050 13.392 ∞ ∞ 3-1B 3.897 - - - 3.690 - ∞ ∞ 3-2A 2.811 - - 2.835 - 5.103 ∞ ∞ 3-2B 2.650 - - 2.619 - - ∞ ∞ 3-3A 2.931 - 2.862 - - 5.612 ∞ ∞ 3-3B 2.678 - 2.610 - - - ∞ ∞ 3-4A 2.775 2.804 - - - 5.540 ∞ ∞ N-3 3-4B 2.599 2.561 - - - - ∞ ∞ 4-1A - - - - - - - - N-4 4-1B - - - - - - - - Note: “-” circuits opened  P.-H. HO ET AL. Copyright © 2010 SciRes. EPE 281 8. Discussion 1) Since the percentage of each generator in the N3 power plant occupying the system peak load has reduced from 11% to 3%, Taipower already has enough spinning reserve to sustain the outage of the N3 power plant. By the way, the two out-linking 345-kV circuits in N-2 con- ditions still have over 100% redundant capacity to transmit the full loading power of the plant. The re- quirement in the N3 Limit of reducing generator loading to 75% in N-2 conditions is suggested to be deleted. 2) By the IEEE Standard, the generators of the N3 power plant in the N-2 conditions would not affected by NSC. It is still suggested that the percentage permissible withstanding continuous NSC and the ability of a gen- erator to accommodate NSC can follow the IEEE stan- dard. Then the two generators can work in full loading in N-2 conditions. 3) In N-3 conditions, there is only one out-linking cir- cuit. It still has enough capacity to transmit the full load- ing power of the two generation in the plant. However, either by the N3 Limit or the IEEE Standard, the effects of NSC can not be ignored if the two generators are op- erated in full loading. 4) Since the N3 is a nuclear power plant, special safety operation rules are required. By the transmission system planning rules of Taipower, a nuclear power plant should have more then two out-linking circuits. It is suggested that if the total system generation capacity is enough, the N3 power plant had better avoid being operated in N-3 conditions. If the total system generation capacity is not enough, the generator loading should be reduced. An- other feasible approach is to shut down one of the gen- erators. 9. Conclusions The levels of NSC from the four asymmetrical out-linking circuits have been examined in details. The effects of NSC on the operation of generators have been investigated by using the N3 Limit and the IEEE Stan- dard. It is revealed that the N3 Limit is stricter than the IEEE standard. It is found from the simulation results that, by the IEEE Standard, the effects of NSC in N-0, N-1, and N-2 conditions could be ignored. If the two generators are operated in full loading, the effects on NSC in N-3 conditions should be paid attention. Since the Taipower already has enough spinning to sustain the outage of the N3 power plant, it is suggested that the limits of NSC in the IEEE Standard could be adopt. The generators could work normally in N-2 conditions. Since the N3 is a nuclear power plant, special safety operation rules are still required. The suggestions on the plant op- eration in N-3 conditions are given, since there is only one out-linking circuits. The simulation results and sug- gestions in this study can increase the economic benefit of the power plant. 10. References [1] W. H. Kersting, “Gauses and Effect of Unbalanced Volt- ages Serving an Induction Moter,” IEEE Transactions on Industry Applications, Vol. 37, No. 1, January/February 2001, pp. 165-170. [2] G. Chicco, P. Postolache and C. Toader, “Analysis of Three-Phase Systems with Neutral under Distorted and Unbalanced Conditions in the Symmetrical Component- Based Framework,” IEEE Transactions on Power Deliv- ery, Vol. 22, No. 1, January 2007, pp. 674-683. [3] W. V. Lyon, “Reactive Power and Unbalanced Circuits,” Electrical World, Vol. 75, No. 25, June 1920, pp. 1417- 1420. [4] M. H. Hesse and J. Sabath, “EHV Double-Circuit Un- transposed Transmission Line-Analysis and Tests,” IEEE Transactions on Power Application System, Vol. PAS-90, No. 3, May 1971, pp. 984-992. [5] P. Pillay and M. Manyage, “Definitions of Voltage Un- balance,” IEEE Power Engineering Review, May 2001, pp. 50-51. [6] M. M. Adibi, D. P. Milanicz and T. L. Volkmann, “Asymmetry Issues in Power System Restoration,” IEEE Transactions on Power Systems, Vol. 14, No. 3, August 1999, pp. 1085-1091. [7] L. S. Czarnecki, “Power Related Phenomena in Three- Phase Unbalanced Systems,” IEEE Transactions on Power Delivery, Vol. 10, No. 3, July 1995, pp. 1168- 1176. [8] J. Ma and F. P. Dawalibi, “Analysis and Mitigation of Current Unbalance Due to Induction in Heavily Loaded Multicircuit Power Lines,” IEEE Transactions on Power Delivery, Vol. 19, No. 3, July 2004, pp. 1378-1383. [9] J. E. Barkle and W. E. Glassburn, “Protection of Genera- tors against Unbalanced Current,” AIEE Transactions on Part III, Vol. 72, 1953, pp. 282-285. [10] S.-L. Chen, R.-J. Li and P.-H. Hsi, “Traction System Unbalance Problem-Analysis Methodologies,” IEEE Transactions on Power Delivery, Vol. 19, No. 4, October 2004, pp. 1877-1882. [11] A. P. S. Meliopoulos and F. Zhang, “Multiphase Power Flow and State Estimation for Power Distribution Sys- tems,” IEEE Transactions on Power Systems, Vol. 11, No. 2, May 1996, pp. 939-946. [12] F. J. Alcantara and P. Salmeron, “A New Technique for Unbalance Current and Voltage Estimation with Neural Networks,” IEEE Transactions on Power Systems, Vol. 20, No. 2, May 2005, pp. 852-858. [13] Z. Emin and D. S. Crisford, “Negative Phase-Sequence Voltages on E&W Transmission System,” IEEE Trans-  P.-H. HO ET AL. Copyright © 2010 SciRes. EPE 282 actions on Power Delivery, Vol. 21, No. 3, July 2006, pp. 1607-1612. [14] Shaw Technologies, Inc., PSS/E 30 Online Documenta- tion, August 2004. [15] Leuven EMTP Center (LEC), “Alternative Transients Program (ATP) Rule Book,” July 1987. [16] J. A. Martinez, B. Gustavsen and D. Durbak, “Parameter Determination for Modeling System Transients-Part I: Overhead Lines,” IEEE Transactions on Power Delivery, Vol. 20, No. 3, July 2005, pp. 2038-2044. [17] J. A. Martinez, R. Walling, B. A. Mork, J. M. Arnedo, and D. Durbak, “Parameter Determination for Modeling System Transients-Part III: Transformers,” IEEE Trans- actions on Power Delivery, Vol. 20, No. 3, July 2005, pp. 2051-2062. [18] W. D. C. Boaventura, A. Semlyen, M. R. Iravani and A. Lopes, “Sparse Network Equivalent Based on Time- Domain Fitting,” IEEE Transactions Power Delivery, Vol. 17, No. 1, January 2002, pp. 182-189. [19] M. A.-Rahman, A. Semlyen, and M. R. Iravani, “Two- Layer Network Equivalent for Electromagnetic Tran- sients,” IEEE Transactions on Power Delivery, Vol. 18, No. 4, October 2003, pp. 1328-1335. [20] IEEE Guide for AC Generator Protection, IEEE Standard C37.102-2006, February 2007. [21] EEE Standard for Cylindrical-Rotor 50Hz and 60 Hz Synchronous Generators Rated 10 MVA and Above, IEEE Standard C50.13-2005, February 2006. [22] W. S. Meyer and T.-H. Liu, “Electro-Magnetic Transients Program (EMTP) Theory Book,” Bonneville Power Ad- ministration, February 1986. |