Paper Menu >>
Journal Menu >>
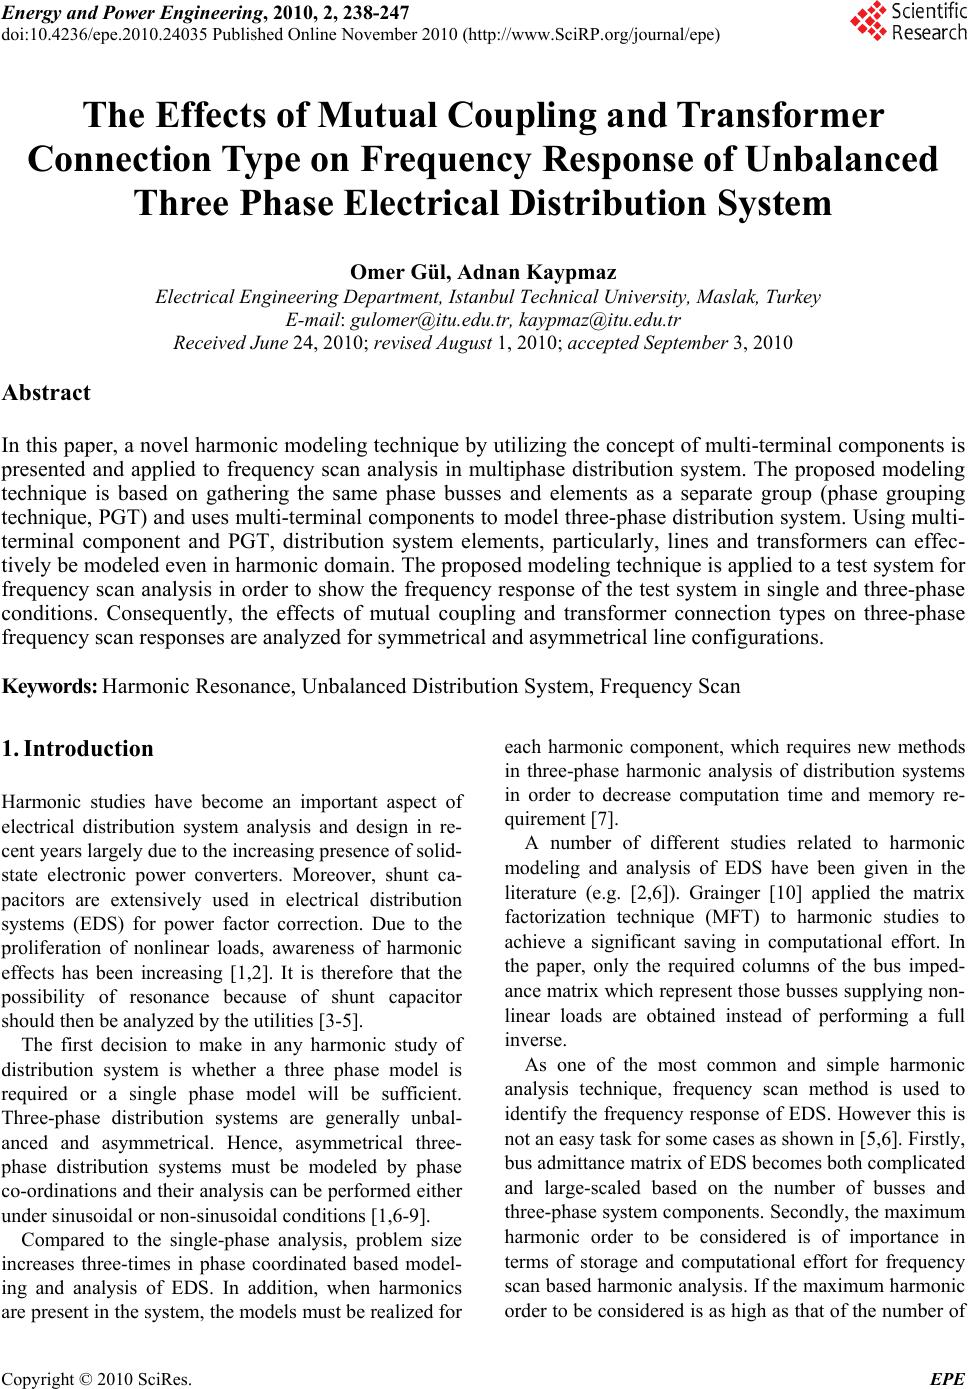 Energy and Power Engineering, 2010, 2, 238-247 doi:10.4236/epe.2010.24035 Published Online November 2010 (http://www.SciRP.org/journal/epe) Copyright © 2010 SciRes. EPE The Effects of Mutual Coupling and Transformer Connection Type on Frequency Response of Unbalanced Three Phase Electrical Distribution System Omer Gül, Adnan Kaypmaz Electrical Engineering Department, Istanbul Technical University, Maslak, Turkey E-mail: gulomer@itu.edu.tr, kaypmaz@itu.edu.tr Received June 24, 2010; revised August 1, 2010; accepted September 3, 2010 Abstract In this paper, a novel harmonic modeling technique by utilizing the concept of multi-terminal components is presented and applied to frequency scan analysis in multiphase distribution system. The proposed modeling technique is based on gathering the same phase busses and elements as a separate group (phase grouping technique, PGT) and uses multi-terminal components to model three-phase distribution system. Using multi- terminal component and PGT, distribution system elements, particularly, lines and transformers can effec- tively be modeled even in harmonic domain. The proposed modeling technique is applied to a test system for frequency scan analysis in order to show the frequency response of the test system in single and three-phase conditions. Consequently, the effects of mutual coupling and transformer connection types on three-phase frequency scan responses are analyzed for symmetrical and asymmetrical line configurations. Keywords: Harmonic Resonance, Unbalanced Distribution System, Frequency Scan 1. Introduction Harmonic studies have become an important aspect of electrical distribution system analysis and design in re- cent years largely due to the increasing presence of solid- state electronic power converters. Moreover, shunt ca- pacitors are extensively used in electrical distribution systems (EDS) for power factor correction. Due to the proliferation of nonlinear loads, awareness of harmonic effects has been increasing [1,2]. It is therefore that the possibility of resonance because of shunt capacitor should then be analyzed by the utilities [3-5]. The first decision to make in any harmonic study of distribution system is whether a three phase model is required or a single phase model will be sufficient. Three-phase distribution systems are generally unbal- anced and asymmetrical. Hence, asymmetrical three- phase distribution systems must be modeled by phase co-ordinations and their analysis can be performed either under sinusoidal or non-sinusoidal conditions [1,6-9]. Compared to the single-phase analysis, problem size increases three-times in phase coordinated based model- ing and analysis of EDS. In addition, when harmonics are present in the system, the models must be realized for each harmonic component, which requires new methods in three-phase harmonic analysis of distribution systems in order to decrease computation time and memory re- quirement [7]. A number of different studies related to harmonic modeling and analysis of EDS have been given in the literature (e.g. [2,6]). Grainger [10] applied the matrix factorization technique (MFT) to harmonic studies to achieve a significant saving in computational effort. In the paper, only the required columns of the bus imped- ance matrix which represent those busses supplying non- linear loads are obtained instead of performing a full inverse. As one of the most common and simple harmonic analysis technique, frequency scan method is used to identify the frequency response of EDS. However this is not an easy task for some cases as shown in [5,6]. Firstly, bus admittance matrix of EDS becomes both complicated and large-scaled based on the number of busses and three-phase system components. Secondly, the maximum harmonic order to be considered is of importance in terms of storage and computational effort for frequency scan based harmonic analysis. If the maximum harmonic order to be considered is as high as that of the number of 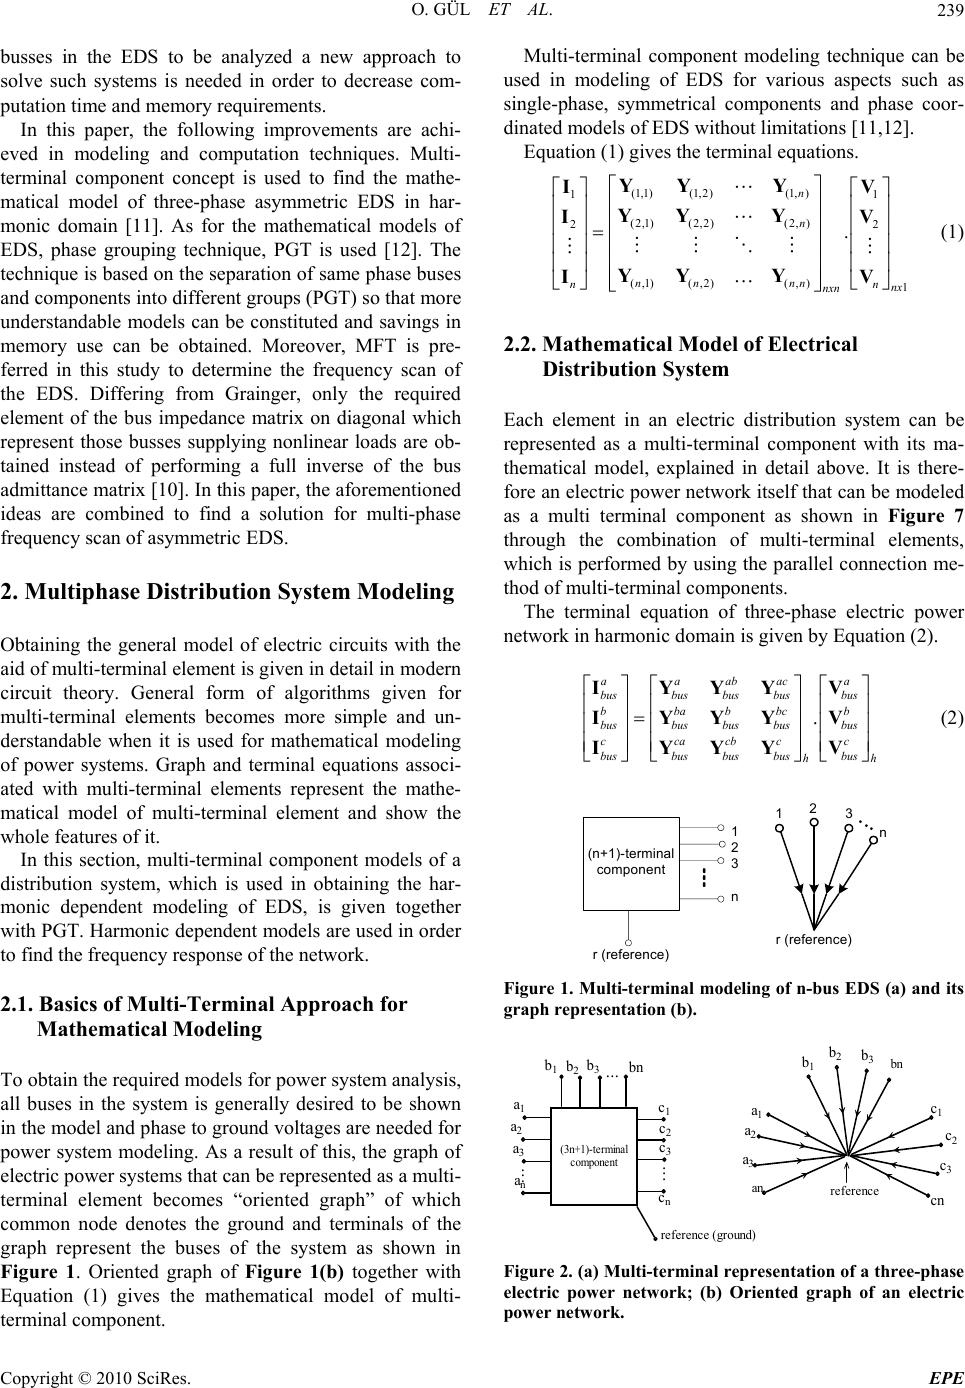 O. GÜL ET AL. Copyright © 2010 SciRes. EPE 239 busses in the EDS to be analyzed a new approach to solve such systems is needed in order to decrease com- putation time and memory requirements. In this paper, the following improvements are achi- eved in modeling and computation techniques. Multi- terminal component concept is used to find the mathe- matical model of three-phase asymmetric EDS in har- monic domain [11]. As for the mathematical models of EDS, phase grouping technique, PGT is used [12]. The technique is based on the separation of same phase buses and components into different groups (PGT) so that more understandable models can be constituted and savings in memory use can be obtained. Moreover, MFT is pre- ferred in this study to determine the frequency scan of the EDS. Differing from Grainger, only the required element of the bus impedance matrix on diagonal which represent those busses supplying nonlinear loads are ob- tained instead of performing a full inverse of the bus admittance matrix [10]. In this paper, the aforementioned ideas are combined to find a solution for multi-phase frequency scan of asymmetric EDS. 2. Multiphase Distribution System Modeling Obtaining the general model of electric circuits with the aid of multi-terminal element is given in detail in modern circuit theory. General form of algorithms given for multi-terminal elements becomes more simple and un- derstandable when it is used for mathematical modeling of power systems. Graph and terminal equations associ- ated with multi-terminal elements represent the mathe- matical model of multi-terminal element and show the whole features of it. In this section, multi-terminal component models of a distribution system, which is used in obtaining the har- monic dependent modeling of EDS, is given together with PGT. Harmonic dependent models are used in order to find the frequency response of the network. 2.1. Basics of Multi-Terminal Approach for Mathematical Modeling To obtain the required models for power system analysis, all buses in the system is generally desired to be shown in the model and phase to ground voltages are needed for power system modeling. As a result of this, the graph of electric power systems that can be represented as a multi- terminal element becomes “oriented graph” of which common node denotes the ground and terminals of the graph represent the buses of the system as shown in Figure 1. Oriented graph of Figure 1(b) together with Equation (1) gives the mathematical model of multi- terminal component. Multi-terminal component modeling technique can be used in modeling of EDS for various aspects such as single-phase, symmetrical components and phase coor- dinated models of EDS without limitations [11,12]. Equation (1) gives the terminal equations. (1,1)(1,2)(1, ) 11 (2,1)(2,2)(2, ) 22 (,1) (,2)(,)1 . n n nn nn nn nx nxn YY Y IV YY Y IV YY Y IV (1) 2.2. Mathematical Model of Electrical Distribution System Each element in an electric distribution system can be represented as a multi-terminal component with its ma- thematical model, explained in detail above. It is there- fore an electric power network itself that can be modeled as a multi terminal component as shown in Figure 7 through the combination of multi-terminal elements, which is performed by using the parallel connection me- thod of multi-terminal components. The terminal equation of three-phase electric power network in harmonic domain is given by Equation (2). . aaab aca busbus bus busbus bbabbcb busbus bus busbus ccacbc c busbus bus busbus hh IYYY V IYYY V IYYY V (2) (n+1)-terminal component 1 2 3 n r (reference) r (reference) 123 ... n Figure 1. Multi-terminal modeling of n-bus EDS (a) and its graph representation (b). (3n+1)-terminal component a 1 a 2 a 3 b 1 b 2 b 3 a n bn c 1 c 2 c 3 c n reference (ground) ... . . . . . . a 1 a 2 a 3 an b 1 b 2 b 3 bn c 1 c 2 c 3 cn reference Figure 2. (a) Multi-terminal representation of a three-phase electric power network; (b) Oriented graph of an electric power network.  O. GÜL ET AL. Copyright © 2010 SciRes. EPE 240 3. Proposed Approach The proposed technique is based on both separation of same phase buses and other power system components into different groups, i.e., each phase group contains same phase busses and elements, which can be repre- sented as in the mathematical model of a three-phase line model in Subsection 2.3. Since electric power networks are composed of multi-terminal components connected to each other, components models are firstly presented. Hence, an electric power network itself can be modeled as a multi-terminal structure which is a combination of its constituents. Based on the topology of the system, the combination procedure of multi-terminal elements rep- resenting system constituents is carried out here through parallel connection method of multi-terminal elements, which is well-known in modern circuit theory [13]. Since the most common elements in electric power networks are lines and transformers, the models of these elements are given only in this paper. Yet, one can get the others by following the procedure which is given in the next section. After getting the element models in the form of multi-terminal component, the mathematical models are stemmed from the procedure as explained in the following sections. 3.1. The Line Model In general, the lines are represented as -equivalent cir- cuit in most applications. The series impedance and shunt admittance lumped- model representation of the three-phase line is shown in Figure 3 [2,7]. To obtain a symmetrical model of fundamental components, the lines are generally transposed so as to eliminate the effect of long lines. However, this aim can not be reached when the system have harmonic components. Furthermore, long line effect takes place in relatively short distances, if the lines carry signals with high frequencies. Due to these facts, it is a must to use phase coordinated models in harmonic dependent line modeling. In this case, three-phase representation of lines as mul- ti-terminal component and its oriented graph are given according to PGT in Figure 3. According to proposed approach, the following pro- cedure is given for obtaining the mathematical model of lumped- model. Step 1 Neglecting skin effects, harmonic dependent series impedance matrix of a line or cable in Figure 3 is given as in Equation (3) 22 2 11 abc abcabc hrjhx z (3) where, 21 abc r and 21 abc x are fundamental series re- y3 a y1 ay1 by1 cy3 by3 c a1 b1 c1 a2 b2 c2 y3 ac y1 ac Z2 ac Z2 ab Z2 bc y1 ab y1 bc y2 ab y2 bc Z2 a Z2 b Z2 c Figure 3. Lumped- model representation of the three- phase line. sistance and reactance matrices of a line or cable for the phases a, b, c respectively and h is the harmonic order. Harmonic dependent shunt admittance matrices of phas- es a, b and c are given as below: 11 1 11 33 3 11 Re(1/) Im Re(1/) Im abc abcabc h abc abcabc h jh jh yy y yy y (4) Real parts of Equation (4) are neglected for line and cables. Step 2 By inversion of primitive impedance matrix for Fig- ure 2, series primitive admittance matrix in harmonic domain are obtained as in Equation (5) 22 2 1 22 222 22 2 h aabac abcabcba b bc h ca cbc h yy y yz yyy yy y (5) By gathering the primitive admittance values of same phase elements in one group, the primitive admittance matrix of Figure 2 and its short form are given as Equa- tion (6) and (7), respectively. 11 1 22 2 33 3 111 222 333 11 1 22 2 33 3 00 00 00 000000 00 0000 00 00 00 000000 00 0000 00 00 00 000000 00 0000 aabac aabac aabac ba bbc abc bc b bc h bcb bc ca cbc ca cbc ca cbc h yy y yy y yyy yyy yyyy yyy yy y yyy yyy (6) aabac babbc h ca cbc h yy y yyyy yy y (7)  O. GÜL ET AL. Copyright © 2010 SciRes. EPE 241 where , ab yy and c y are the sub admittance matrices of phase elements which are grouped based on the phases a, b, c. k y is a mutual admittance matrix between k and (k = a, b, c; k ; = a, b, c). Step 3 Each system element of Figure 3(b) is first assumed to be excited by a voltage source in order to obtain the terminal equation of three-phase line, which is repre- sented in the form of multi terminal component in Fig- ure 3(a). In this case, the closed loop equations for ori- ented graph of three-phase line whose components have been excited by different voltage sources can be arranged by gathering the same phase terminals together as in Equation (8). In the same way, basic cut-set equations can be written as Equation (9). () () 00 00 () 0000 0 00 00 a b a c b a c b c BU BU BU V V V V V V (8) () () 0000 () 000 00 000 0 a b a c b a c b c UQ UQ UQ I I I I I I (9) Where ,, abc BBB are basic loop matrices re- lated to phases, a, b and c, and ,, abc QQQ are basic cut-set matrices related to phases, a, b and c, re- spectively. Moreover, as known, the expression T BQ is valid for all phases. Step 4 By using the Equation (7), Equation (8) and Equation (9), terminal equations in harmonic domain can be given as Equation (10), which is well known in circuit theory [16]. Oriented graph of Figure 3(b) together with Equa- tion (10) gives the harmonic dependent mathematical model of multi-terminal line component. 11 22 11 22 11 22 . aa aa aabac bus bus bus bb ba bbc bus bus bus bb ca cb c bus bus bus cc h cc hh IV IV YYY IV YYY IV YYY IV IV (10) Phase sub-admittance and sub-mutual admittance ma- trices in Equation (10) are given as Equation (11) and (12) for hth-harmonic order, respectively. T kkkk bus BB, ka, b, c Yy (11) T kkk bus BB, ka, b, c; (k); a, b, c Yy (12) Equation (11) and (12) represent 9 different sub-ma- trices for each harmonic order, or rather these matrices simply form the terminal equation of harmonic depend- ent three-phase line in the newly proposed method. These 9 matrices for each harmonic order can be calcu- lated independently and for this reason the matrix calcu- lations can be done at the same time by more than one computer in parallel processing. Simplified assumptions. 1) a) As shown in Equation (13), the primitive har- monic admittance matrices associated with each phase can be assumed to be equal on the condition that the phase characteristics such as conductor size, line length, phase material and the number of component belong to each phase are same. a b cphase hhh h yyyy (13) b) As shown in Equation (14), the mutual admittance matrices of hth-order can be assumed to be equal on the conditions that long line effect is neglected and the lines are transposed, which leads to symmetrical mutual cou- pling between lines. ab ac ba bc h hhh ca cb m hhh yyyy yyy (14) As a consequence, when assumptions are made related to Equations (13) and (14) it is enough to form the primi- tive admittance matrix representing the whole three- phase line (as in Equation (10)) by just using both one- phase primitive admittance matrix and a mutual admit- tance matrix. 2) As shown in Equation (15), basic loop matrices are assumed to be equal when the topology of phases is iden- tical. ab BBBB c (15) Instead of using the Equations (11)-(12), which con- tain 9 different equations for each harmonic, only the Equations (16) and (17) can be used in order to form the harmonic dependent terminal equation of the line on the conditions that the performance equations of a primitive network are as Equations (13)-(14) and the topology of phases are identical.  O. GÜL ET AL. Copyright © 2010 SciRes. EPE 242 T ab cphase bus bus bush hhh Y=Y=Y=By B (16) ab acba bc bus busbus bus hhhh T ca cbm bus bush hh Y=Y=Y=Y =Y=Y=ByB (17) The algorithm given above for lines is also valid for power networks composed of more than one line. In that case, if a mutual coupling between different three-phase lines exists, all these lines must be modeled as a single multi-terminal component. For this reason, the formation of mathematical model is realized as explained above. Consequently, as one might expect that the proposed algorithm can be applied to a system whose bus numbers are different at different phases, which show another merit of the proposed modeling technique. 3.2. Three-Phase Transformer Model Magnetizing current in transformers leads to harmonic currents due to its saturated core. Due to the fact that the transformers should be modelled in harmonic domain so that harmonic currents are required to take place in the model [2,7]. However, harmonic currents is not included in the transformer model since our interest in this study is to determine the frequency response of EDS. Mathematical model associated with any of trans- former can be obtained by utilizing the concept of mul- ti-terminal component. However, the most common transformers in use, i.e., Y- connected three-phase transformers are preferred here to show the potential application of the proposed method. In respect of the proposed method, a transformer model is given here in the case that the mutual coupling between phases of primary and secondary windings is not neglected. Y- connected three-phase transformer is illustrated in Figure 4. Step 1 Y- connected three-phase transformer is represented as a multi-terminal component in Figure 5. When it is desired to form the mathematical model of the trans- formers with isolated neutral point, one should take the neutral point into consideration. As a result, the terminal number in multi-terminal representation of transformer is increased from 7 to 8, which leads to increased dimen- sion in oriented graph and terminal equations. Step 2 In multi-phase system representation, the power trans- former are represented by reactance and resistance ma- trices for each pair of windings. According to proposed PGT, the primitive admittance matrix of the transformer hth harmonic order is given by Equation (18). 7-terminal component c1 c2 a2 a1 b1b2 r c2 a1 a2 b1b2 c1 r Figure 4. (a) Three-phase representation of a line in the form of multi-terminal component; (b) Oriented graph of a three-phase line. Ia1 Ib1 Ic1 Ia2 Ib2 Ic2 Va2 Vb2 Vc2 Vc1 Va1 Vb1 Figure 5. Y- connected three-phase transformer with sin- gle core. 1 2 1 2 1 2 y mmmmm m mmmm mm mmm abc hmm mmm mmmm m mmm mh y yyyyy yyyyyy yy yyyy yy yyyy yyyy y y yy yyyy (18) where, 1 y is the admittance at primary side 2 y is the admittance at secondary side m yis the mutual admittance between primary and sec- ondary side at same phases ' m y is the mutual admittance between primary coils. '' m yis the mutual admittance between primary and sec- ondary coil on different cores. ''' m y is the mutual admittance between secondary coil. As a result of PGT, the primitive admittance matrix in Equation (18) has a simple and symmetrical structure, which can easily be shown in its short form as in Equa- tion (19). phase mm m phase m mm phase abc h h yyy yyyy yyy (19)  O. GÜL ET AL. Copyright © 2010 SciRes. EPE 243 m y is generally taken as zero for each harmonic. It is therefore that the primitive matrix abc h y becomes equal to the primitive matrix of three single-phase trans- formers connected to each other, based on their connec- tion group. Step 3 Transformers’ performance equations in real values are converted to expressions in p.u. by using the turns ratio of transformers. Moreover, phase shifting origi- nated from connection group of three-phase transformer (Delta-Wye) should be included in mathematical model of the transformers. Furthermore, instead of modelling the voltage regulators individually, phase shifting of voltage regulators can also be included in transformers’ mathematical model on the condition that the model of voltage regulator itself is not needed. In this study, transformers’ performance equations are assumed to be given in p.u. and the equivalent circuit of Figure 6 is used in order to include both magnitude and phase shifting in the mathematical model. Apart from these, the phase shifting operations in phase shifting three-phase transformers are included in the mathematical model in the same way. When the aforementioned conditions, which represent the very general form of transformer model, are taken into consideration, voltage ratio for each phase in three -phase transformer are given as Equation (20) with the assumption that phases have different complex turns ra- tio. As for the current turns ratio of the transformer, it is given in Equation (21) as complex conjugate of voltage turns ratio. k kv vk v 10 , ka, b, c 01 α δβ (20) * kk iv , ka, b, c δδ (21) With these assumptions, sub-matrices of primitive admittance matrix of hth harmonics are given in general form as Equations (22) and (23). kkkphase k iv .., ka, b, c yδyδ (22) 8-terminal component c1 c2 a2 a1 b1b2 r d1 r c2 a1 a2 b1b2 c1 d1 Figure 6. (a) Multi-terminal representation of Y- connect- ed three-phase transformer; (b) oriented graph of Y- con- nected transformer. Y I2 I1 V1V2 Figure 7. Basic equivalent circuit in p.u. for coupling be- tween primary and secondary coils with both primary and secondary off-nominal tap ratios of and . kkm iv .., ka, b, c; (k); a, b, c yδyδ (23) Since phase shifts in voltage and current equations due to transformer connection type are same for all phases, the primitive admittance matrices can be given as Equa- tions (24) and (25). As a result of -connection of the transformer, changes in phase angles and magnitudes in these equations are same. For this reason, the structure of primitive admittance matrix has become simple and powerful in computation. * ab cphase hv v hhh .. yyyδyδ (24) * vv .. ab ac ba bc ca hhhhh cb m h h yyyyy yδyδ (25) In this study, phase shifting due to transformers con- nection group is included in the mathematical model through above equations. Step 4 To form the terminal equations (or mathematical mo- del) of three phase transformer, closed loop equations for voltage should be obtained as Equation (26). * abcd B U0 V V (26) As shown in Equation (27), let abcd B be divided into two sub-matrices as abc B and d B, which are sub-loop matrix related to phases and basic loop matrix associated with the nodes of star connection, respec- tively. abcdabc d BB B (27) The matrix d B exist when the star connection node is not grounded. As for the matrix abc B, it can be written as Equation (28) for the six most common con- nections of three-phase transformers (Yg-Yg, Yg-Y, Yg-, Y-Y, Y-, -). abc UB O BOUB BOU (28)  O. GÜL ET AL. Copyright © 2010 SciRes. EPE 244 where, the sub-matrix B given as below is a matrix associated with -connection of three-phase transform- ers. (1) 0 B0(1) (29) In Equation (29), the coefficients and take the val- ues “−1” or “0” based on the transformers connection type. Whilst is “−1” when the primary windings of transformer is wye, is “0” when the primary side of the transformer is delta. As for the coefficients , it takes the value “−1” when secondary side is wye, and takes the value “0” when secondary side is delta. Furthermore, the sub-matrices U and O are given as below 10 00 U and O 01 00 (30) Basic sub-loop matrix d B in Equation (27) can be given as Equation (31), if the star connection nodes are not grounded. T d ddd B bbb (31) If star connection node in one of the primary and sec- ondary windings is not grounded, the sub-matrix d b in Equation (31) can be given as Equation (32). d bλ γ (32) If the star connection nodes in both sides are not grounded, then, the sub-matrix d b is given by Equa- tion (33) dλ0 b0 γ (33) Step 5 As a consequence, bus admittance matrix of a trans- former is given as a function of primitive admittance matrix and loop equations as Equation (34). T abcdabcd abcabcd bus h hB..B Yy (34) 3.3. Other Components Loading should be included in the system representation because of its damping effect near resonant frequencies. However, an accurate model for the system load is diffi- cult to determine because the frequency-dependent char- acteristics are usually unknown and the load itself is changing continuously. In general, if a load is linear, the load is represented as an admittance using the CIGRE load model at the interested frequencies [14]. If load is nonlinear, the load is represented as an open circuit in frequency scan study. Capacitors are often placed in distribution networks to regulate voltage levels and reduce real power loss. Ca- pacitor bank size and locations are the most important factors in determining the response of distribution system to a harmonic source. For accurate representation of ca- pacitors, a shunt capacitor can be modelled as wye con- nected or delta connected constant admittance [2,3,7]. For harmonic studies of EDS, it is usually sufficient to represent the entire transmission system by its 50 Hz short-circuit equivalent resistance and inductance at the high side of the substation transformer [7]. 4. Three Phase Frequency Scan Analysis An electric energy system simply consists of the resis- tances (R), inductances (L) and capacitances (C). All circuits containing both capacitance and inductance have one or more natural resonant frequencies [5,14-17]. Normally electric energy systems are designed to operate at frequencies of 50 Hz so as not to be under resonance for fundamental frequency. However, certain types of loads produce currents and voltages with frequencies that are integer multiples of the 50 Hz fundamental frequency. These higher frequencies are a form of electrical distor- tion known as power system harmonics. When one of the natural frequencies corresponds to an exciting frequency produced by non-linear loads, harmonic resonance can occur. Voltage and current will be dominated by the resonant frequency and can be highly distorted. It is therefore that for all effective harmonic frequencies, the system should be analyzed for whether a resonance is going to occur or not. Frequency scan analysis is the most common and effective method to detect the har- monic condition in a network. The simplest way to de- termine the frequency response of a network is to im- plement frequency or impedance scan study. The process of frequency scan study can be performed by solving the network equation for the frequencies of h.fo. Here, f0 is the fundamental frequency and h is the harmonic order. hhh VZI (36) where h V is the nodal vector, h I is the current vector. The aim of the frequency scan study is to determine impedance as a function of frequency. The frequency scan technique basically involves following steps: A current injection, which is a scan of sine waves of magnitude one, is firstly applied to the bus of interest. Secondly a resultant voltage of that bus is measured. hhhhh h 1 0 VIZVZ Z (37) For large-scaled systems, h Z is simply derived from bus impedance matrix, which is defined by taking the  O. GÜL ET AL. Copyright © 2010 SciRes. EPE 245 inverse of bus admittance matrix as below: -1 hh ZY (38) and the expanded form of nodal impedance matrix at any frequency is h h 11 121n 21 222n n1 n2nn ZZ Z ZZ Z Z ZZZ (39) where ij Z = transfer impedance between nodes i and j ii Z= driving point impedance at node i, r. The effects of, the transformer connection types and the mutual coupling between lines on frequency response are examined on a three-bus industrial test system shown in Figure 8 by using the frequency scan technique. The test system consists of three busses utility, IND1 and IND2. IND1 and IND2 busses are connected through a short three-phase and four-wire line. The system is supplied by the utility through 69/13.8 kV transformer. While a motor and linear load are connected on bus IND1, a harmonic producing nonlinear load and a linear load are connected on bus IND2. Harmonic currents of the nonlinear load are given in the Table 1. Since zero sequence harmonics are not found and since only one harmonic source is present in the test sys- tem, the system can be assumed to be balanced and symmetric. That is why single phase analysis can be used to solve this system. The values on Table 1 are calculated in pu system. The selected base quantities are 10.000 kVA and 13.8 kV. The data and calculations are available on the web site http://www.ee.ualberta.ca/pwrsys/IEEE/download.html. The following assumptions are made in the analysis. 1) The load points are supplied from an infinite bus system. 2) The linear loads are modeled with its series resistance and reactance. 3) For the motor loads, a locked rotor im- pedance are used [11,12,13]. In this study, three-phase models are used and follow- ing four-cases are considered in the frequency scan si- mulation of the test system. The frequency responses with three-phase models are given in comparison to sin- gle-phase models in the Figures 9-12 for each of the following cases. Firstly, the transformer connection type is selected as wye-grounded/wye-grounded. In the second case, the mutual coupling between lines is taken into consideration for the transformer connection type as wye-grounded/wye-grounded and the value of mutual impedance is taken as one-third of phase imped- ance. The system is still symmetric in this case. So, only one-phase frequency response analysis is enough for the system. 69kV 13.8kV IND1 IND2 1 2 3 Figure 8. The considered three-bus industrial test system. Figure 9. Frequency responses of single and three-phase EDS (transformer connection type is wye-grounded/wye- grounded). Figure 10. Frequency responses of single and three-phase EDS (transformer connection type is wye-grounded/wye- grounded and there is a mutual coupling between lines). Figure 11. Frequency responses of single and three-phase EDS. 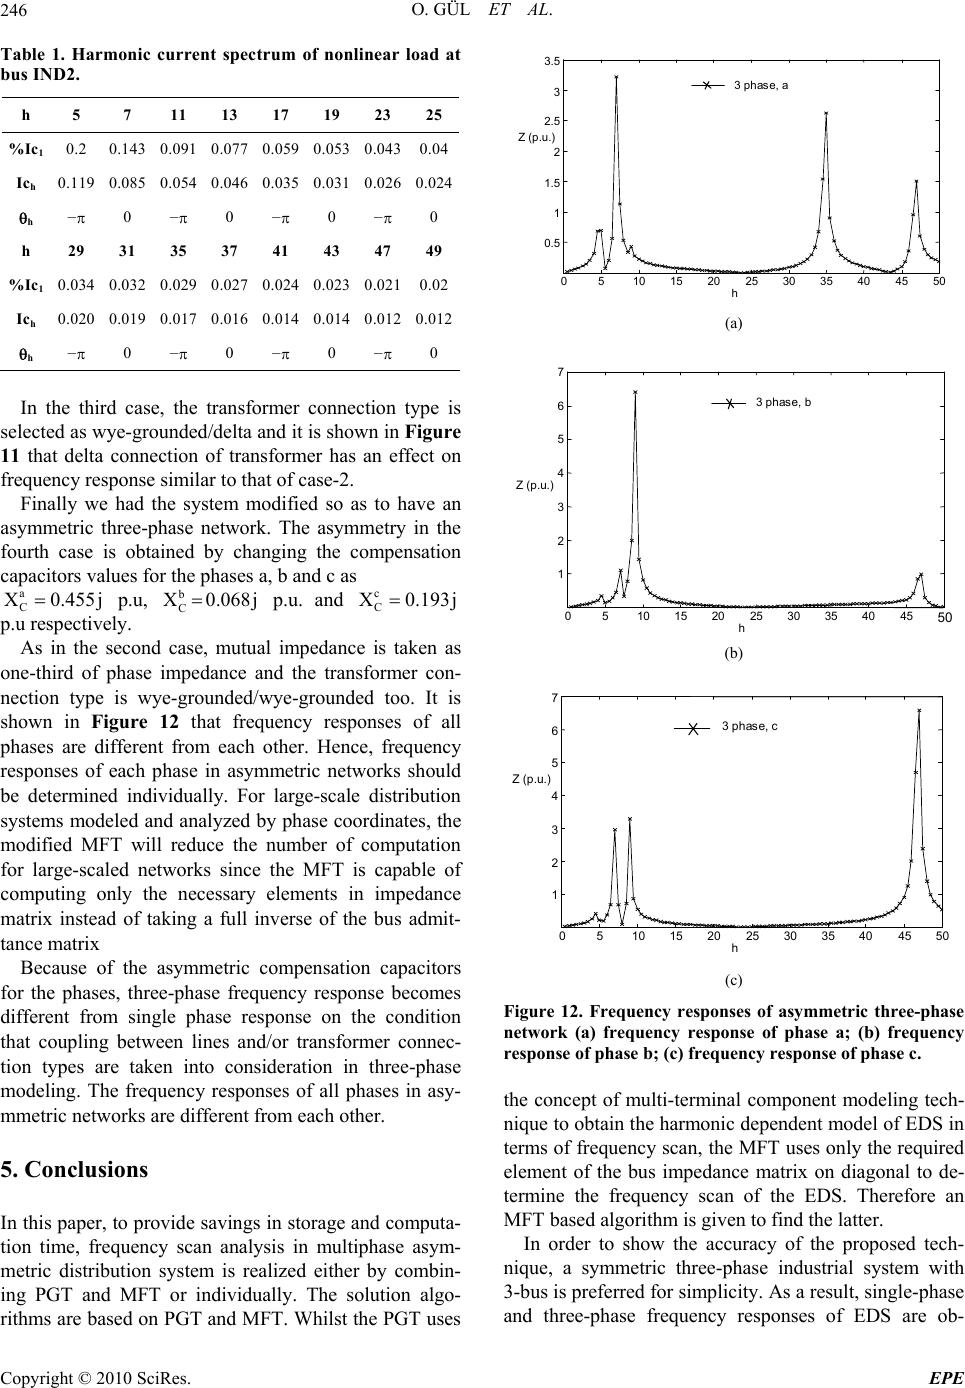 O. GÜL ET AL. Copyright © 2010 SciRes. EPE 246 Table 1. Harmonic current spectrum of nonlinear load at bus IND2. h 5 7 11 13 17 19 23 25 %Ic1 0.2 0.143 0.091 0.077 0.059 0.053 0.0430.04 Ich 0.119 0.085 0.054 0.046 0.035 0.031 0.0260.024 h − 0 − 0 − 0 −0 h 29 31 35 37 41 43 47 49 %Ic1 0.034 0.032 0.029 0.027 0.024 0.023 0.0210.02 Ich 0.020 0.019 0.017 0.016 0.014 0.014 0.0120.012 h − 0 − 0 − 0 −0 In the third case, the transformer connection type is selected as wye-grounded/delta and it is shown in Figure 11 that delta connection of transformer has an effect on frequency response similar to that of case-2. Finally we had the system modified so as to have an asymmetric three-phase network. The asymmetry in the fourth case is obtained by changing the compensation capacitors values for the phases a, b and c as a C X0.455j p.u, j068.0X b C p.u. and c C X0.193j p.u respectively. As in the second case, mutual impedance is taken as one-third of phase impedance and the transformer con- nection type is wye-grounded/wye-grounded too. It is shown in Figure 12 that frequency responses of all phases are different from each other. Hence, frequency responses of each phase in asymmetric networks should be determined individually. For large-scale distribution systems modeled and analyzed by phase coordinates, the modified MFT will reduce the number of computation for large-scaled networks since the MFT is capable of computing only the necessary elements in impedance matrix instead of taking a full inverse of the bus admit- tance matrix Because of the asymmetric compensation capacitors for the phases, three-phase frequency response becomes different from single phase response on the condition that coupling between lines and/or transformer connec- tion types are taken into consideration in three-phase modeling. The frequency responses of all phases in asy- mmetric networks are different from each other. 5. Conclusions In this paper, to provide savings in storage and computa- tion time, frequency scan analysis in multiphase asym- metric distribution system is realized either by combin- ing PGT and MFT or individually. The solution algo- rithms are based on PGT and MFT. Whilst the PGT uses 05 10 15 2025 30 35 40 45 50 0.5 1 1.5 2 2.5 3 3.5 h Z (p.u.) 3 phase, a (a) 05 10 15 20 25 30 35 40 4550 1 2 3 4 5 6 7 h Z (p.u.) 3 phase, b (b) 05 10 15 2025 30 35 4045 50 1 2 3 4 5 6 7 h Z (p.u.) 3 phase, c (c) Figure 12. Frequency responses of asymmetric three-phase network (a) frequency response of phase a; (b) frequency response of phase b; (c) frequency response of phase c. the concept of multi-terminal component modeling tech- nique to obtain the harmonic dependent model of EDS in terms of frequency scan, the MFT uses only the required element of the bus impedance matrix on diagonal to de- termine the frequency scan of the EDS. Therefore an MFT based algorithm is given to find the latter. In order to show the accuracy of the proposed tech- nique, a symmetric three-phase industrial system with 3-bus is preferred for simplicity. As a result, single-phase and three-phase frequency responses of EDS are ob-  O. GÜL ET AL. Copyright © 2010 SciRes. EPE 247 tained. The results show that three-phase frequency re- sponse becomes different from single phase response on the condition that coupling between lines and/or trans- former connection types are taken into consideration in three-phase modeling. In addition, frequency responses of all phases in asymmetric networks are different from each other. Consequently, beside in asymmetrical mod- eling, one can easily extract that a phase-coordinated based model must be used to detect the frequency re- sponse of EDS, even in the symmetrical modeling. 6. References [1] IEEE Std. 519-1992, IEEE Recommended Practice and Requirements for Harmonic Control in Electric Power Systems, IEEE Press, New York, 1992. [2] J. Arrillaga, B. C. Smith and N. R. Watson, “Power Sys- tem Harmonics Analysis,” John Wiley and Sons, New York, 1997. [3] IEEE Guide for Application of Shunt Power Capacitors, IEEE Standard 1036-1992. [4] W. Xu, X. Liu and Y. Liu, “Assessment of Harmonic Resonance Potential for Shunt Capacitor,” Electric Power System Research, Vol. 57, No. 2, 2001, pp. 97-104. [5] R. A. W. Ryckaert and A. L. Jozef, “Harmonic Mitigation Potential of Shunt Harmonic Impedances,” Electric Power Systems Research, Vol. 65, No. 1, 2003, pp. 63-69. [6] M. F. McGranaghan, R. C. Dugan and W. L. Sponsler, “Digital Simulation of Distribution System Frequency- Response Characteristics,” IEEE Transaction on Power Apparatus and Systems, Vol. PAS-100, No. 3, 1981, pp. 1852-1855 [7] IEEE Power Engineering Society, Tutorial on Harmonic Modelling and Simulation, IEEE Catalogue Number: 98TP125-0, Piscataway, 1998. [8] M. A. Laughton, “Analysis of Unbalanced Polyphase Net- works by the Method of Phase Coordinates, Part 1 System Represantation in Phase Frame of Reference,” Proceeding of IEE, Vol. 115, No. 8, 1968, pp. 1163-1172. [9] W. E. Dillon and M.-S. Chen, “Power System Modelling,” Proceeding of IEE, Vol. 62, No. 7, July 1974, pp. 901-915. [10] L. G. Grainger and R. C. Spencer, “Residual Harmonic in Voltage Unbalanced Power System,” IEEE Transactions on Industry Applications, Vol. 30, No. 5, 1994, pp. 1398- 1405 [11] O. Gül, “Harmonic Analysis of Three Phase Distribution Networks by Utilizing Concept of Multi-terminal Com- ponents and Phase Coordinates,” Ph.D Dissertation, Is- tanbul Technical University, Istanbul, 2001. [12] O. Gül, A. Kaypmaz and M. Tanrıöven, “A Novel Ap- proach for Three Phase Power System Modelling by Utilizing the Concept of Multi-Terminal,” International Review on Modelling and Simulations, Vol. 3, No. 1, February 2010, pp. 90-100. [13] D. E. Johnson, J. L. Hilburn and R. J. Johnson, “Basic Electric Circuit Analysis,” Prentice Hall, Englewood Cliffs, 1990. [14] CIGRE Working Group 36-05, “Harmonics, Characteris- tics Parameter, Methods of Study, Estimates of Existing Values in the Network,” Electra, No. 77, 1981, 35-54. [15] Z. Huang, W. Xu and V. R. Dinavahi, “A Practical Har- monic Resonance Guideline for Shunt Capacitor Applica- tion” IEEE Transactions on Power Systems, Vol. 22, No. 10, p. 64. [16] T. A. Haskew, J. Ray and B. Horn, “Harmonic Filter De- sign and Installation: A Case Study with Resonance,” Electrical Power System Research, Vol. 40, No. 2, 1997, pp. 121-125. [17] CIGRE 36.05, WO CCO2 Report Guide for Assessing the Network Harmonic Impedances. List of the Symbols and Abbreviations EDS Electrical Distribution Systemb PGT Phase Grouping Technique MFT Matrix Factorization Technique α Primary off-nominal tap ratings β Secondary off-nominal tap ratings V Voltage phasor I Current phasor Y Admittance phasor Z Impedance phasor Y Primitive admittance Z Primitive impedance B Basic loop matrices N Bus numbers d Star point index Delta connection index a, b, c Line indexes M Mutual coupling h harmonic index * Complex conjugate Branch index j Imaginary unit V Voltage index I Current index Matrix T Matrix transpose |