Advances in Physical Education
2013. Vol.3, No.2, 76-79
Published Online May 2013 in SciRes (http://www.scirp.org/journal/ape) http://dx.doi.org/10.4236/ape.2013.32012
Copyright © 2013 SciRes.
76
Physical Fitness Characterization by Obesity Level in Young
Males with Poor Physical Fitness
Tamotsu Kitabayashi1, Shin-ichi Demura2, Takanori No guchi3
1Tokyo University of Science, Tokyo, Japan
2Graduate School of Natural Science & Technology, Kanazawa Uni ver sity, Kanazawa, Japan
3Fukui University of Technology, Fukui, J a pa n
Email: t-noguchi@fukui-ut.ac.jp
Received January 17th, 2013; revised Febru ary 19th, 2013; accepted March 4th, 2013
Copyright © 2013 Tamotsu Kitabayashi et al. This is an open access article distributed under the Creative Com-
mons Attribution License, which permits unrestricted use, distribution, and reproduction in any medium, pro-
vided the original work is properly cited.
Lack of physical fitness in obese people, recent decline in physical fitness of young people, and physical
fitness problems of thin people are a concern. We investigated the physical fitness characteristics of dif-
ferent obese groups comprising young males with poor physical fitness. Technical college students (144
males; age, 15.9 ± 1.1 y; height, 169.1 ± 5.9 cm; weight, 60.0 ± 13.3 kg) took the physical fitness test of
the Ministry of Education, Culture, Sports, Science and Technology (MEXT) and were judged to have
lower than normal physical fitness in a comprehensive evaluation of the MEXT physical test. Three
groups with different obesity levels were formed according to their percent body fat (%BF): thin (<15%),
normal (15% - 25%), and obese (>25%). The obese group had stronger grip than the thin and normal
groups but was inferior to the thin group in 20-m shuttle run, standing broad jump, 50-m run, and total
score. The test requiring large physical movements revealed that the obese group was inferior in power
and endurance. Therefore, among young males with poor physical fitness, obese individuals have differ-
ent physical fitness characteristics than thin and normal individuals; they are inferior to normal and thin
individuals in running- and jumping-related power and endurance but superior in muscle strength.
Keywords: Obesity Level; Physical Fitness; Exercise Prescription
Introduction
A marked decline in physical fitness of young people has
been noted as a problem for more than 20 y. At the time, many
studies were conducted on the decline in physical fitness due to
physical inactivity, adiposity with an increased percent body fat
(%BF), and the occurrence of lifestyle-related diseases (Beunen,
Malina, Ostyn, Renson, Simons, & Van Gerven, 1983; Kim,
Matsuura, Tanaka, & Inagaki, 1993). In particular, much atten-
tion has been paid to the decline in physical fitness due to obe-
sity. However, the causes for this decline have diversified and
the number of young people with poor physical fitness and
obese individuals are increasing. There has also been an in-
crease in extremely thin young males (Hayano, 2002). A low
%BF in young people was not previously considered a problem
because many of them exercised daily through club activities
and had superior physical fitness.
However, the number of thin individuals with poor physical
fitness has increased recently, despite them having a low %BF
similar to athletes. Thus, there is a need to distinguish thin peo-
ple with good physical fitness from those with poor fitness.
Hayano (2002) reported that thin individuals with poor physical
fitness suffer from eating disorders because of their desire to
lose excess weight or because of following incorrect diets (Ha-
yano, 2002). As a result, there is a decrease in their muscle
mass, which is necessary for physical activities. Physical fitness
level generally reaches a peak between childhood and adoles-
cence (Tokyo Metropolitan University, 2007). Therefore, in-
creasing fitness levels sufficiently during this period is very
important because it largely affects their physical fitness levels
in adolescence (Barnekow, Hedberg, Janlert, & Jansson, 1988;
Iwai, Matuki, Koshida, Tanaka, Miyashita, & Urabe, 2008;
Mikkelsson, Kaprio, Kautiainen, Kujala, Mikkelsson, & Nup-
ponen, 2006). Therefore, physical fitness must be improved
with adequate exercise prescriptions. However, obese and/or
thin individuals are among those with poor physical fitness, and
physical fitness characteristics may differ with the degrees of
obesity. This study may be considered more significant than
previous studies because it clarifies the causes of low physical
fitness levels according to the degree of obesity.
We clarified the physical fitness characteristics in groups of
young males with poor physical fitness and different degree of
obesity.
Method
Subjects
The physical fitness test of the Ministry of Education, Cul-
ture, Sports, Science and Technology (MEXT) sets a judgment
criterion for a comprehensive physical fitness based on the total
score in each test (Five stages; A [highest] to E [lowest]). We
targeted young males with poor physical fitness. Students cor-
responding to the D and E levels, which are lower than the
T. KITABAYASHI ET AL.
standard level (C), were selected as subjects according to the
general MEXT judgment criteria. In short, among 606 male
technical college students from the first to third grade, 144
students (age, 15.9 ± 1.1 y; height, 169.1 ± 5.9 cm; weight, 60.0
± 13.3 kg) were judged to have poor physical fitness (D and E
levels).
The purpose and procedure of the study were explained in
detail, and informed consent was obtained from all participants.
This experimental protocol was approved by the Ethics Com-
mittee on Human Experimentation of Faculty of Education,
Kanazawa University (authorization number: 19-4).
%BF and Body Mass Index (BMI)
Subcutaneous fat thickness was measured at the triceps and
scapular sites with a skinfold caliper (Cambridge Scientific
Industries, Inc., Cambridge, MD, USA). After calculating body
density by substituting the total value of subcutaneous fat
thickness in the equation of Nagamine & Suzuki (1964), we
calculated %BF using the equation of Brozek et al. (1951). BMI,
which is an obesity index, was calculated by dividing the
weight in kg by the height in m2 (Katherine, Margaret, Brian,
& Cynthia, 2012).
Physical Fitness Test
The MEXT physical fitness test was selected as the physical
fitness test in this study (The Ministry of Education, Culture,
Sports, Science and Technology, 2000). It consists of eight tests:
grip strength (strength), sit-ups (muscle endurance), sit and
reach (flexibility), side-stepping (agility), 20-m shuttle run
(general endurance), 50-m run, standing broad jump, and
handball throwing (muscle power; running, jumping, and
throwing ability). The tests were performed according to the
enforcement method for physical fitness tests (Sports and
Youth Bureau of the MEXT, 2012: The Ministry of Education,
Culture, Sports, Science and Technology, 2000).
Based on the score table provided by MEXT, the records of
each test were converted into a scale of 0 - 10, and the total
scores were used as the general physical fitness evaluation
value. The measurement of skinfold thickness and the physical
fitness test were carried out from early April to early June dur-
ing regular health and physical education classes held by
physical education teachers with expertise and experience.
Statistical Analysis
The relationship between %BF and BMI was examined using
Pearson’s correlation coefficient. A one-way analysis of vari-
ance (ANOVA, the obesity factor) was used to determine the
mean differences for each physical test and total scores. When a
significant main effect was found, a multiple comparison test
was conducted using Tukey’s honestly significant difference
(HSD) method. The mean difference was assessed by effect
size (ES); p < .05 was considered significant.
Results
The correlation between %BF and BMI was significant and
very high (r = .86). Based on %BF, three groups with different
obesity levels were created: thin (<15 %BF), normal (15 - 25
%BF), and obese (>25 %BF). As a result, 73 (height, 168.7 ±
5.5 cm; weight, 52.8 ± 6.1 kg; %BF, 12.3% ± 2.1%), 45 (height,
168.7 ± 5.9 cm; weight, 59.1 ± 8.1 kg; %BF, 18.3% ± 1.9%),
and 26 (height, 171.3 ± 6.5 cm; weight, 81.7 ± 12.1 kg; %BF,
31.8% ± 6.1%) subjects were assigned to the thin, normal, and
obese groups, respectively.
Table 1 shows the means and standard deviations of the
physical fitness test scores based on the groups, the test results
of the one-way ANOVA (degree of obesity), and ES. Signifi-
cant main effects were obtained in the tests of grip strength,
20-m shuttle run, 50-m run, and standing broad jump. The thin
and normal groups had lower total scores and grip strength but
significantly higher 20-m shuttle run and standing broad jump
scores than the obese group. The thin group was faster in the
50-m run but had lower total scores than the obese group.
Table 1.
Physical characteristics and one-way ANOVA (Obesity levels).
Fitness test Thin N = 72 NormalN = 45ObeseN = 26
Unit Mean SD Mean SD MeanSD F-valuep Tukey’s HSD Effect Size
Age (Year) 15.6 0.86 16.0 1.13 16.51.14
Height (cm) 168.7 5.53 168.7 5.92 168.75.53
Weight (kg) 52.8 6.06 59.1 8.14 81.712.14
BMI 18.5 1.71 20.7 2.49 27.94.45
Grip strength (kg 34.8 5.60 35.7 5.23 42.05.93 16.29*0.00Thin, Nomal < Obese Thin <Obese: 1.25
Sit-up (Times) 24.0 4.17 23.6 4.83 23.53.13 0.22 0.80
Sit and reach (Times) 39.6 6.28 39.8 9.72 42.57.56 1.39 0.25
Side-stepping (Times) 51.1 4.93 50.2 4.15 49.06.29 1.80 0.17
20-m shuttle r un (Times) 68.4 12.67 65.7 11.4946.511.78 32.14*0.00Obese < Thin, Nomal Obese < Thin: 1.76
50-m run (s) 8.3 0.55 8.5 0.57 8.7 0.54 5.99* 0.00Thin < Obese Thin < Obese: .79
Standing br oad jump (cm) 200.5 17.78 192.9 14.86180.723.1011.87*0.00Obese < Thin, Nomal Obese < Thin: 1.03
Handball throwing (m) 18.0 3.28 18.1 4.16 17.14.05 0.68 0.51
Total score (Points) 37.9 4.33 36.9 4.98 35.24.99 3.46* 0.03Obese < Thin Obese < Thin: .61
*
: p < .05.
Copyright © 2013 SciRes. 77
T. KITABAYASHI ET AL.
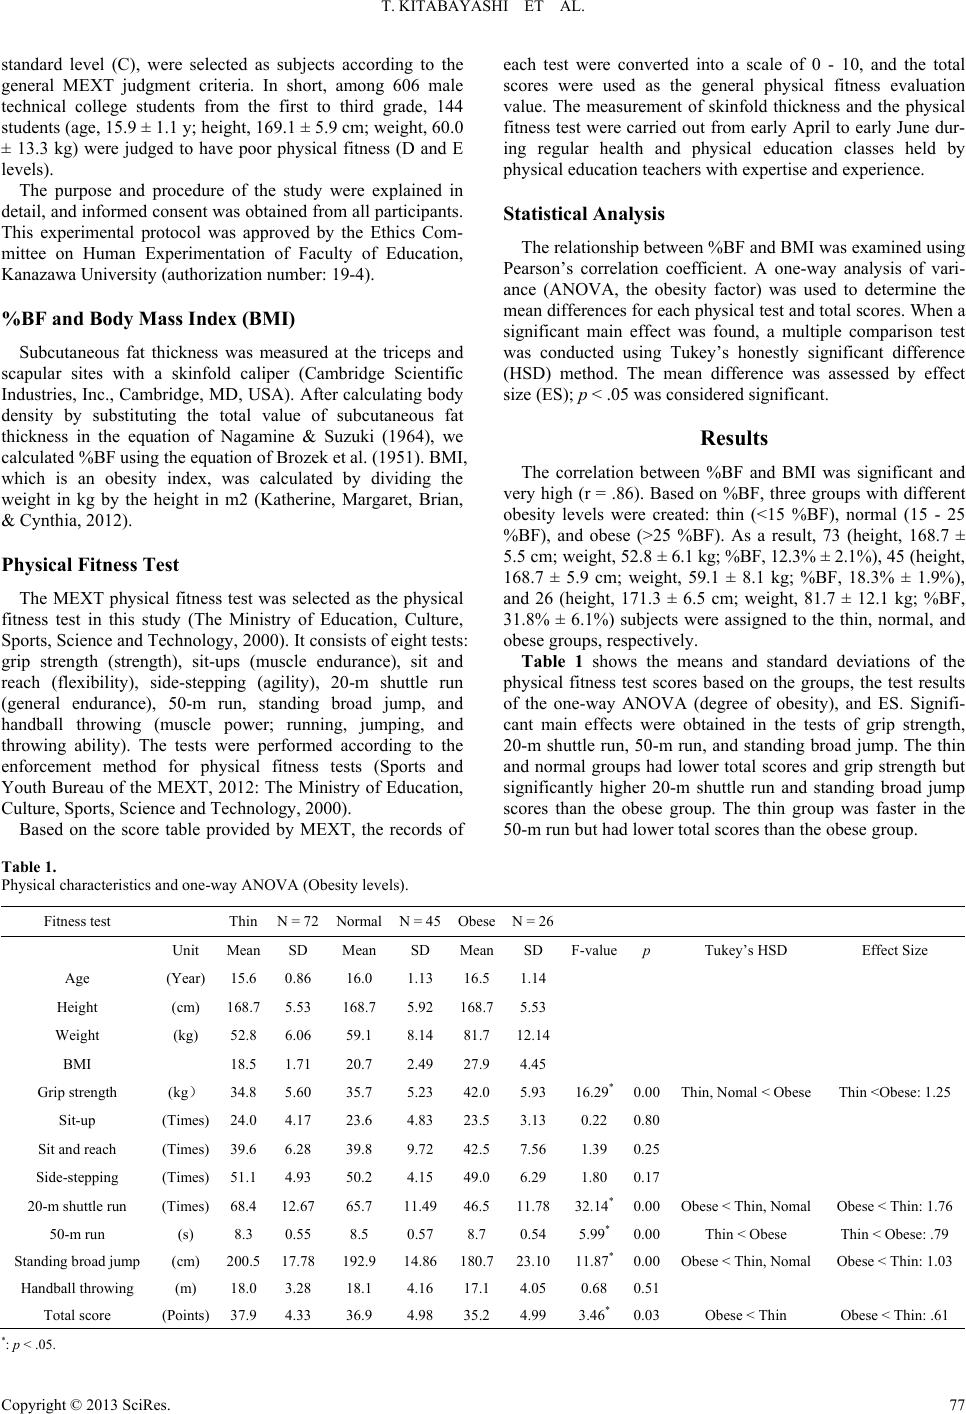
ESs between the mean of the obese group and the thin and
normal groups were 1.24 and 1.14 for grip strength, 1.76 and
1.66 for the 20-m shuttle run, and 1.03 and .67 for the standing
broad jump, respectively, and ES between the mean of the thin
group and obesity group was .79 for the 50-m run; the total
score was .61.
Discussion
The MEXT physical fitness test classifies the physical fitness
of young people into five grades based on the total score. The
subjects in the present study were all judged to have poor
physical fitness, corresponding to the D or E level, which is
lower than the standard level (C) among the five grades. Hence,
their physical fitness was considered to be inferior to that of
young people of the same generation.
The degree of obesity is generally determined by %BF. BMI
calculated from the height and weight has also been used
worldwide as a simple index of the degree of obesity in young
people. However, BMI has a limitation when used for subjects
with large muscle mass, such as athletes because of an
over-evaluating effect (Demura, 2011). However, it may be a
useful parameter to evaluate body composition in subjects other
than athletes because a strong relationship exists between the
two parameters (r = .86); thus, the grouping based on %BF
were judged to be valid.
Handgrip strength is used as an index of muscle strength be-
cause the results can be generalized to the whole body (Demura,
2011; The Ministry of Education, Culture, Sports, Science and
Technology, 2000). Grip strength was significantly greater in
the obese group (42 kg) than in the normal and thin groups,
with a large difference (ES = 1.14 - 1.24), and was comparable
to that of the Technical college students (grade 1, 41.5 kg;
grade 2, 43.6 kg; grade 3, 44.1 kg) who engage in high fre-
quency physical exercise (3 - 4 times/week) (Shima da, Demura ,
& Yamada, 2010). On the other hand, grip strength of the thin
group (34.8 kg) and the normal group (35.7 kg) was lower than
that of the obese group by 7 - 8 kg on an average. Grip strength
in the thin and normal groups was lower than the standard value
of the same generation. Hence, inferior muscle strength may be
a main factor of inferior physical fitness in the thin and normal
groups.
In particular, thin individuals tended to enforce weight loss
and dietary limitations more than that required because of an
excessive desire for a slim body (Hayano, 2002). As a result, a
risk of reduction in the amount of BF as well as muscle mass
has been indicated.
The 20-m shuttle run has been used as an index of general
endurance because of its strong correlation with VO2 max It
was significantly inferior in the obese group than in the thin and
normal groups (46.5 times), showing a very large difference
(ES = 1.66 - 1.76). In contrast to muscle strength, general en-
durance in the obese group was particularly inferior compared
with that in young people with poor physical fitness. In case of
the 20-m shuttle run, heavy weight because of large body
movements was considered to greatly affect performance and
impose a large burden on the knee joints of obese subjects. A
similar tendency was found in the 50-m run and standing broad
jump that require rapid body movements, wherein the obese
group was found to be inferior to the other groups.
The weight of obese subjects affects the motor ability tests,
which involve large body movements such as running and
jumping. Thus, it is necessary for obese subjects to reduce BF
mass while maintaining muscle mass to improve these physical
fitness elements related to running and jumping. No significant
difference was observed for tests such as sit-ups (general en-
durance), sit and reach (flexibility), side-stepping (agility), and
the handball throw (muscle power; throwing ability). These
tests do not require much body movement and are completed
within a relatively short time. Therefore, there was little effect
of body weight on performance. However, the mean values for
each group on these tests were equal to or less than the standard
value. This may be the main cause of poor physical fitness
among our subjects, which is common in all subjects with poor
physical fitness.
In particular, scores of the handball throw test were lower
than those of the other tests (approximately 18 m: 3 points).
The throwing movement is complex and requires energy gener-
ated by lower limbs to be amplified and transmitted smoothly
from the trunk to the upper limbs. It also requires whole-body
coordination in addition to muscle strength.
The following may be offered as the standard exercise pre-
scription to improve physical fitness of young males with poor
physical fitness. Strength improvement training is recom-
mended for thin or normal people with poor physical fitness
because they generally tend to have inferior muscular function.
On the other hand, obese people need to improve endurance
power through running/jumping exercises. These exercises may
be combined with strength training to increase basal metabo-
lism and aerobic exercise to reduce BF, considering the burden
on blood pressure and the joints. Furthermore, it may be desir-
able to include ball games promoting nerve functions into an
exercise program because all young people with poor physical
fitness perform inadequate exercise.
Conclusion
In conclusion, the cause of poor physical fitness was differ-
ent between the obese and thin groups among young people
with poor physical fitness. The obese group was superior in
muscle strength but inferior in general endurance and power
related to running and jumping, whereas the thin group was
inferior in muscle strength. Other physical fitness elements
showed little group differences.
Among young males with poor physical fitness, obese indi-
viduals have different physical fitness characteristics from
normal and thin individuals and are inferior to normal and thin
individuals in power and endurance of the whole body related
to running and jumping but superior in muscle strength.
Acknowledgements
This work was supported by Fukui National College Tech-
nology. The authors thank Prof. Shigeru Shimada and Dr. Ta-
kayoshi Yamada for their assistance with data collection. The
authors also thank Enago (www.enago.jp) for the English lan-
guage review.
REFERENCES
Barnekow-Bergkvist, M., Hedberg, G., Janlert, U., & Jansson, E.
(1988). Prediction of physical fitness and physical activity level in
adulthood by physical performance and physical activity in adoles-
cence-an 18-year follow-up study. Scandinavian Journal of Medicine
Copyright © 2013 SciRes.
78
T. KITABAYASHI ET AL.
& Science in Sports, 8, 299-308.
doi:10.1111/j.1600-0838.1998.tb00486.x
Beunen, G., Malina, M. R., Ostyn, M., Renson, R., Simons, J., & Van
Gerven, D. (1983). Fatness, growth and motor fitness of Belgian
boys 12 through 20 years of age. Human Biology, 55, 599-613.
Brozek, J., & Keys, A. (1951). The evaluation of leanness-fatness in
man: Norms and interrelationships. British Journal of Nutrition, 5,
194-206. doi:10.1079/BJN19510025
Demura, S. (2011). Health and a sports science lecture (2nd ed., pp.
38-59). Tokyo: Kyor insyoin Press.
Hayano, H. (2002). A psychological study on eating disorders tendency
of male college students. Journal of Japanese Clinical Psychology,
20, 44-51.
Iwai, K., Matuki, M., Koshida, S., Tanaka, K., Miyashita, K., & Urabe,
Y. (2008). Association between progression of underweight and
overweight status and physical fitness improvements in the youth: A
one-year follow-up study. The Japanese Society of Physical Fitness
and Sport Medicine, 5 7, 491-502. doi:10.7600/jspfsm.57.491
Katherine, F. M., Margaret, C. D., Brian, K. K., & Cynthia, O. L.
(2012). Prevalence of obesity and trends in the distribution of body
mass index among US adults, 1999-2010. JAMA, 30 7, 491-497.
doi:10.1001/jama.2012.39
Kim, R. H., Matsuura, Y., Tanaka, K., & Inagaki, A. (1933). Physical
fitness and motor ability in obese girls aged 12 to 14 years. The
Japanese Society of Physical Fitness and Sport Medicine, 42, 380-
388.
Mikkelsson, L., Kaprio, J., Kau tiainen, H., Kujala, U., Mikk elsson, M.,
& Nupponen, H. (2006). School fitness tests as predictors of adult
health-related fitness. American Journal of Human Biology, 18, 342-
349. doi:10.1002/ajhb.20498
Nagamine, S., & Suzuki, S. (1964). Anthropometry and body composi-
tion of Japanese am o ng men and women. Human Biology, 36, 8-15.
Shimada, S., Demura S., & Yamada T. (2010). Characteristics of life
style and health-status based on longitudinal data for three years of
Japanese male students in the national college of technology. The
Journal of Education and He al t h Sc ience, 55, 293- 304.
Sports and Youth Bureau of the MEXT (2012). The research report of
physical fitness and exercise capacity 2011. Tokyo: The Ministry of
Education, Culture , Sports, Science and T e c hn ol o gy Press.
The Ministry of Education, Culture, Sports, Science and Technology
(2000). New physical fitness test. Tokyo: Gyousei.
Tokyo Metropolitan University (2007). New standard value of Japa-
nese physical fitness 2. Tokyo: Fumaidou.
Copyright © 2013 SciRes. 79