Applied Mathematics
Vol.3 No.10A(2012), Article ID:24104,7 pages DOI:10.4236/am.2012.330207
Parameters Optimization Using Genetic Algorithms in Support Vector Regression for Sales Volume Forecasting
Department of Information Management, Yuan Ze University, Chung-Li, Chinese Taipei
Email: imyuan@saturn.yzu.edu.tw
Received July 10, 2012; revised August 10, 2012; accepted August 17, 2012
Keywords: Budgeting Planning; Sales Volume Forecasting; Artificial Intelligent; Support Vector Regression; Genetic Algorithms; Artificial Neural Network
ABSTRACT
Budgeting planning plays an important role in coordinating activities in organizations. An accurate sales volume forecasting is the key to the entire budgeting process. All of the other parts of the master budget are dependent on the sales volume forecasting in some way. If the sales volume forecasting is sloppily done, then the rest of the budgeting process is largely a waste of time. Therefore, the sales volume forecasting process is a critical one for most businesses, and also a difficult area of management. Most of researches and companies use the statistical methods, regression analysis, or sophisticated computer simulations to analyze the sales volume forecasting. Recently, various prediction Artificial Intelligent (AI) techniques have been proposed in forecasting. Support Vector Regression (SVR) has been applied successfully to solve problems in numerous fields and proved to be a better prediction model. However, the select of appropriate SVR parameters is difficult. Therefore, to improve the accuracy of SVR, a hybrid intelligent support system based on evolutionary computation to solve the difficulties involved with the parameters selection is presented in this research. Genetic Algorithms (GAs) are used to optimize free parameters of SVR. The experimental results indicate that GA-SVR can achieve better forecasting accuracy and performance than traditional SVR and artificial neural network (ANN) prediction models in sales volume forecasting.
1. Introduction
Sales forecasting is a self-assessment tool for a company. The managers have to keep taking the pulse of their company to know how healthy it is. A sales forecast reports, graphs and analyzes the pulse of the business. It can make the difference between just surviving and being highly successful in business. It is a vital cornerstone of a company’s budget. The future direction of the company may rest on the accuracy of sales forecasting [1].
For sales forecasting to be valuable to the business, it must not be treated as an isolated exercise. Rather, it must be integrated into all facets of the organization. Thus, all enterprises are working on the exploitation of prediction methods, which decide the success and failure of an enterprise [2,3].
Business forecasting has consistently been a critical organizational capability for both strategic and tactical business planning [4]. Thus, how to improve the quality of forecasts is still an outstanding question [5]. For data containing trend or/and seasonal patterns, failure to account for these patterns may result in poor forecasts. Over the last few decades when dealing with the problems of sales forecasting, traditional time series forecasting methods, such as exponential smoothing, moving average, Box Jenkins ARIMA, and multivariate regressions etc., have been proposed and widely used in practice to account for these patterns, but it always doesn’t work when the market fluctuates frequently and at random[6,7]. Therefore, Research on novel business forecasting techniques have evoked researchers from various disciplines such as computational artificial intelligence.
An artificial neural network (ANN) is a new contender in forecasting sophisticated trend and seasonal data. Artificial intelligent models have more flexibility and can be used to estimate the non-linear relationship, without the limits of traditional time series models [8]. Therefore, more and more researchers tend to use AI forecasting models to deal with forecasting problems. Artificial neural network (ANN) has strong parallel processing and fault tolerant ability. However, the practicability of ANN is affected due to several weaknesses, such as over-fitting, slow convergence velocity and relapsing into local extremum easily [9].
Support Vector Machines (SVM), a more recent learning algorithm that has been developed from statistical learning theory [10,11], has a very strong mathematical foundation and has been shown to exhibit excellent performance in time series forecasting [7,12-14] and in classification [15,16]. SVM is a new machine learning method based on the statistical learning theory, which solves the problem of over-fitting, local optimal solution and low convergence rate existed in ANN and has excellent generalization ability in the situation of small sample. When SVM is used in regression, it is called support vector regression (SVR). However, the select of appropriate SVR parameters is difficult. A highly effective model can be built after the parameters of SVR are carefully determined [17].
Whereas GA has strong global search capability[18], support vector regression optimized by genetic algorithm (GA-SVR) is proposed to forecast the sales volume, among which GA is used to determine training parameters of support vector regression [19,20]. The GA proposed by Holland [21] is derivative-free stochastic optimization method based on the concepts of natural selection and evolutionary processes. The GA also encodes each point in a parameter space into a binary bit string called a chromosome. Major components of this algorithm include encoding schemes, fitness evaluation, parent selection, crossover, and mutation operators. GASVR has been used in many fields and proved be a very effective method [11,19,22], but not used in sales volume forecasting. Therefore, in this research, the hybrid improved intelligent models, GA-SVR, will be discussed for forecasting monthly sales volume of car industry and compared with ANN and other traditional models.
The rest of the paper is organized as follows. Section 2 describes the theory of support vector regression. Section 3 presents the experiment design. The data of sales volume of a car manufacturer in Taiwan is used as a case study to test the reliability and accuracy of the proposed model. Section 4 contains experimental results and analysis. Finally, Section 5 concludes the paper.
2. Theory of Support Vector Regression
The basic concept of SVR is that nonlinearly the original dataset xi is mapped into a high-dimensional feature space. Given data set  where xi is the input vector, yi is the associated output value of xi The SVR regression function is:
 (1)
(1)
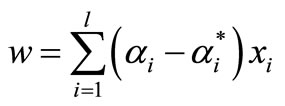
where  denotes the non-linear mapping function, w is the weight vector and b is the bias term. The goal of SVR is to find a function
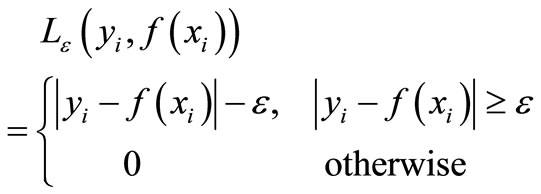
  that has at most ε deviation from the targets yi for all the training data and, at the same time, is as flat as possible. In SVR, ε-insensitive loss function is introduced to ensure the sparsity of support vector, which is defined as:
 (2)
(2)
where the loss equals zero if the error of forecasting values is less than ε, otherwise the loss equals value larger than ε.
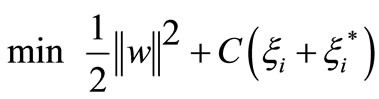
As with the classification problem, non-negative slack variables,  and
and , can be introduced to represent the distance from actual values to the corresponding boundary values of the ε-tube. Then, the constrained form can be formulated as follows:
 (3)
(3)
Subject to
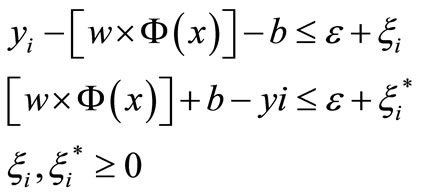
where C denoted a cost function measuring the empirical risk.
Finally, the constrained optimization problem is solved using the following Lagrange form:
Max
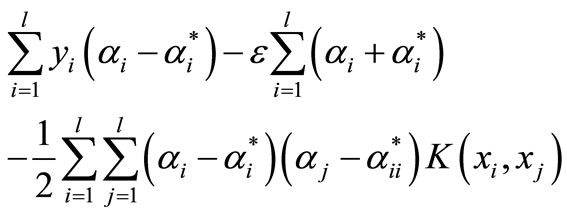 (4)
(4)
Subject to
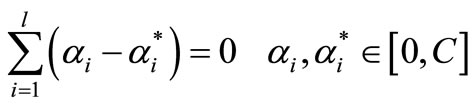
where  and
and  are Lagrange multipliers.
 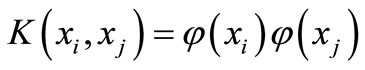 is a so-called kernel function. By using a kernel function, it is possible to compute the SVR without explicitly mapping in the feature space. The condition for choosing kernel functions should conform to Mercer’s condition, which allows the kernel substitutions to represent do products in some Hilbert space. SVM constructed by Gaussian radial basis function (RBF)
  has excellent nonlinear forecasting performance. Thus, in this work, RBF is used in the SVR.
Equation (1) can now be rewritten as follows:
 , and therefore
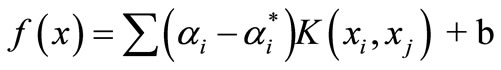 (5)
(5)
The training parameters C, σ and ε greatly affect the forecasting performance of SVR. However, the appropriate select of these SVR parameters is very difficult. In this research, GA is used to optimize the training parameters. GA has strong global search capability, which can get optimal solution in short time [20]. So GA is used to search for better combinations of the parameters in SVR. After a series of iterative computations, GA can obtain the optimal solution. The methods and process of optimizing the SVR parameters with genetic algorithm is described as follows:
2.1. Initial Value of SVR Parameters
In our proposed novel GA-SVR model, the training parameters C, σ and ε of SVR are dynamically optimized by implementing the evolutionary process with a randomly generated initial population of chromosomes, and the SVR model then performs the prediction task using these optimal values. Our approach simultaneously determines the appropriate type of kernel function and optimal kernel parameter values for optimizing the SVR model. The process of optimizing the SVR parameters with genetic algorithm is shown in Figure 1.
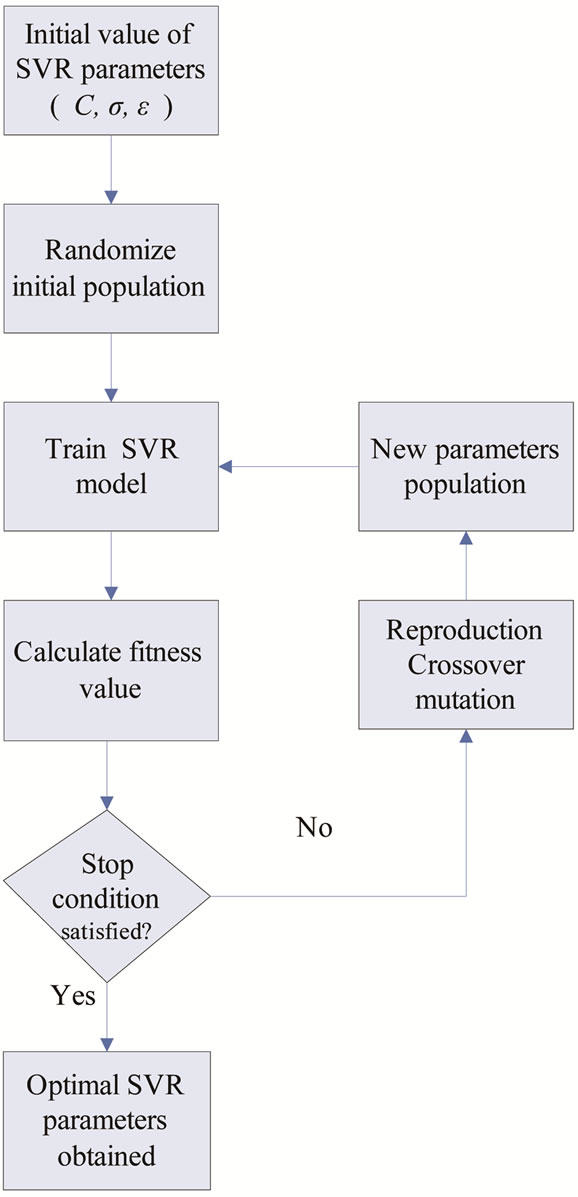
Figure 1. The process of SVR parameters optimized by genetic algorithm.
2.2. Genetic Operations
Generally, genetic algorithm uses selection, crossover and mutation operation to generate the offspring of the existing population as described as follows:
“Selection” operator: Selection is performed to select excellent chromosomes to reproduce. Based on fitness function, chromosomes with higher fitness values are more likely to yield offspring in the next generation by means of the roulette wheel or tournament method to decide whether or not a chromosome can survive into the next generation. The chromosomes that survive into the next generation are then placed in a mating pool for the crossover and mutation operations. Once a pair of chromosomes has been selected for crossover, one or more randomly selected positions are assigned into the to-be-crossed chromosomes. The newly-crossed chromosomes then combine with the rest of the chromosomes to generate a new population. Suppose there are m individuals, we select [m/2] individuals but erase the others, the ones we selected are “more fitness” that means their profits are greater.
“Crossover” operator: Crossover is performed randomly to exchange genes between two chromosomes. Suppose ,
,  , are two chromosomes, select a random integer number 0
  r
r  n, S3, S4 are offspring of crossover (S1, S2),
 ,
,
 .
.
“Mutation” operator: The mutation operation follows the crossover to determine whether or not a chromosome should mutate to the next generation. Suppose a chromosome S1 = {s11, s12, ···, s1n}, select a random integer number 0  r
r  n, S3 is a mutation of S1, S3 = {si | if i
  r, then si = s1i, else si = random (s1i)}.
Offspring replaces the old population and forms a new population in the next generation by the three operations, the evolutionary process proceeds until stop conditions are satisfied.
2.3. Calculation of the Fitness Value
A fitness function assessing the performance for each chromosome must be designed before searching for the optimal values of the SVR parameters. Several measurement indicators have been proposed and employed to evaluate the prediction accuracy of models such as MAPE and RMSE in time-series prediction problems. To compare the results achieved by the present model, this research adopts Mean Absolute Percentage Error (MAPE) to evaluate the performance.
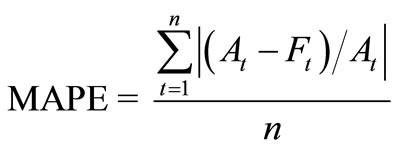 (6)
(6)
where At is the actual values for period t, Ft the expected value for period t and n is the number of training samples. The smaller the values of MAPE, the better the forecasting models will be. The smaller values mean that the calculating results are closer to the historic actual data.
3. Experiment Design
In this research, the monthly sales volume of trucks and small cars of a car manufacturer in Taiwan, and other input variables, such as stock index, jobless rate, GDP per person, CPI, CCI, US dollars, Yen, Euro, and average gasoline price, were collected during the period from 2003~2009.
For comparison purpose, several commonly used forecasting models, such as Least-Mean Square Algorithm (LMS), Artificial Neural Networks (ANNs), and Support Vector Regression (SVR), are also applied.
In the experiments, the models are trained using training data, and are applied to testing data. Thus, the models are trained with input data from the year 2003 and output data (forecasted monthly sales volume) from 2004. Then the data from the year 2004 were entered as testing data in order to forecast the monthly sales volume from 2005. For later years the data from all the previous years were used in the training phase. In a subsequent cross-section analysis the mean absolute percentage error (MAPE) is used to evaluate the forecasting accuracy.
4. Experimental Results and Analysis
After using the above-mentioned data and implementing the computational procedure, the monthly prediction results of forecasting models for trucks based on previous monthly sales volume and other factors during 2003-2009 are summarized in Table 1 and Figures 2-6, respectively. Accordingly, Table 2" target="_self"> Table 2 and Figure 7 report the MAPE results. All experimental results indicate that GA-SVR has more excellent performance than other models in forecasting monthly sales volume.
Considering the adaptability of GA-SVR, we also use four models above to predict the small car data set. As shown in Table 3 and Figure 8, the experimental results indicate that GA-SVR model can achieve better forecasting accuracy and performance than other models.
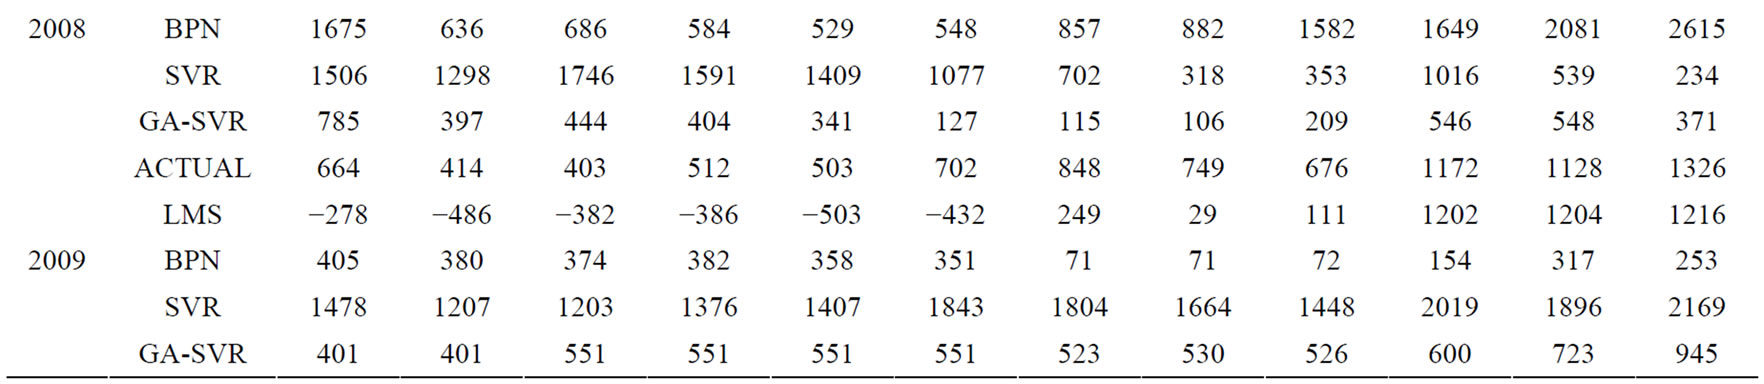
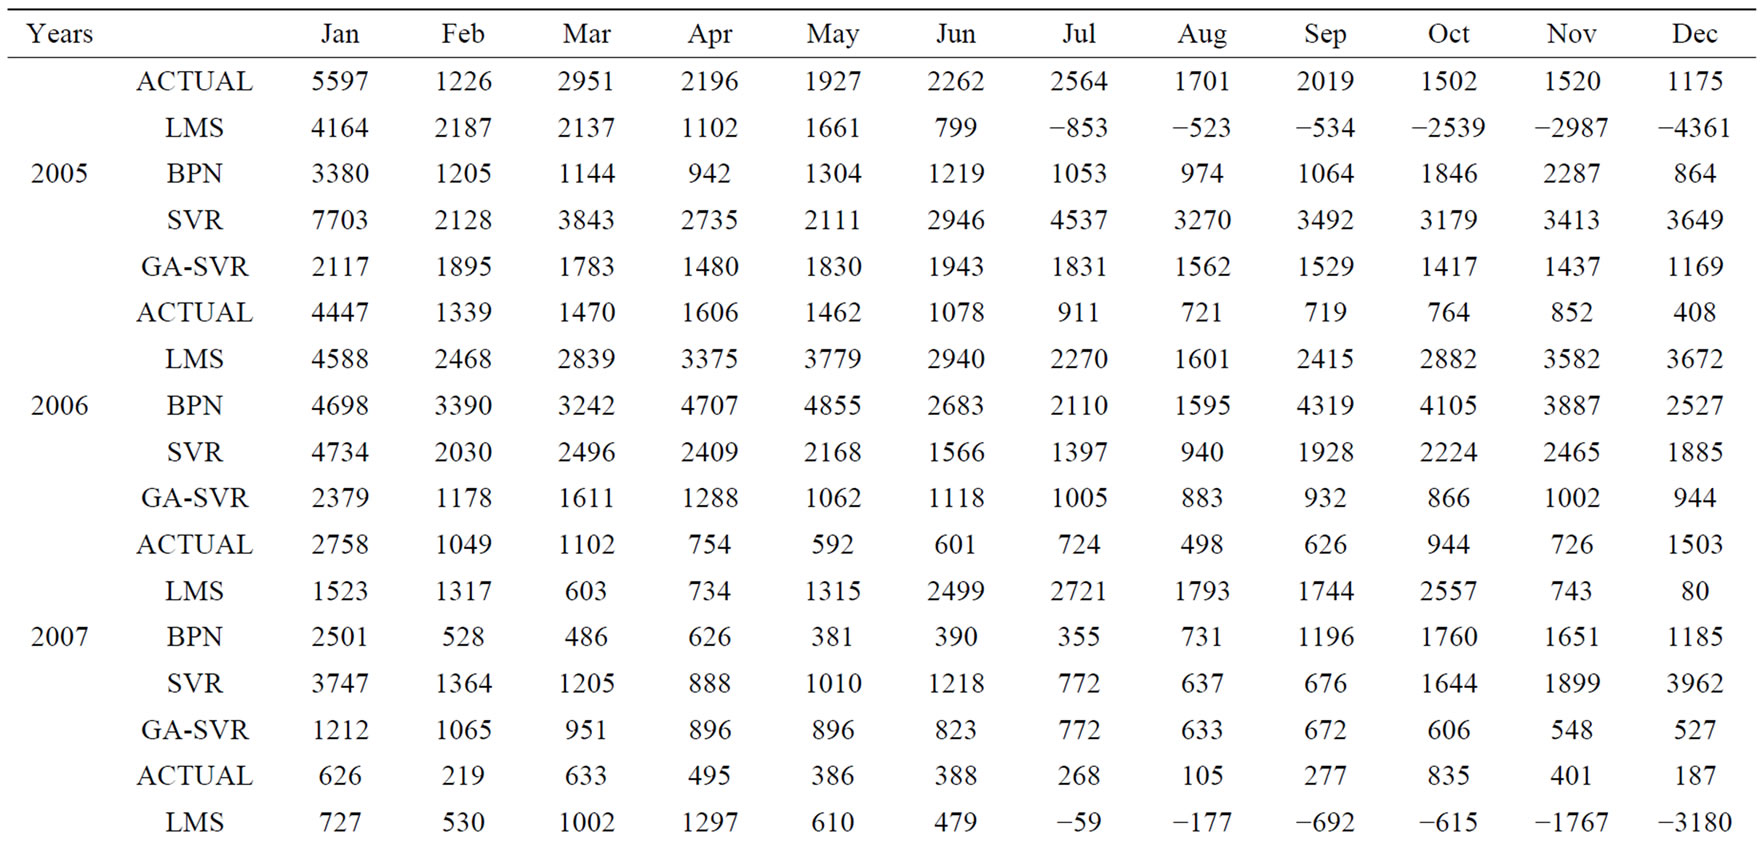
Table 1. Comparison of the prediction results for trucks from each model for 12 months from 2005-2009.
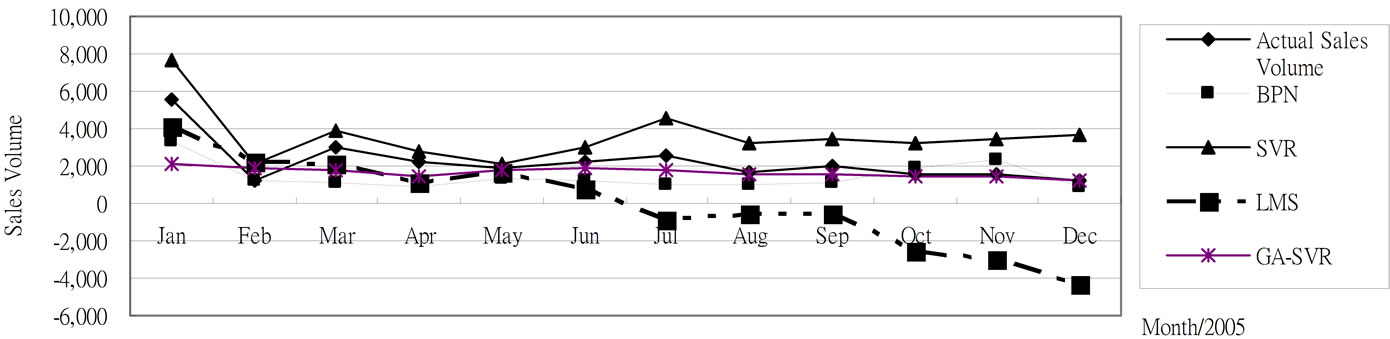
Figure 2. The 2005 monthly prediction results for trucks based on 2004 testing data.
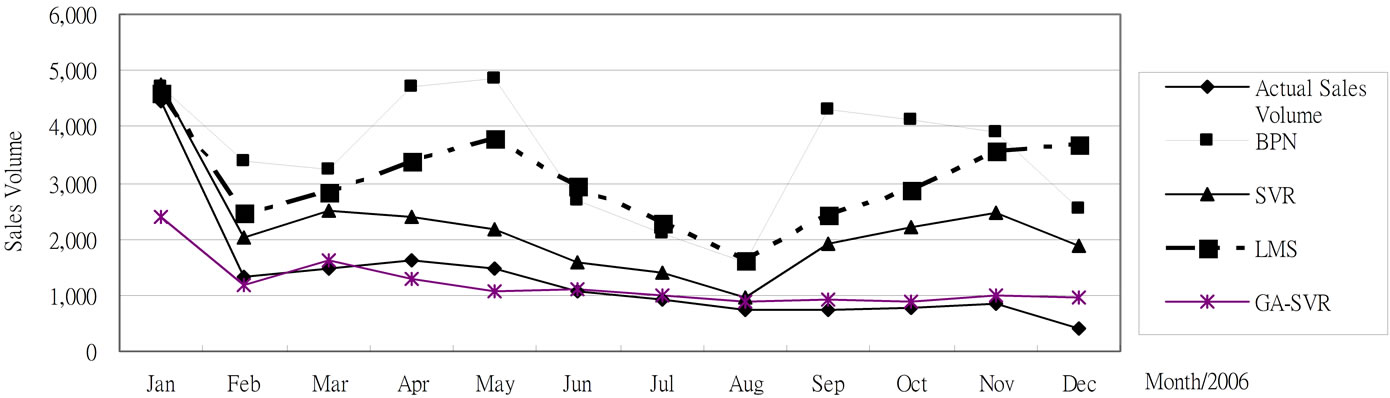
Figure 3. The 2006 monthly prediction results for trucks based on 2005 testing data.
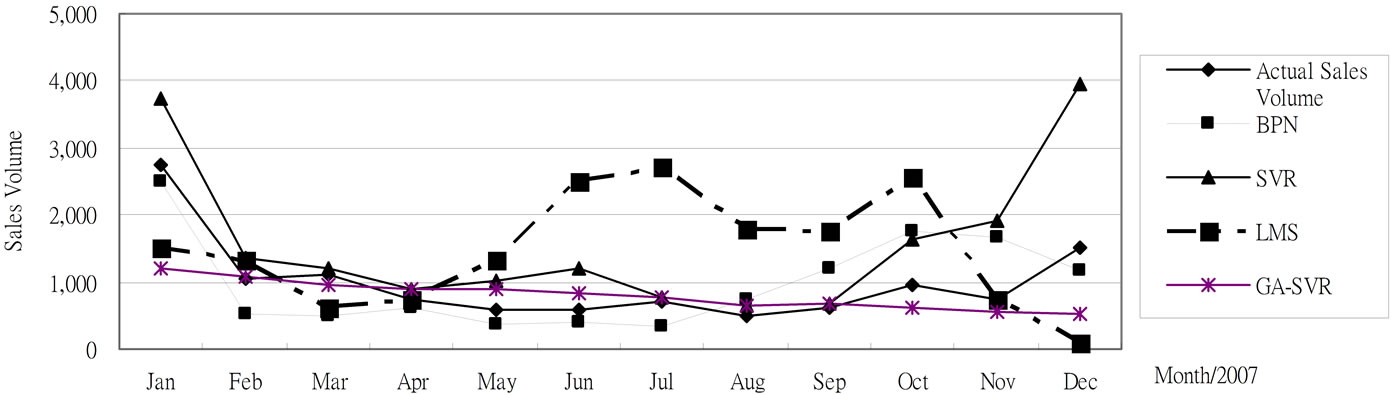
Figure 4. The 2007 monthly prediction results for trucks based on 2006 testing data.
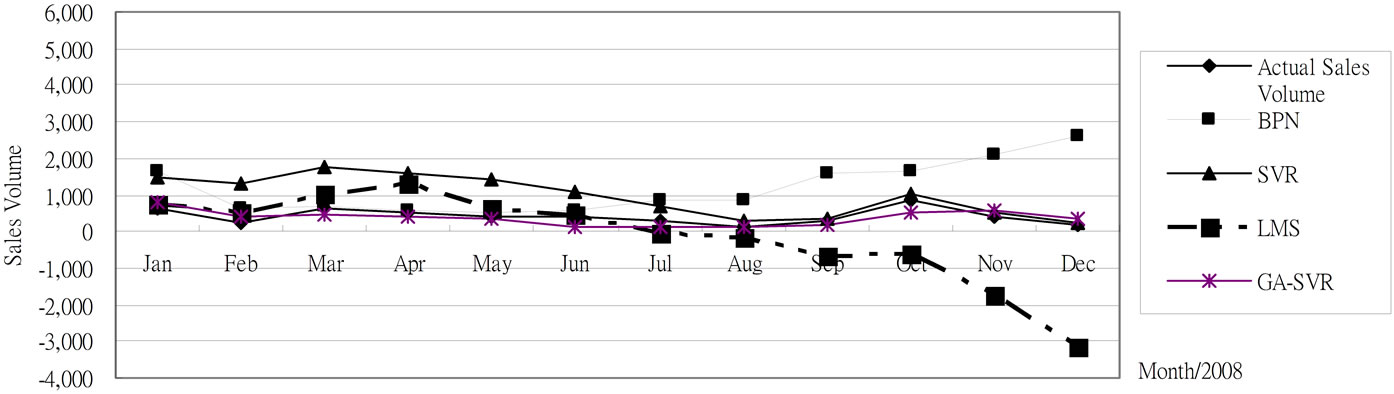
Figure 5. The 2008 monthly prediction results for trucks based on 2007 testing data.
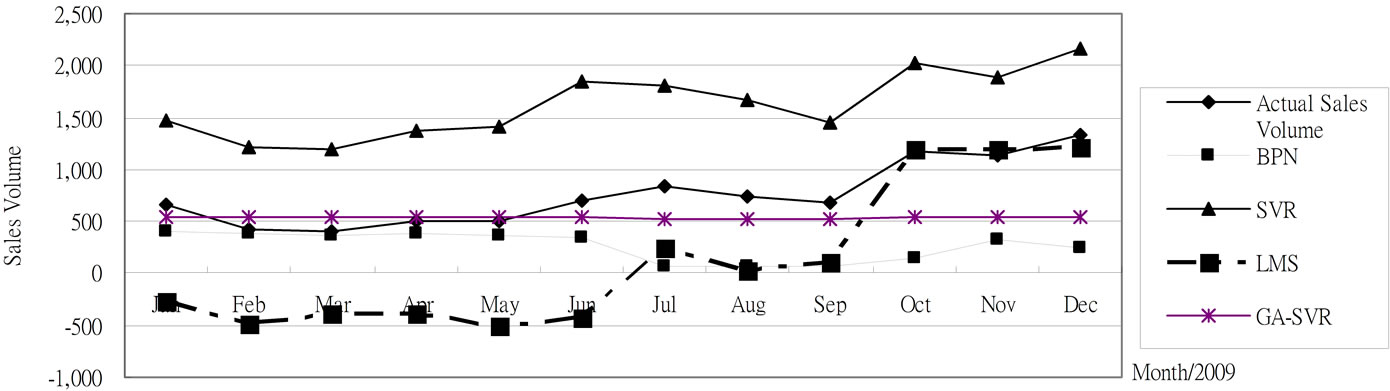
Figure 6. The 2009 monthly prediction results for trucks based on 2008 testing data.
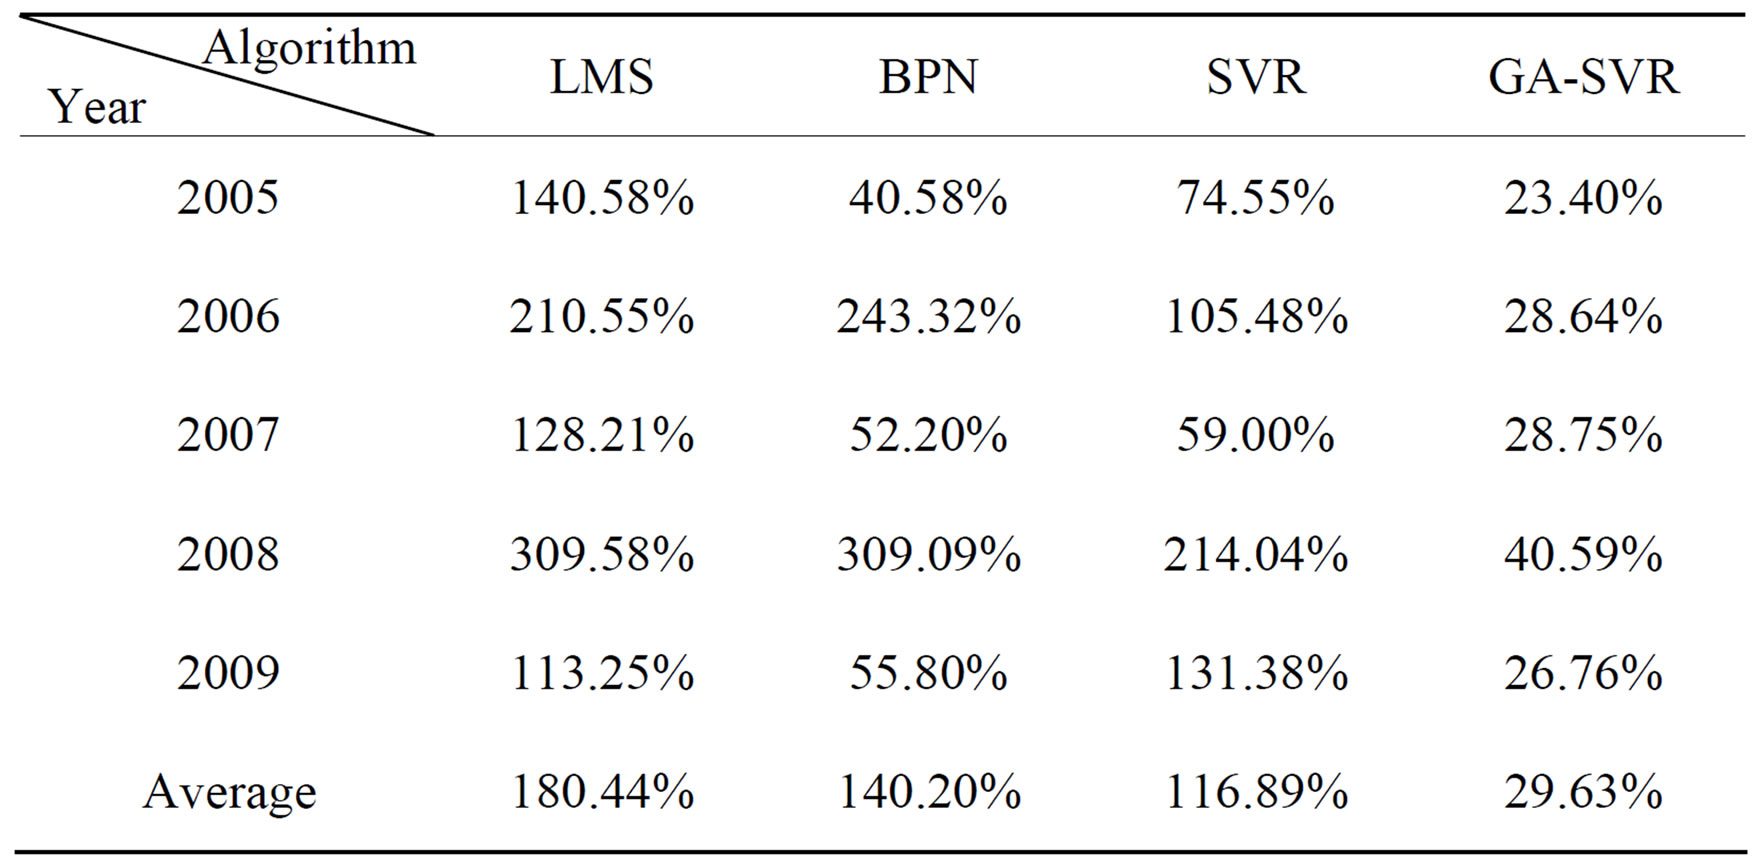
Table 2. Comparison of the MAPE results for trucks.
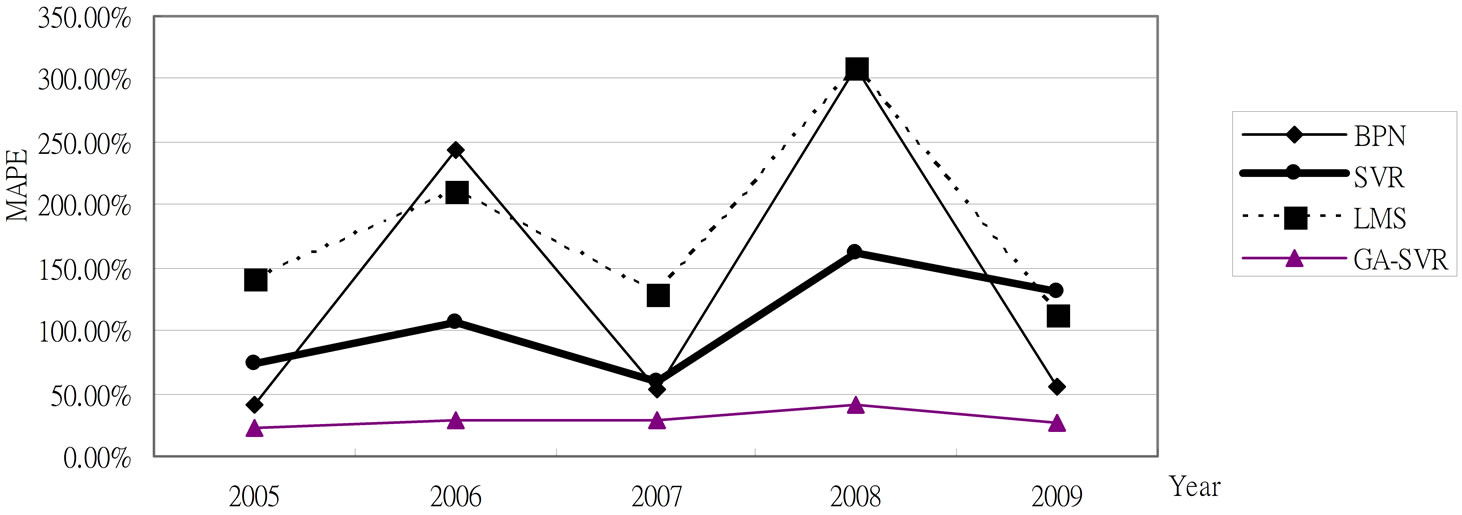
Figure 7. Comparison of the MAPE results for trucks.
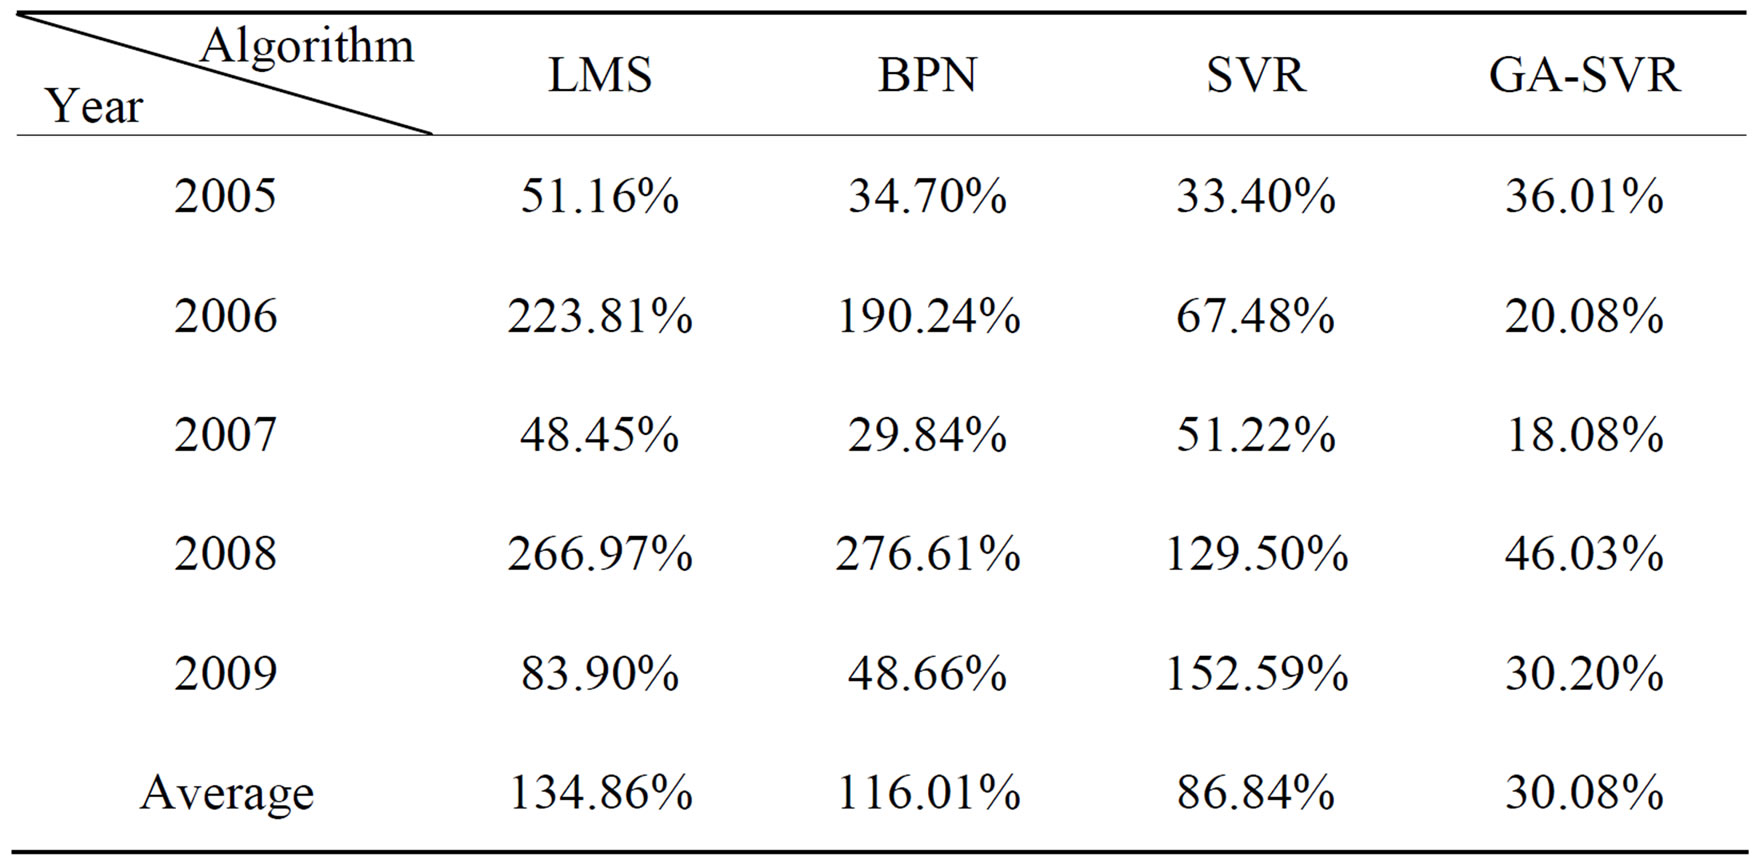
Table 3. Comparison of the MAPE results for small cars.
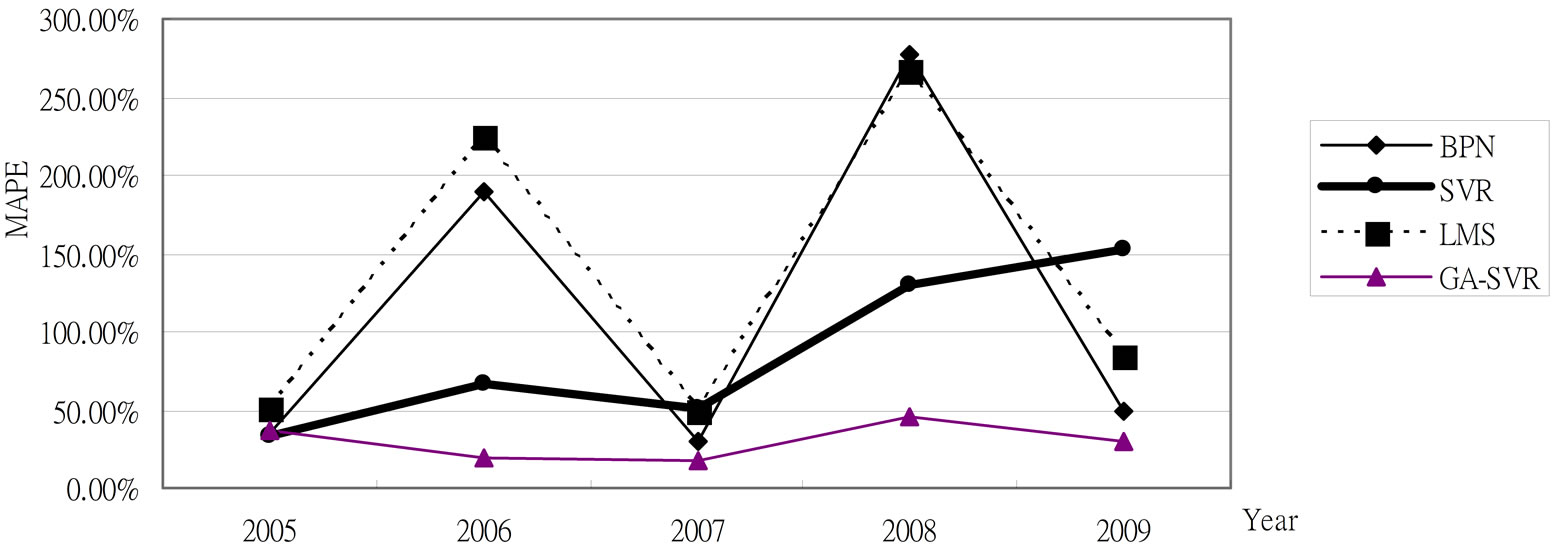
Figure 8. Comparison of the MAPE results for small cars.
5. Conclusion
The sales forecasting process is a critical one for most business. GA-SVR is applied to forecast the car sales volume in this study. In GA-SVR model, GA is used to select optimal parameters of SVR, among which the MAPE method is determined to evaluate fitness. The monthly sales volume of a car manufacturer in Taiwan from 2003 to 2009 is used as our research data. The experimental results show that GA-SVR can achieve a greater forecasting accuracy than artificial neural network and other traditional models. Even the WTO impact to Taiwan car industry in 2006 and the unexpected financial tsunami in 2008, GA-SVR forecasting capability still outperforms than other methods.
6. Acknowledgements
The author would like to thank the National Science Council, Taiwan, ROC for financially supporting this research under Contract Nos. NSC101-2410-H-155-004.
REFERENCES
- R. H. Garrison and E. W. Noreen, “Managerial Accounting 10/e,” McGraw-Hill, New York, 2003.
- J. Stack, “A Passion for Forecasting,” Springfield Manufacturing, Inc., Springfield, 1997, pp. 37-38.
- C. D. Lewis, “Industrial and Business Forecasting Methods,” Butterworths, London, 1982.
- R. Fildes, R. Hastings, “The Organization and Improvement of Market Forecasting,” Journal of Operation Research Society, Vol. 45, No. 1, 1994, pp. 1-16.
- C. W. J. Granger, “Can We Improve the Perceived Quality of Economic Forecasts?” Journal Applied Econometric, Vol. 11, No. 5, 1996, pp. 455-473.
- M. Lawrence and M. O’Connor, “Sales Forecasting Updates: How Good Are They in Practice?” International Journal of Forecasting, Vol. 16, No. 3, 2000, pp. 369- 382. doi:10.1016/S0169-2070(00)00059-5
- Y. K. Bao, Y. S. Lu and J. L. Zhang, “Forecasting Stock Price by SVMs Regression,” Lecture Notes in Artificial Intelligence, Vol. 3192, 2004, pp. 295-303.
- R. J. Kuo and K. C. Xue, “A Decision Support System for Sales Forecasting through Fuzzy Neural Networks with Asymmetric Fuzzy Weights,” Decisions Support Systems, Vol. 24, No. 2, 1998, pp. 105-126. doi:10.1016/S0167-9236(98)00067-0
- R. Capparuccia, R. De. Leone, E. Marchitto, “Integrating Support Vector Machines and Neural Networks,” Neural Networks, Vol. 20, No. 5, 2007, pp. 590-597. doi:10.1016/j.neunet.2006.12.003
- V. N. Vapnik, “The Nature of Statistical Learning Theory,” Springer, New York, 1995.
- V. Vapnik, S. Golowich and A. Smola, “Support Vector Method for Function Approximation, Regression Estimation and Signal Processing,” In: M. Mozer, M. Jordan and T. Petsche, Eds., Advance in Neural Information Processing System, MIT Press, Cambridge, 1997, pp.281-287.
- K. R. Muller, A. J. Smola, G. Ratsch, B. Scholkopf, J. Kohlmorgen and V. Vapnik, “Prediction Time Series with Support Vector Machines,” Lecture Notes in Computer Science, Vol. 1327, 1997, pp. 999-1004. doi:10.1007/BFb0020283
- E. H. T. Francis and L. Cao, “Application of Support Vector Machines in Financial Time Series Forecasting,” International Journal of Management Science, Vol. 29, No. 4, 2001, pp. 309-317
- B. Yukun, R. Zhang and S. F. Crone, “Fuzzy Support Vector Machines Regression for Business Forecasting: An Application,” Fuzzy Systems and Knowledge Discovery, Vol. 4223, 2006, pp. 1313-1317.
- L. Yu, S. Wang and J. Cao, “A Modified Least Squares Support Vector Machine Classifier with Application to Credit Risk Analysis,” International Journal of Information Technology & Decision Making, Vol. 8, No. 4, 2009, pp. 697-710. doi:10.1142/S0219622009003600
- C. H. Zheng, G. W. Zheng and L. C. Jiao, “Heuristic Genetic Algorithm-Based Support Vector Classifier for Recognition of Remote Sensing Images,” In: Advance in Neural Networks, Lecture Notes in Computer Science, Springer-Verlag, New York, Vol. 3173, 2004, pp. 629- 635.
- K. Duan, S. S. Keerthi, A. N. Poo, “Evaluation of Simple Performance Measures for Tuning SVM Hyperparameters,” Neurocomputing, Vol. 51, No. 1-4, 2003, pp. 41-59. doi:10.1016/S0925-2312(02)00601-X
- M. Kaya, “MOGAMOD: Multi-Objective Genetic Algorithm for Motif Discovery,” Expert Systems with Applications, Vol. 36, No. 2, 2007, pp. 1039-1047. doi:10.1016/j.eswa.2007.11.008
- X. G. Chen, “Railway Passenger Volume Forecasting Based on Support Machine and Genetic Algorithm,” 2009 ETP International Conference on Future Computer and Communication, 6-7 June 2009, Wuhan, pp. 282-284. doi:10.1109/FCC.2009.81
- C. H. Wu, G. H. Tzeng and R. H. Lin, “A Novel Hybrid Genetic Algorithm for Kernel Function and Parameter Optimization in Support Vector Regression,” Expert Systems with Applications, Vol. 36, No. 3, 2009, pp. 4725- 4735. doi:10.1016/j.eswa.2008.06.046
- J. H. Holland, “Adaptation in Natural and Artificial Systems,” University of Michigan, MIT Press, Cambridge, 1975.
- P. F. Pai and W. C. Hong, “Forecasting Regional Electric Load Based on Recurrent Support Vector Machines with Genetic Algorithms,” Electric Power Systems Research, Vol. 74, No. 3, 2005, pp. 417-425. doi:10.1016/j.epsr.2005.01.006