 Modern Economy, 2010, 1, 149-155 doi:10.4236/me.2010.13017 Published Online November 2010 (http://www.SciRP.org/journal/me) Copyright © 2010 SciRes. ME Income Shocks and Consumption Smoothing Strategies: An Empirical Investigation of Maize Farmer’s Behavior in Kebumen, Central Java, Indonesia Teguh Dartanto1, Nurkholis2 1PhD Student, GSID, Nagoya University, Japan and Lecturer, Department of Economics, University of Indonesia, Indonesia 2Lecturer, Department of Economics, University of Indonesia, Indonesia E-mail: dartanto.teguh@a.mbox.nagoya-u.ac.jp Received August 28, 2010; revised September 30, 2010; accepted N ovember 5, 2010 Abstract Farmers in most developing countries usually face vulnerability in consumption due to income shocks caused by crop loss, price falls, disaster, sickness and death and unexpected expenditure. They will respond differently to income shocks depending on their asset ownership, labor endowment, access to loan, family assistance, and family structure. We quantitatively analyze the consumption smoothing strategies of maize farmers’ response to income shocks in Kebumen, Central Java-Indonesia. The Ordinary Least Square (OLS) method confirms that selling cattle plays a central role in protecting consumption especially from income shocks such as price falls and crop loss. Farmers that experienced income shocks related to demographic shocks such as sickness and death and experienced expenditure shocks related to custom such as birth, mar- riage and religious event require large effort by combining strategies to smooth their consumption. In this case, farmers are forced to sell their land even though it is a costly alternative. However, widening access to the loan market helps them maintain their consumption. Unfortunately, the hypothesis that the government policies such as cheap rice, cash transfer and health insurance are effective instrument to smooth consumption is not supported by consistent statistical evidences in all models. Keywords: Income Shock, Consumption Smoothing Strategy, Rural Economic Development, Government Assistance 1. Introduction Chronic poverty is a major obstacle faced by Kebumen, an agriculture based regency in the southern part of Cen- tral Java. Reference [1] reported that Kebumen’s poverty incidence in 2002 was 31.7% which is higher than either the provincial level (23.1%) or the national level (18.2%). In 2003, as one of poverty alleviation policies and creat- ing job opportunities, the government of Kebumen, in collaboration with a seed company and the central gov- ernment, supported farmers through sev eral incentives in maize cultivation. The incentives were a price discount of hybrid seeds, fertilizers and pesticides subsidies, as- sistances of post harvest process and a price guarantee1. Farmers started to cultivate maize and substituted other crops into maize. However, similar to farmers in most developing countries, they face vulnerability in con- sumption due to income shocks caused by crop loss, price falls, disaster, sickness and death and unexpected expenditure. Both external shocks such as disaster, cli- matic risks and economic fluctuations and individual specific shocks such as sick- ness, death and other cus- tom shocks make farmer households vulnerable to seri- ous hardship. A survey of 220 maize-farm-households was collected from the rural area in Kebumen during August 2009 . The survey shows that during the last five years, farmers faced crop loss due to disaster, climate shocks, pests, rodents and other calamities was about 59% and price falls was 73%. Moreover, households experienced demo- 1Suara Merdeka (03/17/2003), http://www.suaramerdeka.com/harian/ 0303/17/dar16.htm. Ministry of trade and industry, “MOU kerjasama Penanaman Jagung di Kebumen,” 2003. http://www.depeag.go.id/ files/publikasi/sigran pers/2003/kebuman2.htm 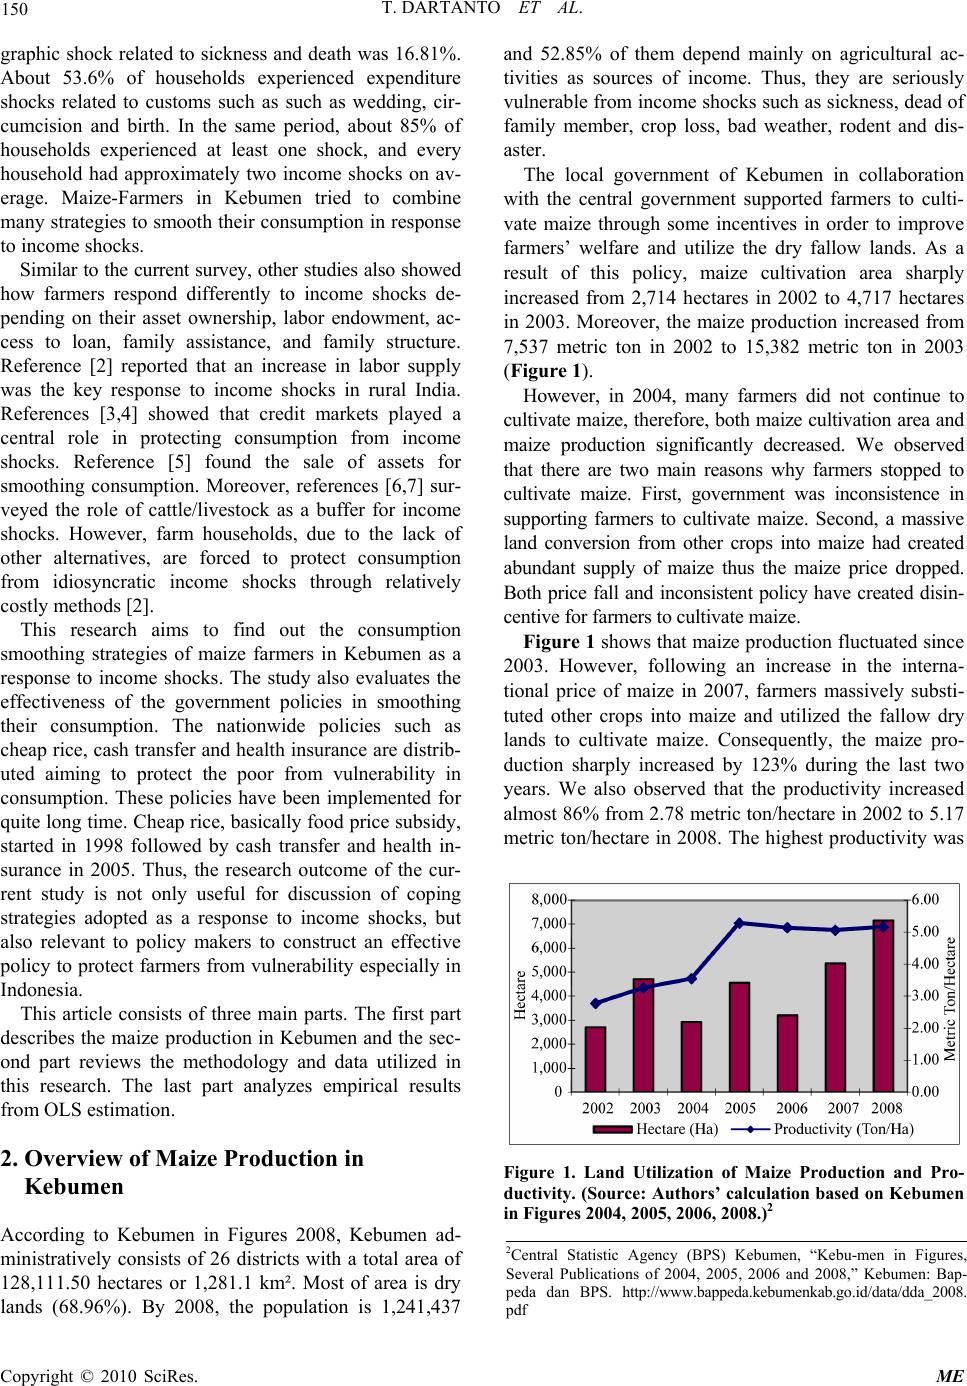 150 T. DARTANTO ET AL. graphic shock related to sickness and death was 16.81%. About 53.6% of households experienced expenditure shocks related to customs such as such as wedding, cir- cumcision and birth. In the same period, about 85% of households experienced at least one shock, and every household had approximately two income shocks on av- erage. Maize-Farmers in Kebumen tried to combine many strategies to smooth their consumption in response to income shocks. Similar to the current survey, other studies also showed how farmers respond differently to income shocks de- pending on their asset ownership, labor endowment, ac- cess to loan, family assistance, and family structure. Reference [2] reported that an increase in labor supply was the key response to income shocks in rural India. References [3,4] showed that credit markets played a central role in protecting consumption from income shocks. Reference [5] found the sale of assets for smoothing consumption. Moreover, references [6,7] sur- veyed the role of cattle/livestock as a buffer for income shocks. However, farm households, due to the lack of other alternatives, are forced to protect consumption from idiosyncratic income shocks through relatively costly methods [2]. This research aims to find out the consumption smoothing strategies of maize farmers in Kebumen as a response to income shocks. The study also evaluates the effectiveness of the government policies in smoothing their consumption. The nationwide policies such as cheap rice, cash transfer and health insurance are distrib- uted aiming to protect the poor from vulnerability in consumption. These policies have been implemented for quite long time. Cheap rice, basically food price subsidy, started in 1998 followed by cash transfer and health in- surance in 2005. Thus, the research outcome of the cur- rent study is not only useful for discussion of coping strategies adopted as a response to income shocks, but also relevant to policy makers to construct an effective policy to protect farmers from vulnerability especially in Indonesia. This article consists of three main parts. The first part describes the maize production in Kebumen and the sec- ond part reviews the methodology and data utilized in this research. The last part analyzes empirical results from OLS estimation. 2. Overview of Maize Production in Kebumen According to Kebumen in Figures 2008, Kebumen ad- ministratively consists of 26 districts with a total area of 128,111.50 hectares or 1,281.1 km². Most of area is dry lands (68.96%). By 2008, the population is 1,241,437 and 52.85% of them depend mainly on agricultural ac- tivities as sources of income. Thus, they are seriously vulnerable from income shocks such as sickness, dead of family member, crop loss, bad weather, rodent and dis- aster. The local government of Kebumen in collaboration with the central government supported farmers to culti- vate maize through some incentives in order to improve farmers’ welfare and utilize the dry fallow lands. As a result of this policy, maize cultivation area sharply increased from 2,714 hectares in 2002 to 4,717 hectares in 2003. Moreover, the maize production increased from 7,537 metric ton in 2002 to 15,382 metric ton in 2003 (Figure 1). However, in 2004, many farmers did not continue to cultivate ma ize, therefore, both maize cultivation area and maize production significantly decreased. We observed that there are two main reasons why farmers stopped to cultivate maize. First, government was inconsistence in supporting farmers to cultivate maize. Second, a massive land conversion from other crops into maize had created abundant supply of maize thus the maize price dropped. Both price fall and inconsistent policy have created disin- centive for farmers to cultivate maize. Figure 1 shows that maize production fluctuated since 2003. However, following an increase in the interna- tional price of maize in 2007, farmers massively substi- tuted other crops into maize and utilized the fallow dry lands to cultivate maize. Consequently, the maize pro- duction sharply increased by 123% during the last two years. We also observed that the productivity increased almost 86% from 2.78 metric ton/hectare in 2002 to 5.17 metric ton/hectare in 2008. The highest productivity was Figure 1. Land Utilization of Maize Production and Pro- ductivity. (Source: Authors’ calculation based on Ke bumen in Figures 2004, 2005, 2006, 2008.)2 2Central Statistic Agency (BPS) Kebumen, “Kebu-men in Figures, Several Publications of 2004, 2005, 2006 and 2008,” Kebumen: Bap- eda dan BPS. http://www.bappeda.kebumenkab.go.id/data/dda_2008. df Copyright © 2010 SciRes. ME  T. DARTANTO ET AL. 151 observed in 2005 when one hectare could produce 5.29 metric tons. The main sources of the high maize produc- tivity are the use of hybrid seeds, the application of pro- duction process in an appropriate and measurable way and the learning by doing process. 3. Methodology and Data We propose an econometric model to quantitatively es- timate farmers’ consumption smoothing strategies to re- cover from income shocks. This model is based on [8- 10], in this research, we propose a two-step-calculation. First, we calculate the household consumption gap which is derived from the difference of consumption expendi- ture between those reported shocks and those in the ab- sence of shock s. ˆii h h C C i r C i (1) ˆh C is per capita consumption expenditure gap of households-h. s consumption expenditure of house- holds-h with family members-i who have reported shocks in Kebumen, h = 1, …, 220; i is number of family, i = 1, …, i; Meanwhile, i h C i r C is average consumption expenditure of poor rural households in absence of sh ocks with famil y me mbers –i in region-r, r = Kebumen and the surrounding regency in Central Java Province. We only consider the sample with negative gap for fur- ther analysis. It is assumed that the positive gap means the households are not affected by the shocks. We ob- served that those who have a positive consumption gap are categorized as non poor based on the ownership of asset and endowment indicators and the consumption expenditure. Therefore, the sample used in this research is the poor-maize-farmers in Kebumen. We utilized the different data set drawn from the 2008 National Socio-Economic Survey (SUSENAS) to proxy the rural consumption expenditure in the absence of shocks. It is because most of the surveyed respondents experienced shocks. It is justified that since the questions related to the household consumption expenditure on the surveyed questionnaire referred to the questions on SUSENAS, thus, utilizing the average rural expenditure as a proxy of consumption in the absence of shocks can create unbiased approximation. This approximation is calculated from the 7,441 samples of rural households. We made some adjustments on the surveyed data of household consumption in which the value is adjusted into the 2008 valu e by using the price index. Second, the econometric model shown by Equation 2, calculates the farmers’ strategies in order to smooth their consumption. The dependent variable is calculated from first step, while the independent variables included in this model refer to the previous researches done by [2-10]. We expect that all coefficients will be negative which means chosen strategies are effective to narrow the consumption gap. 01 2 34 5 67 89 ˆ log log hh h hh h hh hhh CLANDOTH LOANREMIT CATTLE SALELAND RASKIN TRANSFER ASKES JOB (2) where, ˆ C : absolute per capita of consumption expendi- ture gap, LAND: land ownership of household in squared meters, OTHJOB: dummy variable of side jobs; 1: having side jobs, 0: ot her wi se , LOAN: dummy variable of access to loan; 1: hav- ing access, 0: otherwise, REMIT: dummy variable of receiving remittance; 1: receiving remittance , 0 : otherwise, CATTLE: dummy variable of selling cattle; 1: sell- ing cattle, 0: otherwise, SALELAND: dummy variable of selling land; 1: selling land, 0: otherwise, RASKIN: dummy variable of receiving cheap rice; 1: receiving cheap rice, 0: otherwise, TRANSFER: dummy variable of receiving cash transfer; 1: receiving cash transfer, 0: otherwise, ASKES: dummy variable of receiving poor health insurance, 1: receiving poor health insurance, 0: otherwise, : error term i.i.d () 0E , 22 ()E , h: household-h, h = 1, …, 220. The coefficients in the model were estimated using Ordinary Least Square (OLS) by dividing samples with four sub samples based on reported shocks such crop loss (Model 1), price falls (Model 2), sickness and death (Model 3) and Customs (Model 4). Separating sample helps to show how farmers respond to each shock. However, in Model 1 and Model 2, we deliberately did not include the variables of land sale (SALELAND) and health insurance (ASKES). It is too costly for the house- holds to sell their own land as an alternative to smooth consumption from crop loss and price fall shocks. Moreover, the reason for excluding health insurance is that this policy is distributed only to the poor aiming to ease access to health services. Moreover, in Model 4, we also deliberately did not include all variable of govern- ment policies because these policies are not purposed to cope the expenditure shocks. Copyright © 2010 SciRes. ME 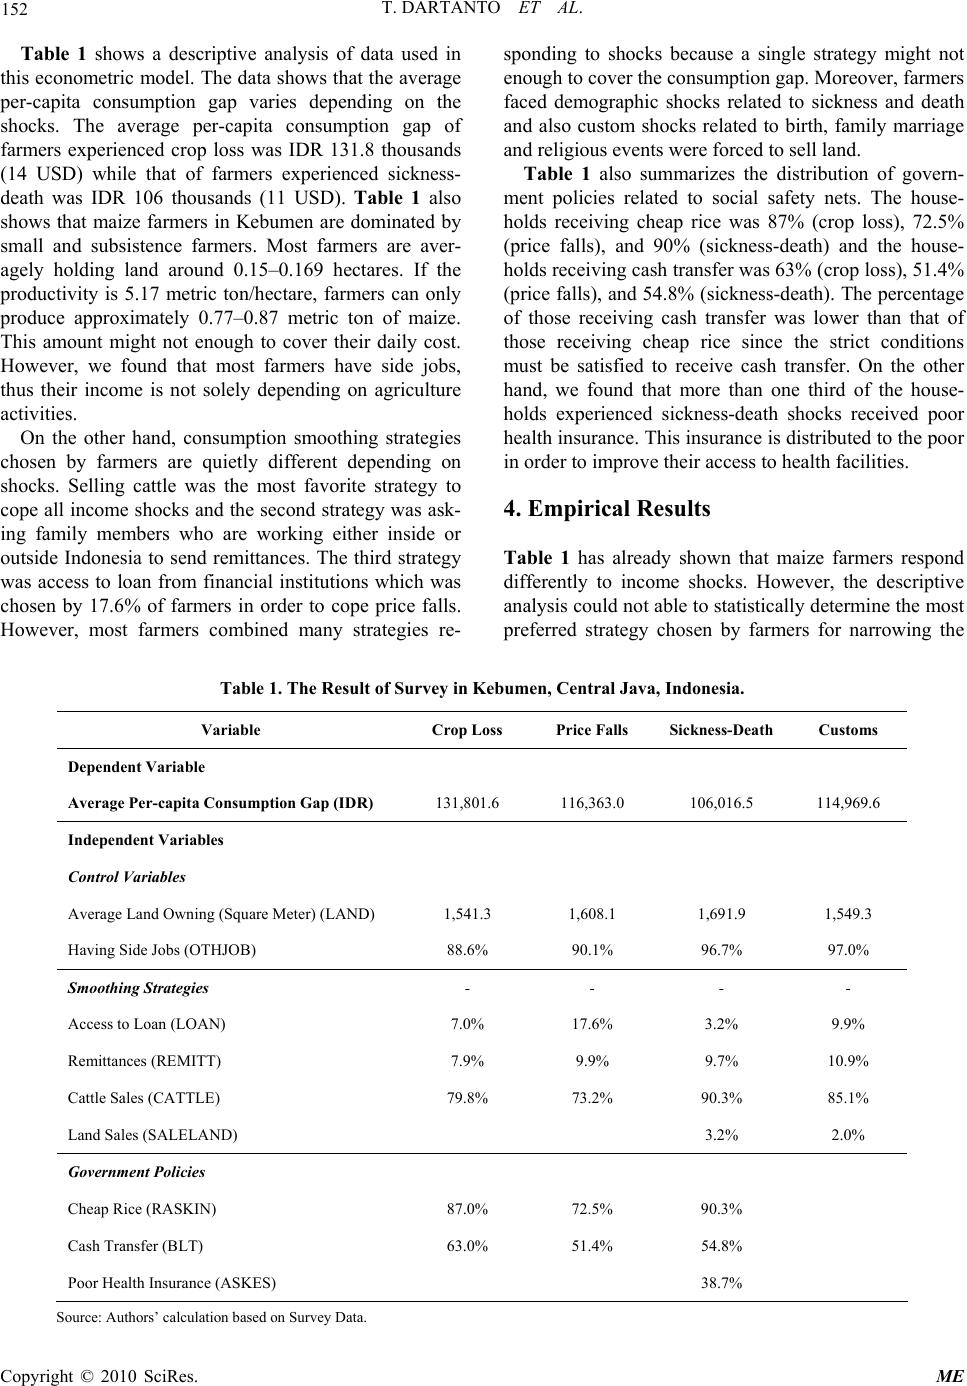 T. DARTANTO ET AL. Copyright © 2010 SciRes. ME 152 Table 1 shows a descriptive analysis of data used in this econometric model. The data shows that the average per-capita consumption gap varies depending on the shocks. The average per-capita consumption gap of farmers experienced crop loss was IDR 131.8 thousands (14 USD) while that of farmers experienced sickness- death was IDR 106 thousands (11 USD). Table 1 also shows that maize farmers in Kebumen are dominated by small and subsistence farmers. Most farmers are aver- agely holding land around 0.15–0.169 hectares. If the productivity is 5.17 metric ton/hectare, farmers can only produce approximately 0.77–0.87 metric ton of maize. This amount might not enough to cover their daily cost. However, we found that most farmers have side jobs, thus their income is not solely depending on agriculture activities. On the other hand, consumption smoothing strategies chosen by farmers are quietly different depending on shocks. Selling cattle was the most favorite strategy to cope all income shocks and the second strategy was ask- ing family members who are working either inside or outside Indonesia to send remittances. The third strategy was access to loan from financial institutions which was chosen by 17.6% of farmers in order to cope price falls. However, most farmers combined many strategies re- sponding to shocks because a single strategy might not enough to cover the consumption gap. Moreover, farmers faced demographic shocks related to sickness and death and also custom shocks related to birth, family marriage and religious events were forced to sell land. Table 1 also summarizes the distribution of govern- ment policies related to social safety nets. The house- holds receiving cheap rice was 87% (crop loss), 72.5% (price falls), and 90% (sickness-death) and the house- holds receiving cash transfer was 63% (crop loss), 51.4% (price falls), and 54.8% (sickness-death). The percentage of those receiving cash transfer was lower than that of those receiving cheap rice since the strict conditions must be satisfied to receive cash transfer. On the other hand, we found that more than one third of the house- holds experienced sickness-death shocks received poor health insurance. Th is insurance is distributed to the poor in order to improve their acce ss to health facilities. 4. Empirical Results Table 1 has already shown that maize farmers respond differently to income shocks. However, the descriptive analysis could not able to statistically determine the most referred strategy chosen by farmers for narrowing the p Table 1. The Result of Survey in Kebumen, Central Java, Indonesia. Variable Crop Loss Price Falls Sickness-Death Customs Dependent Variable Average Per-capita Consumption Gap (IDR) 131,801.6 116,363.0 106,016.5 114,969.6 Independent Variables Control Variables Average Land Owning (Square Meter) (LAND) 1,541.3 1,608.1 1,691.9 1,549.3 Having Side Jobs (OTHJOB) 88.6% 90.1% 96.7% 97.0% Smoothing Strategies - - - - Access to Loan (LOAN) 7.0% 17.6% 3.2% 9.9% Remittances (REMITT) 7.9% 9.9% 9.7% 10.9% Cattle Sales (CATTLE) 79.8% 73.2% 90.3% 85.1% Land Sales (SALELA ND) 3.2% 2.0% Government Policies Cheap Rice (RASKIN) 87.0% 72.5% 90.3% Cash Transfer ( BLT) 63.0% 51.4% 54.8% Poor Health Insurance (ASKES) 38.7% Source: Authors’ calculation based on Survey Data . 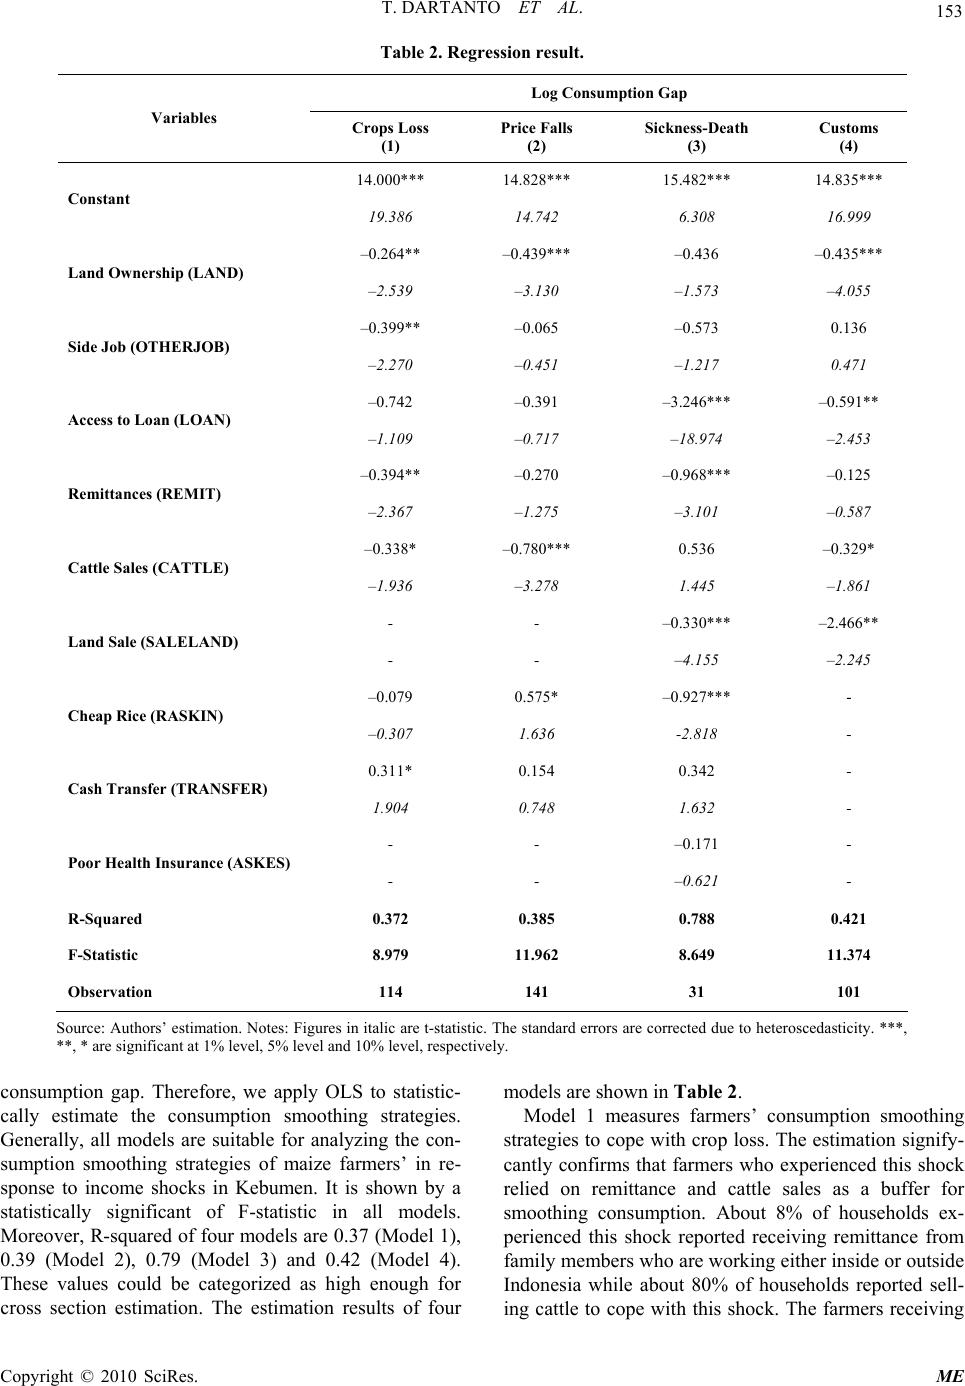 T. DARTANTO ET AL. 153 Table 2. Regression result. Log Consumption Gap Variables Crops Loss (1) Price Falls (2) Sickness-Death (3) Customs (4) 14.000*** 14.828*** 15.482*** 14.835*** Constant 19.386 14.742 6.308 16.999 –0.264** –0.439*** –0.436 –0.435*** Land Ownership (LAND) –2.539 –3.130 –1.573 –4.055 –0.399** –0.065 –0.573 0.136 Side Job (OTHERJOB) –2.270 –0.451 –1.217 0.471 –0.742 –0.391 –3.246*** –0.591** Access to Loan (LOAN) –1.109 –0.717 –18.974 –2.453 –0.394** –0.270 –0.968*** –0.125 Remittances (REMIT) –2.367 –1.275 –3.101 –0.587 –0.338* –0.780*** 0.536 –0.329* Cattle Sales (CATTLE) –1.936 –3.278 1.445 –1.861 - - –0.330*** –2.466** Land Sale (SALELAND) - - –4.155 –2.245 –0.079 0.575* –0.927*** - Cheap Rice (RASKIN) –0.307 1.636 -2.818 - 0.311* 0.154 0.342 - Cash Transfer (TRANSFER) 1.904 0.748 1.632 - - - –0.171 - Poor Health Insurance (ASKES) - - –0.621 - R-Squared 0.372 0.385 0.788 0.421 F-Statistic 8.979 11.962 8.649 11.374 Observation 114 141 31 101 Source: Authors’ estimation. Notes: Figures in italic are t-statistic. The standard errors are corrected due to heteroscedasticity. ***, **, * are significant at 1% level, 5% level and 10% level, respectively. consumption gap. Therefore, we apply OLS to statistic- cally estimate the consumption smoothing strategies. Generally, all models are suitable for analyzing the con- sumption smoothing strategies of maize farmers’ in re- sponse to income shocks in Kebumen. It is shown by a statistically significant of F-statistic in all models. Moreover, R-squared of four models are 0.37 (Model 1), 0.39 (Model 2), 0.79 (Model 3) and 0.42 (Model 4). These values could be categorized as high enough for cross section estimation. The estimation results of four models are shown in Table 2. Model 1 measures farmers’ consumption smoothing strategies to cope with cro p loss. The estimation sign ify- cantly confirms that farmers who experienced this shock relied on remittance and cattle sales as a buffer for smoothing consumption. About 8% of households ex- perienced this shock reported receiving remittance from family members who are working either inside or outside Indonesia while about 80% of households reported sell- ing cattle to cope with this shock. The farmers receiving Copyright © 2010 SciRes. ME  154 T. DARTANTO ET AL. remittance were able to narrow their consumption gap by 0.394 while those selling cattle narrowed their co nsump- tion gap by 0. 3343. Model 2 evaluates farmers’ consumption smoothing strategies in coping price falls. The OLS regression con- firms that selling cattle played a central role to cope with price falls by narrowing consumption gap up to 0.78. Approximately 73% of househ olds reported selling cattle to deal with this shock. Moreover, selling cattle might be enough to cover the gap because price falls affects consumption smaller than crop loss. The degree of impact is different since farmers suffering from price falls are still able to harvest crops meanwhile those suf- fering from crop loss are not. This estimation also showed that households may not need to utilize either remittance or loan as an alternative to smooth consump- tion. In similar with Model 1, land ownership signify- cantly reduced the consumption gap. Moreover, neither Model 1 nor Model 2 showed access to loan as an alter- native to cope this sho ck. The difference between Model 1 and Model 2 was the ineffectiveness of side jobs and remittance in narrowing the consumption gap shown in the second model. Model 3 analyzed farmers’ consumption strategies to deal with demographic shocks related to sickness and death. The death of a productive family member reduces income as well as consumption due to loss of labor input in agricultural activities or selling labor to othe r activities. Since the health insurance system in Indonesia is unde- veloped yet, sickness is closely related to an unexpected expenditure withdrawing a larger share of household income. Therefore, farmers respond to death and sick- ness quiet differently from our previous models. Selling cattle, land ownership and side jobs which previously play a central role, are replaced by access to loans, re- mittance and selling land . The reason is that selling cattle might not be sufficient to cover the gap due to a larger reduction of i n come. The coefficients of Model 3 indicate the condition where access to loan is the first alternative chosen, while remittance and selling land is the next alternatives. Under these alternatives, the consumption gap narrows by 3.25, 0.97 and 0.33, respectively. This confirms that selling land is a costly option selected only when other alterna- tives are not feasible. Surprisingly, even though the magnitude of both land ownership and side jobs in nar- rowing the consumption gap is consistent with Model 1 and Model 2, neither land ownership nor side jobs is sig- nificant. The main reason is that those reported for these shocks were only 31 samples, thus the standard error (SE) would be high due to large variance. In contrast to Model 1 and Model 2, government policies seem to be effective, which is shown by negative coefficients of both cheap rice (RASKIN) and poor health insurance (ASKES), in assisting maize farmers to cope with the demographic shocks associated with sickness and death. Unfortunately, the negative coefficient of ASKES is not statistically significant in narrowing the gap. Lastly, Model 4 investigates the farmers’ consumption strategies in coping to expenditure sho cks related to cus- tom such as birth, marriage, culture and religious even such circumcision. As well as the demographic shocks, these shocks take account a quite large share of income. However, the managing strategies are different from Model 3. The farmers choose to selling land, making loan and selling cattle in priority. The coefficients of Model 4 indicate the condition where selling land is the first alternative chosen, while access to loan and selling cattle are the next alternatives. Under these alternatives, the consumption gap narrowed by 2.47, 0.59 and 0.33, respectively. This confirms that custom shocks need a large source to finance the gap. Thus, the selling land becomes the first alternative. However, farmer experi- enced selling land might have a serious future cones- quence since all models show that farmers holding large land size are relatively resilient to any type of income shocks. Moreover, in contrast to Model 3, remittance is statistically insignificant to narrow the consumption gap in this model. 5. Concluding Remark Farmers respond differently to income shocks depending on their ownership of assets, access to loan, family as- sistance such as remittance and the typ e of shocks. In the case of maize farmers in Kebumen, consumption smoothing strategies vary in accordance to the type of shocks and the magnitude of their impact on household income as well as consumption. If a shock for example price falls, has only a little impact on income, farmers choose to sell cattle to protect their consumption. In ad- dition, during other shocks with greater impact than price fall, such as crop loss, farmers not only sell their cattle but also need remittance as an additional coping strategy. An opposite smoothing strategy from previous strategies is chosen when an income shock occurs due to sickness and death. Farmers who experienced this type of shocks face difficult choices to protect their consumption. In the worst case, they are forced to sell their land even though it is costly. However, widening access to loan market enables them to easily protect their consumption. Unfor- tunately, a consistent statistical evidence in all models does not exist to support the hypothesis that government policies such cheap rice, cash transfer and poor health insurance are effective as an instrument of consumption 3The consumption gap m ea ns t he l og arithm consumption gap. Copyright © 2010 SciRes. ME  T. DARTANTO ET AL. Copyright © 2010 SciRes. ME 155 smoothing policy. Like many previous research findings, this research also confirms that maize farmer households holding large land size are relatively resilient to any type of income shocks. 6. Acknowledgements We would like to thank University of Indonesia for funding this research through the National Research Strategic Fund 2009. We also thank Mrs. Lily Yunita (University of Indonesia), Mr. Yoshua Wisnungkara and Mr. Mark Rebuck (Nag oya University) for their valuab le comments. Any remaining errors are our responsibility. 7. References [1] BPS-BAPENAS-UNDP, “National Human Development Report 2004, the Economics of Democracy: Financing Human Development in Indonesia,” Jakarta: BPS, 2004. http://www.undp.or.id/pubs/ihdr2004/ihdr2004_full.pdf [2] K. Kochar, “Explaining Household Vulnerability to Idio- syncratic Income Shocks,” The American Economic Re- view, Vol. 85, No. 2, 1995, pp. 159-164. [3] M. Eswaran and A. Kotwal, “Credit as Insurance in Agrarian Economies,” Journal of Development Econom- ics, Vol. 31, No. 1, 1989, pp. 37-53. [4] M. R. Rosenzweig, and K. Wolpin, “Credit Market Con- straints, Consumption Smoothing, and the Accumulation Of Durable Production Assets In Low-Income Countries: Investments In Bullocks In India,” The Journal of Politi- cal Economy, Vol. 101, No. 2, 1993, pp. 223-224. [5] J. Morduch, “Income Smoothing and Consumption Smoothing,” Journal of Economics Perspectives, Vol. 9, No. 3, 1995, pp. 103-114. [6] H. Kazianga and C. Udry, “Consumption Smoothing, Insurance and Drought in Burkina Faso,” Journal of De- velopment Economics, Vol. 79, No. 2, 2006, pp. 413- 446. [7] J. McPeak, “Contrasting Income Shocks with Asset Shocks: Sales in Northern Kenya,” Oxford Economic Papers, Vol. 56, No. 2, 2004, pp. 263-284. [8] M. R. Rosenzweig, “Risk, Implicit Contracts and Family in Rural Areas Of Low-Income Countries,” The Eco- nomic Journal, Vol. 98, No. 393, 1988, pp. 1148-1470. [9] A. Kochar, “Smoothing Consumption by Smoothing Income: Hours of Work Responses to Idiosyncratic Ag- ricultural Shocks in Rural India,” The Review of Eco- nomics and Statistics, Vol. 81, No. 1, 1999, pp. 50-61. [10] G. Berloffa and F. Modena, “Income Shocks, Coping Strategies and Consumption Smoothing: An Application to Indonesian Data,” Discussion Paper No.1-2009, Uni- versita degli Studi di Trento, Dipartimento di Economica, Italy.
|