Paper Menu >>
Journal Menu >>
 Wireless Sensor Network, 2010, 2, 828-837 doi:10.4236/wsn.2010.211100 Published Online November 2010 (http://www.SciRP.org/journal/wsn) Copyright © 2010 SciRes. WSN 3-D Grid-Based Localization Technique in Mobile Sensor Networks Jia Li1, Lei Sun1, Wai Yee Leong2, Peter H J Chong1 1School of Electrical and Electronic Engineering, Nanyang Technological University, Singapore 2Singapore Institute of Manu facturing Technology, 71 Nanyang Drive, Singapo re E-mail: ehjchong@ntu.edu.sg Received August 10, 2010; revised September 21, 2010; accepted October 25, 2010 Abstract Considering the environmental protection, forest fire becomes a more and more serious problem and requires more concerns. This paper provides an efficient method for fire monitoring and detection in forests using wireless sensor network technology. The proposed technique estimates the location of a sensor node based on the current set of hop-count values, which are collected through the anchor nodes’ broadcast. Our algo- rithm incorporates two salient features; grid-based output and event-triggering mechanism, to improve the accuracy while reducing the power consumption. Through the computer simulation, the output region ob- tained from our algorithm can always cover the target node. In addition, the algorithm was implemented and tested with a set of Crossbow sensors. Experimental results demonstrated the high feasibility and worked well in real environment. Keywords: Wireless Mobile Sensor Networks, Forest Fire Detection, Localization Technique 1. Introduction Wireless Sensor Networks (WSNs) provide unprece- dented opportunities for monitoring areas of interests such as chemical factory, homes and offices, with low- cost, low-power and multi-functional sensors. As such, WSNs attract considerable amount of attention from re- searchers all over the world. Usually one should use a large number of sensor nodes to deploy a WSN because these sensors generally are small in size and can only communicate within short distances. Information can be collected from a WSN node through the base station. However, the collected information would be meaningless if we could not determine the location of a WSN node. Consequently, fast, efficient and low-cost localization techniques are highly desirable for WSNs applications. The key idea of WSN localization is to allow some sensor nodes to know their own location at all time. Such nodes, usually called anchors, may be equipped with Global Positioning System (GPS) or be fixed ly placed at pre-determined positions with known coordinates. For the sake of low cost, most sensor nodes do not know their locations. These nodes with unknown location in- formation are called non-anchor nodes. Interestingly, their locations can be estimated by applying WSN local- ization techniques [1]. Localization techniques in WSNs are classified into two groups: range-based and range-free techniques. Ran- ge-based techniques use sophisticated hardware to con- duct complex measurements on distance or angle of sig- nal arrival to obtain location estimates. Typical range -based localization schemes includes those using re- ceived signal strength (RSS) [2], time of arrival (TOA) [3], angle of arrival (AOA) [4], and time difference of arrival (TDOA) [5]. Noteworthily, range-based localiza- tion techniques are applicable only when the non-anchor node of interest is within communication range of the anchor nodes. Due to the expensive hardware require- ment, range-based techniques are generally considered as high-cost solutions. Consequently, this shortcoming un- fortunately hinders them from being applied for forest fire surveillance, which is normally formed by millions of sensor nodes. Range-free algorithms estimate the location of a sen- sor only based on the connectivity between non-anchor nodes and anchors. Three typical existing range-free techniques are the DV-hop [6], Monte-Carlo Localiza- tion (MCL) [7] and Monte-Carlo Box (MCB) [8] algo- rithms. The general principle of these techniques is that localization can be estimated from the proximity con- straints, which are defined by a sensor node of interest  J. LI ET AL. Copyright © 2010 SciRes. WSN 829 being in the transmission ranges of other sensor nodes. For the authors’ best knowledge, none of aforementioned localization techniques is exclusively designed forest fire surveillance. Consequently, when the existing localiza- tion techniques were applied in forest fire surveillance systems, they would inevitably result in certain disad- vantages such as high complexity, low efficiency and large power co nsumption. This paper aims to contribute a novel localization technique for forest fire surveillance by monitoring and tracking groups of an imals using WSN technology. The proposed technique based on the existing range-free techniques and improves the accuracy. In brief, we pro- pose to attach sensor nodes to selected animals. When- ever the temperature sensed at these animals’ proximity rises beyond a predefined threshold, the localization module in the sensor would be activated and the sub- jects’ motion paths are analyzed. The region of forest fire is estimated based on two indicators: (1) a group of animals are observed to run away from a certain area, and (2) the temperature sensed around the animals’ sur- rounding environment is higher than a predefined thre- shold. The rest of this paper is organized as follows. Section 2 revisits the related localization algorithms and Section 3 presents our proposed localization algorithm. In Sec- tion 4, the simulation results are discussed, which are followed by the experimental results in Section 5. Finally, Section 6 concludes the paper. 2. Related Works Our proposed localization technique is range-free, which adopts similar assumptions as the existing three algo- rithms. In the following, we shall revisit the three exist- ing range-free localization techniques in order to lay the foundation for the presentation of our proposed localiza- tion technique. 2.1. DV-Hop Technique DV-hop technique [6] uses a mechanism that similar to the classical distance vector routing. The algorithm’s implementation is comprised of three steps. First, each anchor broadcasts an announcement message to be flooded throughout the network, which contains the an- chors ID, location and a hop-count parameter initialized to 0. Each receiving node equip ped with a counter main- tains the minimum counter value of hops from itself to every anchor. When the announcement message received at a node, it will update hop-count and ignore the higher hop-count value received before, then forward the broadcast message to their neighbor nodes. Through this me ch a ni s m, every node in the network can get the shortest distance, hop-count value. In the second step, it estimates an av- erage single hop distance, which is then broadcasted as a correction to the entire network. Finally, the unknown nodes compute their locations by multiplying the hop- count values with average hop distance. In the end of this step, once a node can calculate the distance to more than 3 anchors, it can use centroid formula to estimate its lo- cation notified with point. DV-Hop is defined as point- based localization method because the output of localiza- tion is a point. This technique can produce a relatively high accuracy in netwo rks where sen sor nodes ar e even ly distributed and the objects to be tracked are static. 2. 2 . MCL Technique The Monte Carlo Localization (MCL) [7] is the first technique exclusively developed to track mobile sensor nodes. The algorithm calculates a set Lt of N location samples, each of which represents a possible location of the node to be tracked at time t. Initially, at t = 0, MCL assumes that the node has no knowledge about its posi- tion; hence the first sample set L0 consists of N random samples which are selected within the deployment area. At each time step, the set {} i t lis updated based on possi- ble movement of the node and new observations on the node’s connectivity to the anchor nodes. This process can be divided int o two p hases: 1) Prediction: In this phase, the node uses its previous location and maximum velocity, vmax to predict its possi- ble new location. For example, if the node was at loca- tion 1 i t l at time t – 1, its current location i t l should be within a circle with radius dmax from 1 i t l, where dmax is the maximum distance that a mobile node can move within each time interval. Hence, from the old sample 1 i t l the algorithm randomly selects a new sample i t lwithin the circle centered at 1 i t l with radius dmax. By this way, from the previous sample set 11 {} i tt Ll , a new sample set {} i tt Ll can be predicted. 2) Filtering: In this phase, the node can eliminate some predicted samples obtained from the prediction phase based the connectivity between the node and the anchors which set up some space constrain to the node location. For example, if node M can hear an anchor A, its location must be within a distance r from A, where r is the radio range of the node/anchor. All location samples which fall out of this area ought to be eliminated. Con- sequently, the number of valid samples may drop below N due to elimination, hence re-sampling (repeating the prediction and filtering phase) is used to maintain N lo- cation samples at each time step. Finally, the estimated location of the node at time t is the average of all N sample values in the sample set Lt. 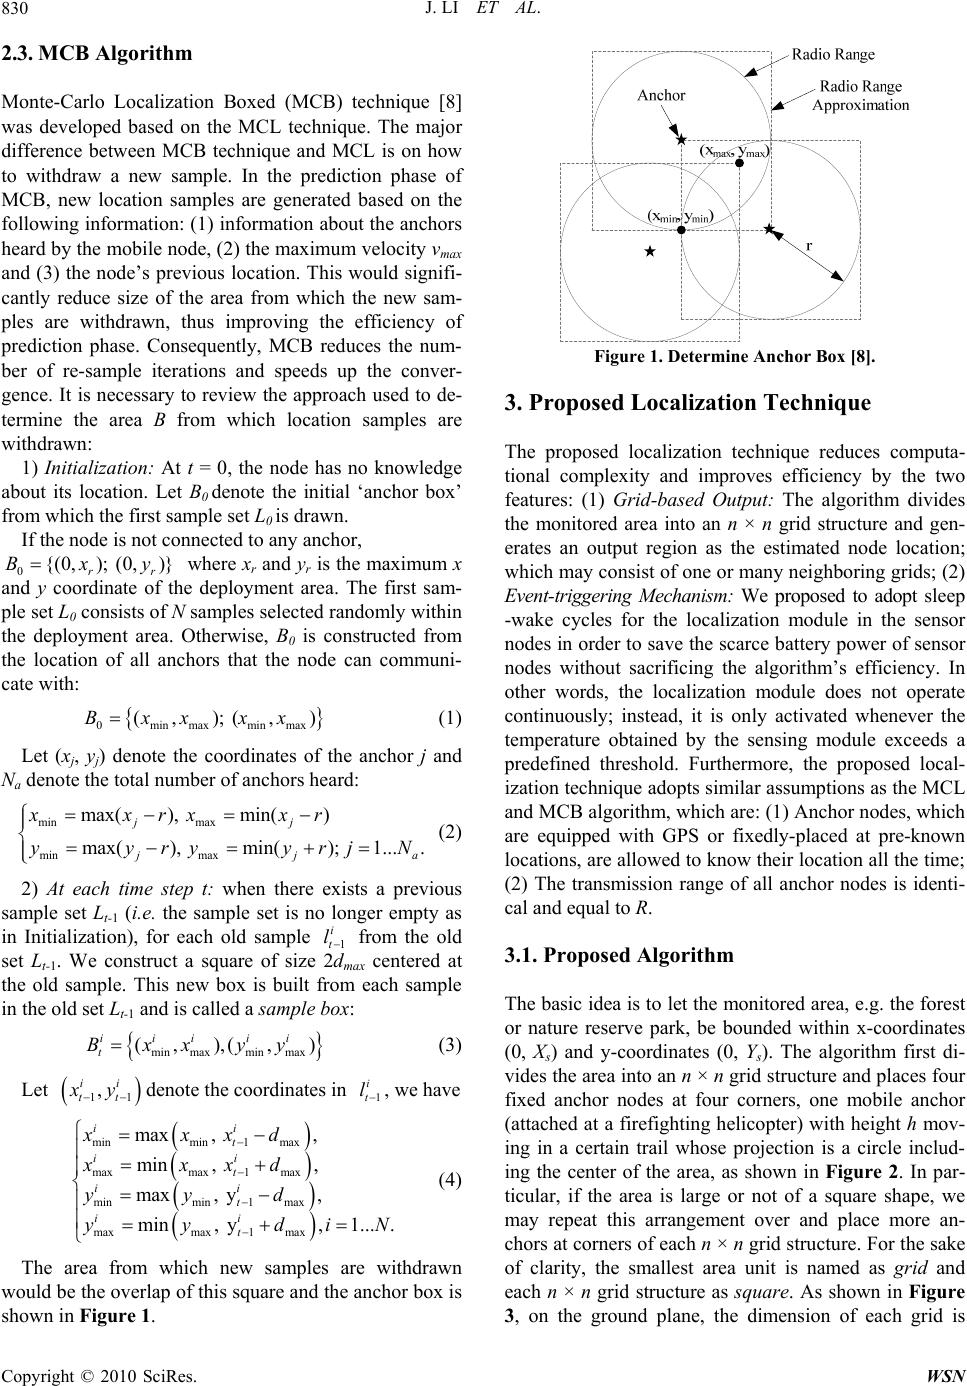 J. LI ET AL. Copyright © 2010 SciRes. WSN 830 2.3. MCB Algorithm Monte-Carlo Localization Boxed (MCB) technique [8] was developed based on the MCL technique. The major difference between MCB technique and MCL is on how to withdraw a new sample. In the prediction phase of MCB, new location samples are generated based on the following information: (1 ) information about the anchors heard by the mobile nod e, (2) the maximum velocity vmax and (3) the node’s previous location. This would signifi- cantly reduce size of the area from which the new sam- ples are withdrawn, thus improving the efficiency of prediction phase. Consequently, MCB reduces the num- ber of re-sample iterations and speeds up the conver- gence. It is necessary to review the approach used to de- termine the area B from which location samples are withdrawn: 1) Initialization: At t = 0, the node has no knowledge about its location. Let B0 denote the initial ‘anchor box’ from which the first sample set L0 is drawn. If the node is not connected to any anchor, 0{(0,); (0,)} rr Bxy where xr and yr is the maximu m x and y coordinate of the deployment area. The first sam- ple set L0 consists of N samples selected randomly within the deployment area. Otherwise, B0 is constructed from the location of all anchors that the node can communi- cate with: 0minmaxminmax (,); (,)Bxx xx (1) Let (xj, yj) denote the coordinates of the anchor j and Na denote the total number of anchors heard: min max min max max(), min() max(), min(); 1.... jj j ja xxrxxr yyryyrjN (2) 2) At each time step t: when there exists a previous sample set Lt-1 (i.e. the sample set is no longer empty as in Initialization), for each old sample 1 i t l from the old set Lt-1. We construct a square of size 2dmax centered at the old sample. This new box is built from each sample in the old set Lt-1 and is called a sample box: min maxminmax (, ),(,) iii ii t Bxxyy (3) Let 11 , ii tt x y denote the coordinates in 1 i t l, we have minmin1 max maxmax1 max minmin1 max maxmax1 max max, , min, , max, y, min, y,1.... ii t ii t ii t ii t xxxd xxxd yyd yydiN (4) The area from which new samples are withdrawn would be the overlap of this square and the anchor box is shown in Figure 1. Figure 1. Determine Anchor Box [8]. 3. Proposed Localization Technique The proposed localization technique reduces computa- tional complexity and improves efficiency by the two features: (1) Grid-based Output: The algorithm divides the monitored area into an n × n grid structure and gen- erates an output region as the estimated node location; which may consist of one or many neighboring grids; (2) Event-triggering Mechanism: We proposed to adopt sleep -wake cycles for the localization module in the sensor nodes in order to save the scarce battery power of sensor nodes without sacrificing the algorithm’s efficiency. In other words, the localization module does not operate continuously; instead, it is only activated whenever the temperature obtained by the sensing module exceeds a predefined threshold. Furthermore, the proposed local- ization technique adopts similar assumptions as the MCL and MCB algorithm, which are: (1 ) Anch or nodes, which are equipped with GPS or fixedly-placed at pre-known locations, are allowed to know their location all the time; (2) The transmission range of all anchor nodes is identi- cal and equal to R. 3.1. Proposed Algorithm The basic idea is to let the monitored area, e.g. the forest or nature reserve park, be bounded within x-coordinates (0, Xs) and y-coordinates (0, Ys). The algorithm first di- vide s the area into an n × n grid structure and places four fixed anchor nodes at four corners, one mobile anchor (attached at a firefighting helicopter) with height h mov- ing in a certain trail whose projection is a circle includ- ing the center of the area, as shown in Figure 2. In par- ticular, if the area is large or not of a square shape, we may repeat this arrangement over and place more an- chors at corners of each n × n grid structure. For the sake of clarity, the smallest area unit is named as grid and each n × n grid structure as square. As shown in Figure 3, on the ground plane, the dimension of each grid is  J. LI ET AL. Copyright © 2010 SciRes. WSN 831 Anchor 1 Anchor 2 Anchor 3 Anchor 4 Anchor 5 h Figure 2. A square consists of four fixed anchors and one mobile anchor. Figure 3. A square consisting of 16 grids in a 4 × 4 structure. r × r, where r = R×cos45°. Similar to the DV-hop technique, our algorithm re- quires a set of distance information from a sensor node to each anchor node. Whenever the temperature sensed at a sensor node rises above a predefined threshold, the node would send a packet containing the set of hop-counts to the base station, which will be the inputs of the algorithm. The current set of hop-counts is 12 , ,..., a cccc N Hhhhwhere c j h is current number of hop s from the sensor node to anchor node j, and Na is the number of anchor nodes. The output of our algorithm is the estimated rectangular region-based location Best of node M expressed in terms of left-bottom and right-top vertices’ coordinates (xmin, ymin) and (xmax, ymax). The tentative nod e location is determined based on Hc. For example, consider Na=5 and 12345 = ,,,, C ccccc H hhhhh, for each values c j h in Hc, it is implied that the distance between the corresponding an- chor and the node to be sensed is (1), cc jj dh RhR . The algorithm estimates the location of sensor node M as follows: The algorithm determines the region c j B which is the c j h-hop coverage area of anchor Aj with coordinates (XAj, YAj), and c j B is a square with side lengthc j hr. The up- per-bound and lower-bound for x and y coordinates of c j Bare: ,min ,max ,min ,max max{0, } min{, } max{0, } min{, } j j j j cc jAj cc j rA j cc jAj cc jrAj xXrh x XX rh yYrh yYYrh (5) For the mobile anchor above the area, only its projec- tion is focus, and th e trail will be a square shaped instead of circle in order to simplify the process. The hop count is also obtained based on its projection. The 3-D to 2-D conversion is accomplished as shown in Figure 4. Next, the algorithm finds the overlap of all regions, i.e., c j B, where j is 1, 2, …, Na. Then, 12 a ccc c N BBB B (6) The region Bc would be the tentative estimated grid -based location of sensor node M. The upper-bound and lower-bound for x and y coordinates of this rectangular region are: min1,min 2,min,min max1,max 2,max,max min1,min 2,min,min max1,max 2,max,max max{ ,,...,} min{ ,,...,} max{ ,,...,} min{ ,,...,} a a a a cccc N cccc N cccc N cccc N Xxxx Xxxx Yyyy Yyyy (7) As shown in Figure 5, Bc could be either a single grid, e.g., for input Hc = {3, 3, 2, 3, 2} in Figure 5(a) or larger grid, e.g., for Hc = {2, 0, 0, 0, 3} in Figure 5( b ). If the resulted Bc is null, the algorithm will return the entire monitored area as an output, i.e., min max min max 12 0, 0, a cc r cc r ccc c N XXX YYY BBB B (8) Figure 4. 2-D model with 4 fixed anchors and 1 mobile an- chor. Figure 5. Estimated region for node M for (a) Hc = [3,3,2,3,2]; (b) Hc = [2,0,0,0,3]. Ancho r 1 Ancho r 2Ancho r 3 Ancho r 4 Anchor 5 Anchor 1 Anchor 2Anchor 3 Anchor 4 Anchor 5 Anchor 1 Anchor 2 Anchor 3 Anchor 4 Anchor 5 (a) (b) 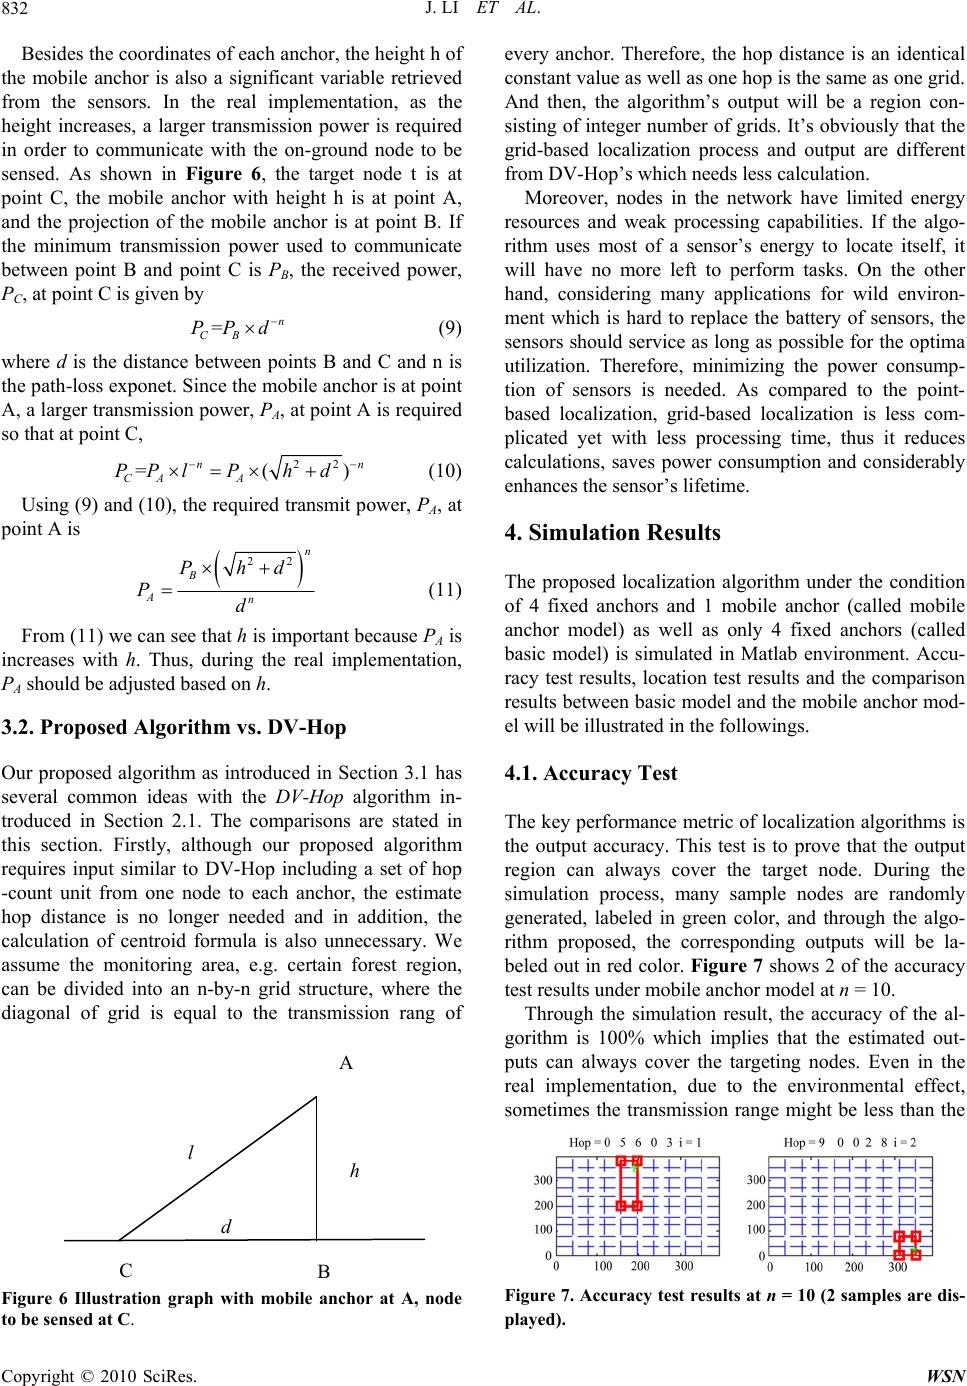 J. LI ET AL. Copyright © 2010 SciRes. WSN 832 Besides the coordinates of each anchor, the height h of the mobile anchor is also a significant variable retrieved from the sensors. In the real implementation, as the height increases, a larger transmission power is required in order to communicate with the on-ground node to be sensed. As shown in Figure 6, the target node t is at point C, the mobile anchor with height h is at point A, and the projection of the mobile anchor is at point B. If the minimum transmission power used to communicate between point B and point C is PB, the received power, PC, at point C is given by =n CB PP d (9) where d is the distance between points B and C and n is the path-loss exponet. Since the mobile anchor is at point A, a larger transmission power, PA, at point A is required so that at point C, 22 =() nn CA A PP lPhd (10) Using (9) and (10), the required transmit power, PA, at point A is 22 n B An Phd Pd (11) From (11) we can see that h is important because PA is increases with h. Thus, during the real implementation, PA should be adjusted based on h. 3.2. Proposed Algorithm vs. DV-Hop Our proposed algorithm as introduced in Section 3.1 has several common ideas with the DV-Hop algorithm in- troduced in Section 2.1. The comparisons are stated in this section. Firstly, although our proposed algorithm requires input similar to DV-Hop including a set of hop -count unit from one node to each anchor, the estimate hop distance is no longer needed and in addition, the calculation of centroid formula is also unnecessary. We assume the monitoring area, e.g. certain forest region, can be divided into an n-by-n grid structure, where the diagonal of grid is equal to the transmission rang of Figure 6 Illustration graph with mobile anchor at A, node to be sensed at C. every anchor. Therefore, the hop distance is an identical constant value as well as one h op is the same as on e grid. And then, the algorithm’s output will be a region con- sisting of integer number of grids. It’s obviously that the grid-based localization process and output are different from DV-Hop’s which needs less calculation. Moreover, nodes in the network have limited energy resources and weak processing capabilities. If the algo- rithm uses most of a sensor’s energy to locate itself, it will have no more left to perform tasks. On the other hand, considering many applications for wild environ- ment which is hard to replace the battery of sensors, the sensors should service as long as possible for the optima utilization. Therefore, minimizing the power consump- tion of sensors is needed. As compared to the point- based localization, grid-based localization is less com- plicated yet with less processing time, thus it reduces calculations, saves power consumption and considerably enhances the sensor’s lifetime. 4. Simulation Results The proposed localization algorithm under the condition of 4 fixed anchors and 1 mobile anchor (called mobile anchor model) as well as only 4 fixed anchors (called basic model) is simulated in Matlab environment. Accu- racy test results, location test results and the comparison results between basic model and the mobile anchor mod- el will be illustrated in the followings. 4.1. Accuracy Test The key performance metric of localization algorithms is the output accuracy. This test is to prove that the output region can always cover the target node. During the simulation process, many sample nodes are randomly generated, labeled in green color, and through the algo- rithm proposed, the corresponding outputs will be la- beled out in red co lor. Figure 7 shows 2 of the accuracy test results under mobile anchor model at n = 10. Through the simulation result, the accuracy of the al- gorithm is 100% which implies that the estimated out- puts can always cover the targeting nodes. Even in the real implementation, due to the environmental effect, sometimes the transmission range might be less than the Figure 7. Accuracy test results at n = 10 (2 samples are dis- played). A C h d l B 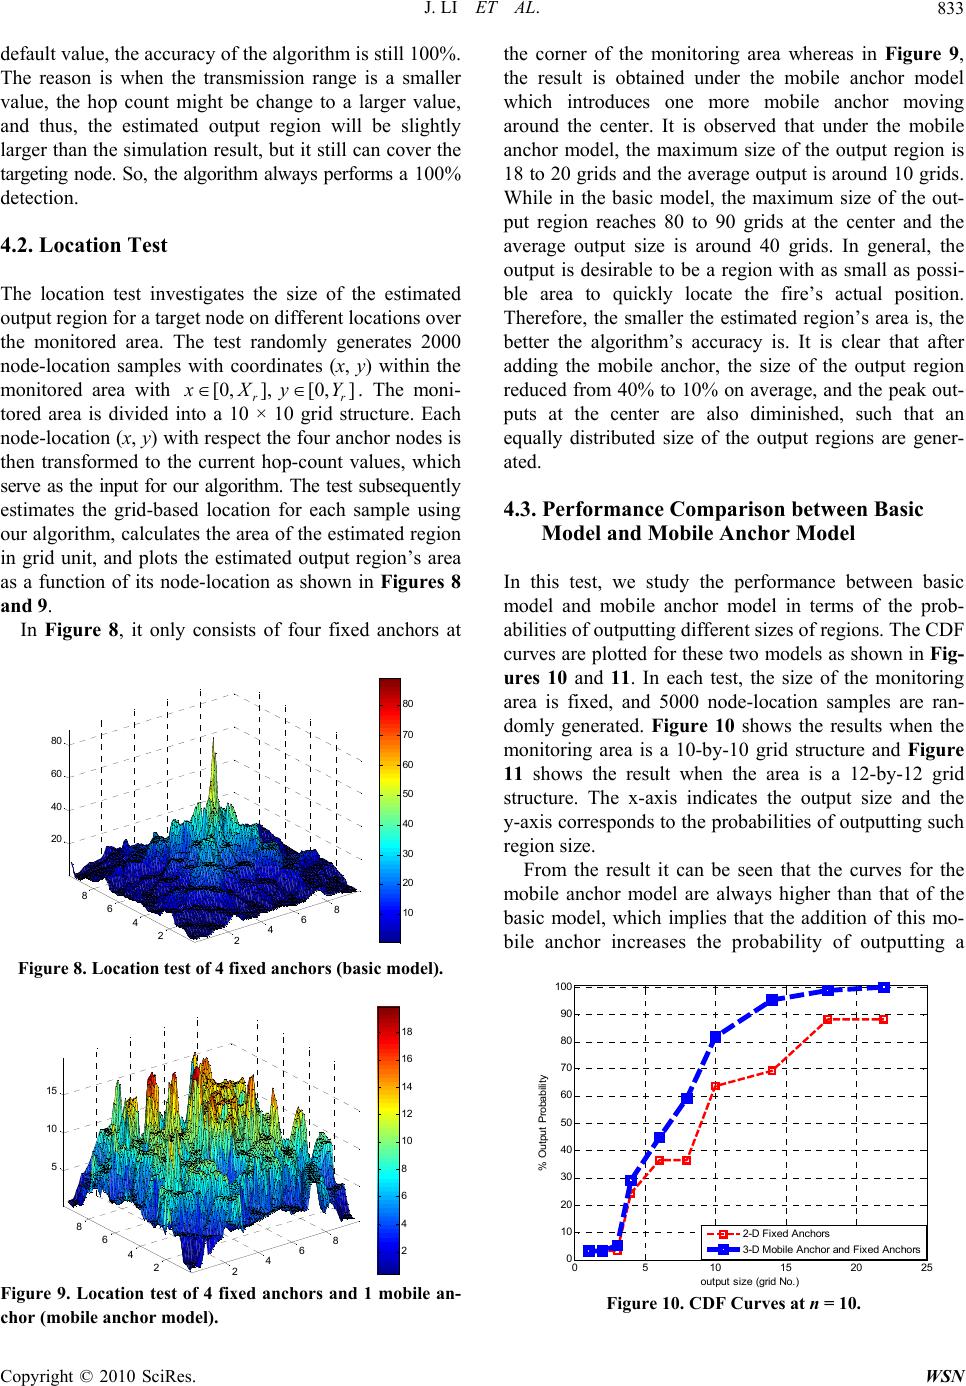 J. LI ET AL. Copyright © 2010 SciRes. WSN 833 default value, the accuracy of the algorithm is still 100%. The reason is when the transmission range is a smaller value, the hop count might be change to a larger value, and thus, the estimated output region will be slightly larger than the simulation resu lt, but it still can cover the targeting node. So, the algorithm always performs a 100% detection. 4.2. Location Test The location test investigates the size of the estimated output region for a target node on different locations over the monitored area. The test randomly generates 2000 node-location samples with coordinates (x, y) within the monitored area with [0,], [0,] rr x Xy Y. The moni- tored area is divided into a 10 × 10 grid structure. Each node-location (x, y) with respect the four anchor nodes is then transformed to the current hop-count values, which serve as the input for our algorithm. The test subsequently estimates the grid-based location for each sample using our algorithm, calculates the area of the estimated region in grid unit, and plots the estimated output region’s area as a function of its node-location as shown in Figures 8 and 9. In Figure 8, it only consists of four fixed anchors at 2468 2 4 6 8 20 40 60 80 10 20 30 40 50 60 70 80 Figure 8. Location test of 4 fixed anchors (basic model). 2468 2 4 6 8 5 10 15 2 4 6 8 10 12 14 16 18 Figure 9. Location test of 4 fixed anchors and 1 mobile an- chor (mobile anchor model). the corner of the monitoring area whereas in Figure 9, the result is obtained under the mobile anchor model which introduces one more mobile anchor moving around the center. It is observed that under the mobile anchor model, the maximum size of the output region is 18 to 20 grids and the average output is around 10 grids. While in the basic model, the maximum size of the out- put region reaches 80 to 90 grids at the center and the average output size is around 40 grids. In general, the output is desirable to be a region with as small as possi- ble area to quickly locate the fire’s actual position. Therefore, the smaller the estimated region’s area is, the better the algorithm’s accuracy is. It is clear that after adding the mobile anchor, the size of the output region reduced fro m 40 % to 10% on average, and the peak out- puts at the center are also diminished, such that an equally distributed size of the output regions are gener- ated. 4.3. Performance Comparison between Basic Model and Mobile Anchor Model In this test, we study the performance between basic model and mobile anchor model in terms of the prob- abilities of outputting different sizes of regions. The CDF curves are plotted for these two models as shown in Fig- ures 10 and 11. In each test, the size of the monitoring area is fixed, and 5000 node-location samples are ran- domly generated. Figure 10 shows the results when the monitoring area is a 10-by-10 grid structure and Figure 11 shows the result when the area is a 12-by-12 grid structure. The x-axis indicates the output size and the y-axis corresponds to the probabilities of outp utting such region size. From the result it can be seen that the curves for the mobile anchor model are always higher than that of the basic model, which implies that the addition of this mo- bile anchor increases the probability of outputting a 05 10 15 20 25 0 10 20 30 40 50 60 70 80 90 100 % Output P robability out put size (g ri d No.) 2-D Fixed Anc hors 3-D Mobi le A nch or and F ixed A n chors Figure 10. CDF Curves at n = 10. 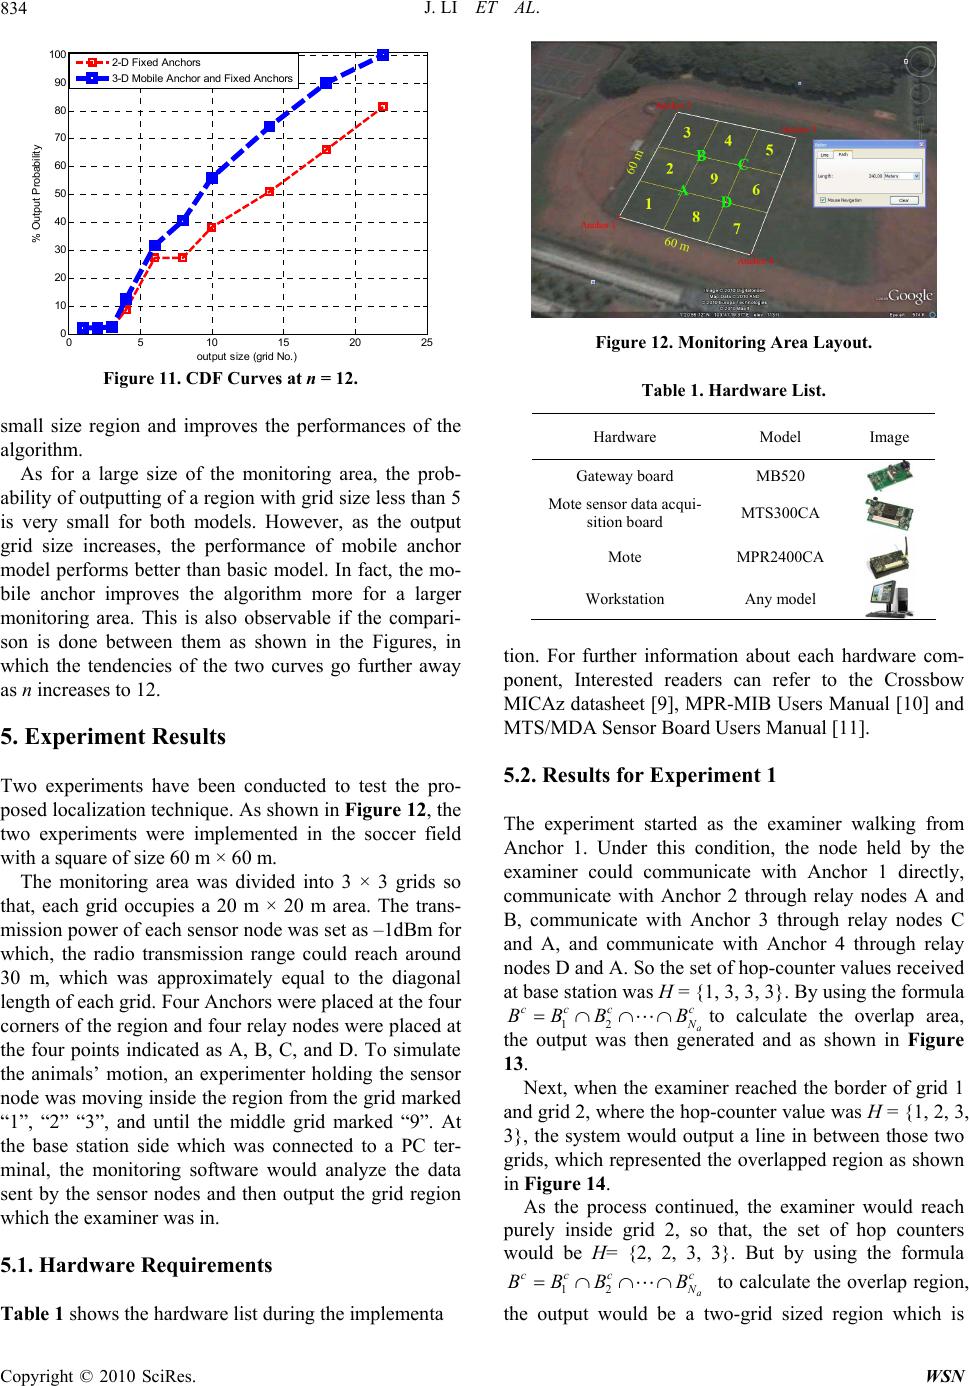 J. LI ET AL. Copyright © 2010 SciRes. WSN 834 05 10 1520 25 0 10 20 30 40 50 60 70 80 90 100 % O utput Probabi li ty out put si z e (gri d No. ) 2-D Fixed A nchors 3-D Mobil e A nchor and F i xed A nchors Figure 11. CDF Curves at n = 12. small size region and improves the performances of the algorithm. As for a large size of the monitoring area, the prob- ability of ou tputting o f a region with grid size less than 5 is very small for both models. However, as the output grid size increases, the performance of mobile anchor model performs better than basic model. In fact, the mo- bile anchor improves the algorithm more for a larger monitoring area. This is also observable if the compari- son is done between them as shown in the Figures, in which the tendencies of the two curves go further away as n increases to 12. 5. Experiment Results Two experiments have been conducted to test the pro- posed localization technique. As shown in Figure 12, the two experiments were implemented in the soccer field with a square of size 60 m × 60 m. The monitoring area was divided into 3 × 3 grids so that, each grid occupies a 20 m × 20 m area. The trans- mission power of each sensor node was set as –1dBm for which, the radio transmission range could reach around 30 m, which was approximately equal to the diagonal length of each grid. Four Anchors were placed at the four corners of the region and four relay nodes were placed at the four points indicated as A, B, C, and D. To simulate the animals’ motion, an experimenter holding the sensor node was moving inside the region from the grid marked “1”, “2” “3”, and until the middle grid marked “9”. At the base station side which was connected to a PC ter- minal, the monitoring software would analyze the data sent by the sensor nodes and then output the grid region which the examiner was in. 5.1. Hardware Requirements Table 1 shows the hardware list during the implementa Figure 12. Monitoring Area Layout. Table 1. Hardware List. Hardware Model Image Gateway board MB520 Mote sensor data acqui- sition board MTS300CA Mote MPR2400CA Workstation Any model tion. For further information about each hardware com- ponent, Interested readers can refer to the Crossbow MICAz datasheet [9 ], MPR-MIB User s Manual [10] and MTS/MDA Se nsor Board Users Manual [1 1]. 5.2. Results for Experiment 1 The experiment started as the examiner walking from Anchor 1. Under this condition, the node held by the examiner could communicate with Anchor 1 directly, communicate with Anchor 2 through relay nodes A and B, communicate with Anchor 3 through relay nodes C and A, and communicate with Anchor 4 through relay nodes D and A. So the set of hop-counter values received at base station was H = {1, 3, 3, 3}. By using the formula 12 a ccc c N BBB Bto calculate the overlap area, the output was then generated and as shown in Figure 13. Next, when the examiner reached the border of grid 1 and grid 2, where the hop-counter value was H = {1, 2, 3, 3}, the system would output a line in between those two grids, which represented the overlapped region as shown in Figure 14. As the process continued, the examiner would reach purely inside grid 2, so that, the set of hop counters would be H= {2, 2, 3, 3}. But by using the formula 12 a ccc c N BBB B to calculate the overlap region, the output would be a two-grid sized region which is 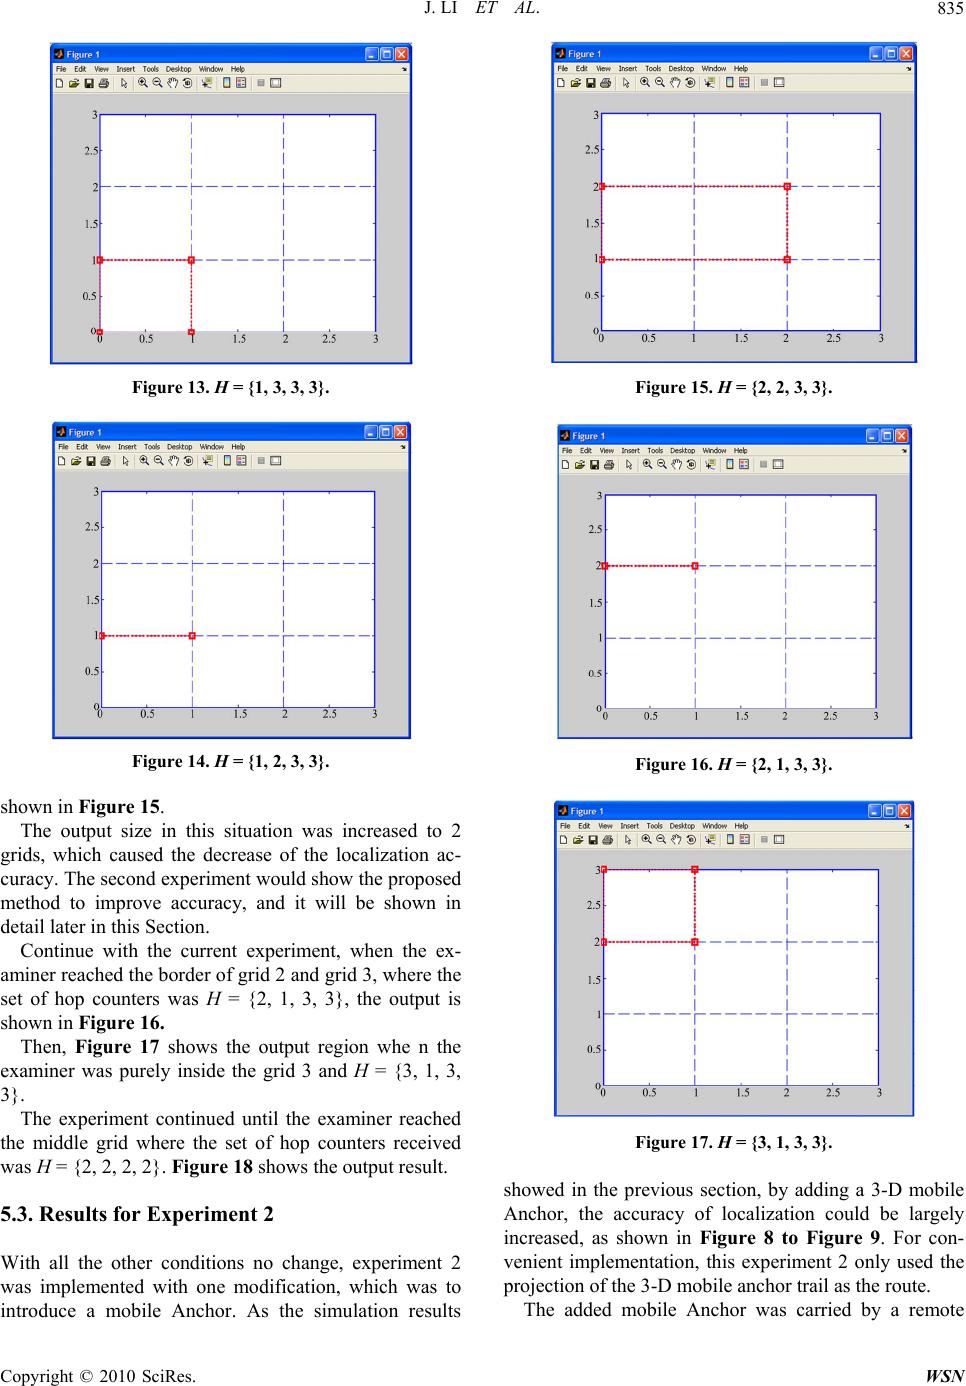 J. LI ET AL. Copyright © 2010 SciRes. WSN 835 Figure 13. H = {1, 3, 3, 3}. Figure 14. H = {1, 2, 3, 3}. shown in Figure 15. The output size in this situation was increased to 2 grids, which caused the decrease of the localization ac- curacy. The second experiment would show the proposed method to improve accuracy, and it will be shown in detail later in this Section. Continue with the current experiment, when the ex- aminer reached the border of grid 2 and grid 3, where the set of hop counters was H = {2, 1, 3, 3}, the output is shown in Figure 16. Then, Figure 17 shows the output region whe n the examiner was purely inside the grid 3 and H = {3, 1, 3, 3}. The experiment continued until the examiner reached the middle grid where the set of hop counters received was H = {2, 2, 2, 2}. Figure 18 shows the output result. 5.3. Results for Experiment 2 With all the other conditions no change, experiment 2 was implemented with one modification, which was to introduce a mobile Anchor. As the simulation results Figure 15. H = {2, 2, 3, 3}. Figure 16. H = {2, 1, 3, 3}. Figure 17. H = {3, 1, 3, 3}. showed in the previous section, by adding a 3-D mobile Anchor, the accuracy of localization could be largely increased, as shown in Figure 8 to Figure 9. For con- venient implementation, this experiment 2 only used the projection of the 3-D mobile anchor trail as the route. The added mobile Anchor was carried by a remote 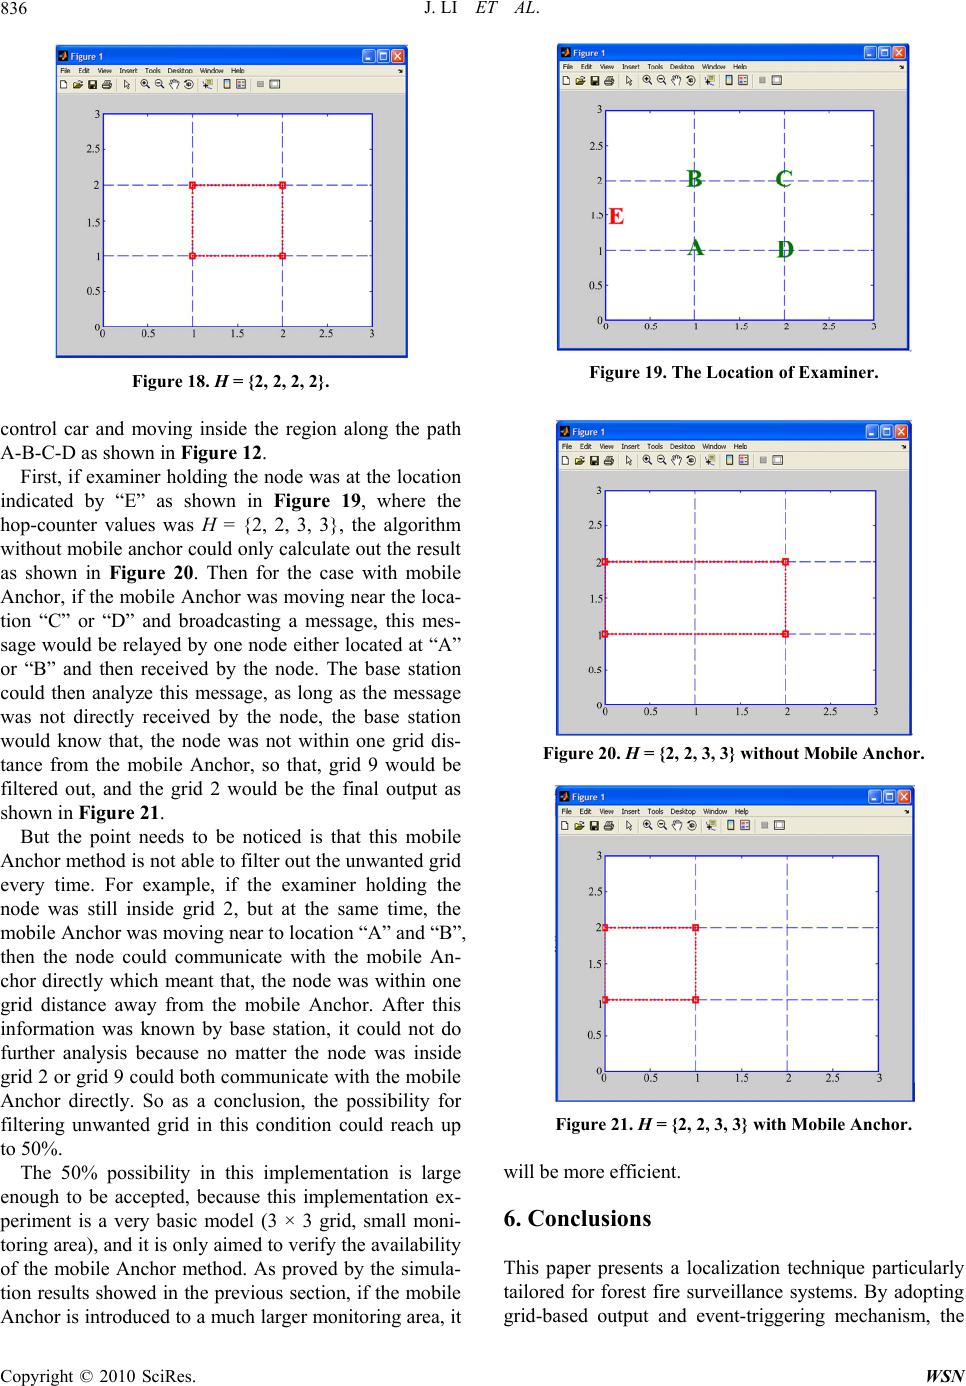 J. LI ET AL. Copyright © 2010 SciRes. WSN 836 Figure 18. H = {2, 2, 2, 2}. control car and moving inside the region along the path A-B-C-D as shown in Figure 12 . First, if examiner holding the node was at the location indicated by “E” as shown in Figure 19, where the hop-counter values was H = {2, 2, 3, 3}, the algorithm without mobile anchor could on ly calculate out the result as shown in Figure 20. Then for the case with mobile Anchor, if the mobile Anchor was moving near the loca- tion “C” or “D” and broadcasting a message, this mes- sage would be relayed by one node either located at “A” or “B” and then received by the node. The base station could then analyze this message, as long as the message was not directly received by the node, the base station would know that, the node was not within one grid dis- tance from the mobile Anchor, so that, grid 9 would be filtered out, and the grid 2 would be the final output as shown in Figure 21. But the point needs to be noticed is that this mobile Anchor method is not able to filter o ut the unwanted grid every time. For example, if the examiner holding the node was still inside grid 2, but at the same time, the mobile Anchor was moving near to location “A” and “B”, then the node could communicate with the mobile An- chor directly which meant that, the node was within one grid distance away from the mobile Anchor. After this information was known by base station, it could not do further analysis because no matter the node was inside grid 2 or grid 9 could both communicate with the mobile Anchor directly. So as a conclusion, the possibility for filtering unwanted grid in this condition could reach up to 50%. The 50% possibility in this implementation is large enough to be accepted, because this implementation ex- periment is a very basic model (3 × 3 grid, small moni- toring area), and it is only aimed to verify the availab ility of the mobile Anchor method. As proved by the simula- tion results showed in the previous section, if th e mobile Anchor is introduced to a much larger monitoring area, it Figure 19. The Location of Examiner. Figure 20. H = {2, 2, 3, 3} without Mobile Anchor. Figure 21. H = {2, 2, 3, 3} with Mobile Anchor. will be more efficient. 6. Conclusions This paper presents a localization technique particularly tailored for forest fire surveillance systems. By adopting grid-based output and event-triggering mechanism, the 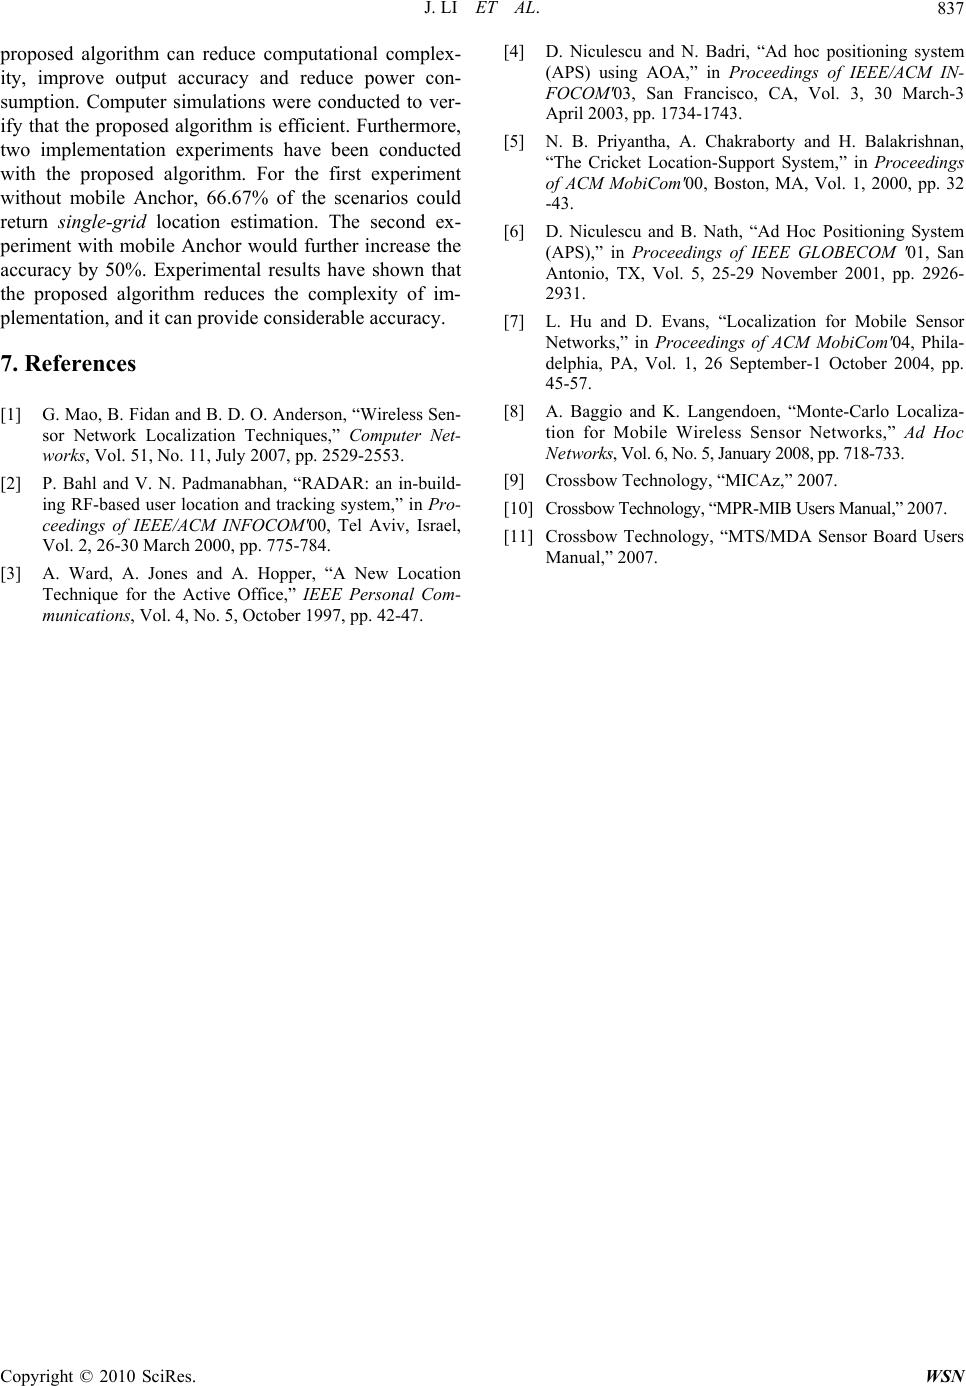 J. LI ET AL. Copyright © 2010 SciRes. WSN 837 proposed algorithm can reduce computational complex- ity, improve output accuracy and reduce power con- sumption. Computer simulations were conducted to ver- ify that the proposed algorithm is efficient. Furthermore, two implementation experiments have been conducted with the proposed algorithm. For the first experiment without mobile Anchor, 66.67% of the scenarios could return single-grid location estimation. The second ex- periment with mobile Anchor would further increase the accuracy by 50%. Experimental results have shown that the proposed algorithm reduces the complexity of im- plementation, and it can provide considerable accuracy. 7. References [1] G. Mao, B. Fidan and B. D. O. Anderson, “Wireless Sen- sor Network Localization Techniques,” Computer Net- works, Vol. 51, No. 11, July 2007, pp. 2529-2553. [2] P. Bahl and V. N. Padmanabhan, “RADAR: an in-build- ing RF-based user location and tracking system,” in Pro- ceedings of IEEE/ACM INFOCOM'00, Tel Aviv, Israel, Vol. 2, 26-30 March 2000, pp. 775-784. [3] A. Ward, A. Jones and A. Hopper, “A New Location Technique for the Active Office,” IEEE Personal Com- munications, Vol. 4, No. 5, October 1997, pp. 42-47. [4] D. Niculescu and N. Badri, “Ad hoc positioning system (APS) using AOA,” in Proceedings of IEEE/ACM IN- FOCOM'03, San Francisco, CA, Vol. 3, 30 March-3 April 2003, pp. 1734-1743. [5] N. B. Priyantha, A. Chakraborty and H. Balakrishnan, “The Cricket Location-Support System,” in Proceedings of ACM MobiCom'00, Boston, MA, Vol. 1, 2000, pp. 32 -43. [6] D. Niculescu and B. Nath, “Ad Hoc Positioning System (APS),” in Proceedings of IEEE GLOBECOM '01, San Antonio, TX, Vol. 5, 25-29 November 2001, pp. 2926- 2931. [7] L. Hu and D. Evans, “Localization for Mobile Sensor Networks,” in Proceedings of ACM MobiCom'04, Phila- delphia, PA, Vol. 1, 26 September-1 October 2004, pp. 45-57. [8] A. Baggio and K. Langendoen, “Monte-Carlo Localiza- tion for Mobile Wireless Sensor Networks,” Ad Hoc Networks, Vol. 6, No. 5, Januar y 2008, pp . 718-733 . [9] Crossbow Technology, “MICAz,” 2007. [10] Cr ossbow T ech nol og y , “ MP R - MI B U ser s M a nual , ” 2007. [11] Crossbow Technology, “MTS/MDA Sensor Board Users Manual,” 2007. |

