Paper Menu >>
Journal Menu >>
 J. Software Engi neeri n g & Applications, 2010, 3, 901-905 doi:10.4236/jsea.2010.310106 Published Online October 2010 (http://www.SciRP.org/journal/jsea) Copyright © 2010 SciRes. JSEA 901 AS-Level Internet Macroscopic Topology Centralization Evolvement Analysis Jie Song, Hai Zhao, Bo Yang, Huali Sun The School of Information Science & Engineering, Northeastern University, Shenyang, China. Email: moyuan87@163.com Received July 1st, 2010; revised August 1st, 2010; accepted August 5th, 2010. ABSTRACT The As-level topology is a hotspot of the recent reseaches. We can understand the centralization of the network clearly by researching the evolvement trend of the Internet macroscopic topology. The massive data we use in this paper is from CAIDA (The Cooperative Association for Internet Data Analysis) Skitter project. And the time sp an of the data is from July, 2001 to January, 2008. This paper introduces the background of the AS-level topology at first, then carries out the evolvement of degree, core and layer. It is believed that the influence of the top-degree nodes on the other nodes decreases and the centralization of network is going to fall off with the decrease of the core. And the nucleus status of network declines. Keywords: AS-Level, Centralization, Top-Degree, Core, Layer 1. Introduction The Internet has been a complex self-organizing ecosys- tem which is composed of numerous computers and is now quite different from its prototype, ARPANET. Al- though the Internet was built up by human personally, none of us can describe what it looks like and how it op- erates. The research on the Internet topology is to study the laws which are contained in the network which seems chaotic. It is inherently necessary to know the Internet by recognizing the inner mechanism of the network topol- ogy, the basis for developing and utilizing Internet in a higher level. Since the Internet was born, the studies on it have been endless. In the early years people were more concerned about the researches on the Internet architecture, the network protocols, the connections between the com- puters, as well as the service on the Internet. The results of the study on the complex science and complex net- works made the researchers at home and abro ad come to realize that the Internet has been one part of the complex networks in recent decades. Consequently, people began to research the Internet from the angle of the complexity and complex networks [1]. Recent years, people have made a remarkable progress in this area and have found a great number of characteristic laws which are hidden in the network. However problems still remain such as the small space, the short span of the data analysis and the simple method in measuring. So we have to do more comprehensive and further studies on it [2]. The researches on the Internet topology mainly con- centrates on AS-level (Autonomous System) and rout- ing-level. AS-level topology is in a higher level com- pared to the routin g-level topology in the network [3]. Its characteristics and changes have a great influence on the Internet. Meanwhile, since the scale of data of the AS-level topology is small, we can implement the com- putation and analysis more effectively with deep-seated, high time complexity and explore the objective charac- ters in more depth using the existed computer power [4]. More systematic analysis strategies and reliable analysis measures based on the results concluded by analyzing the AS-level topology can be summarized to study the laws in the router-level topology and to provide available means to statistical analysis for network with ultra large scale. Based on the main research trend in the recent years, we take the application value and the computa- tional cost in the practical analysis into account. So we will focus on the data of the AS-level Internet topology. Considering that the Internet is dynamic and its topology changes with time, we can further understand the cen- tralization of the network by studying the trend of the inner topology evolvement. 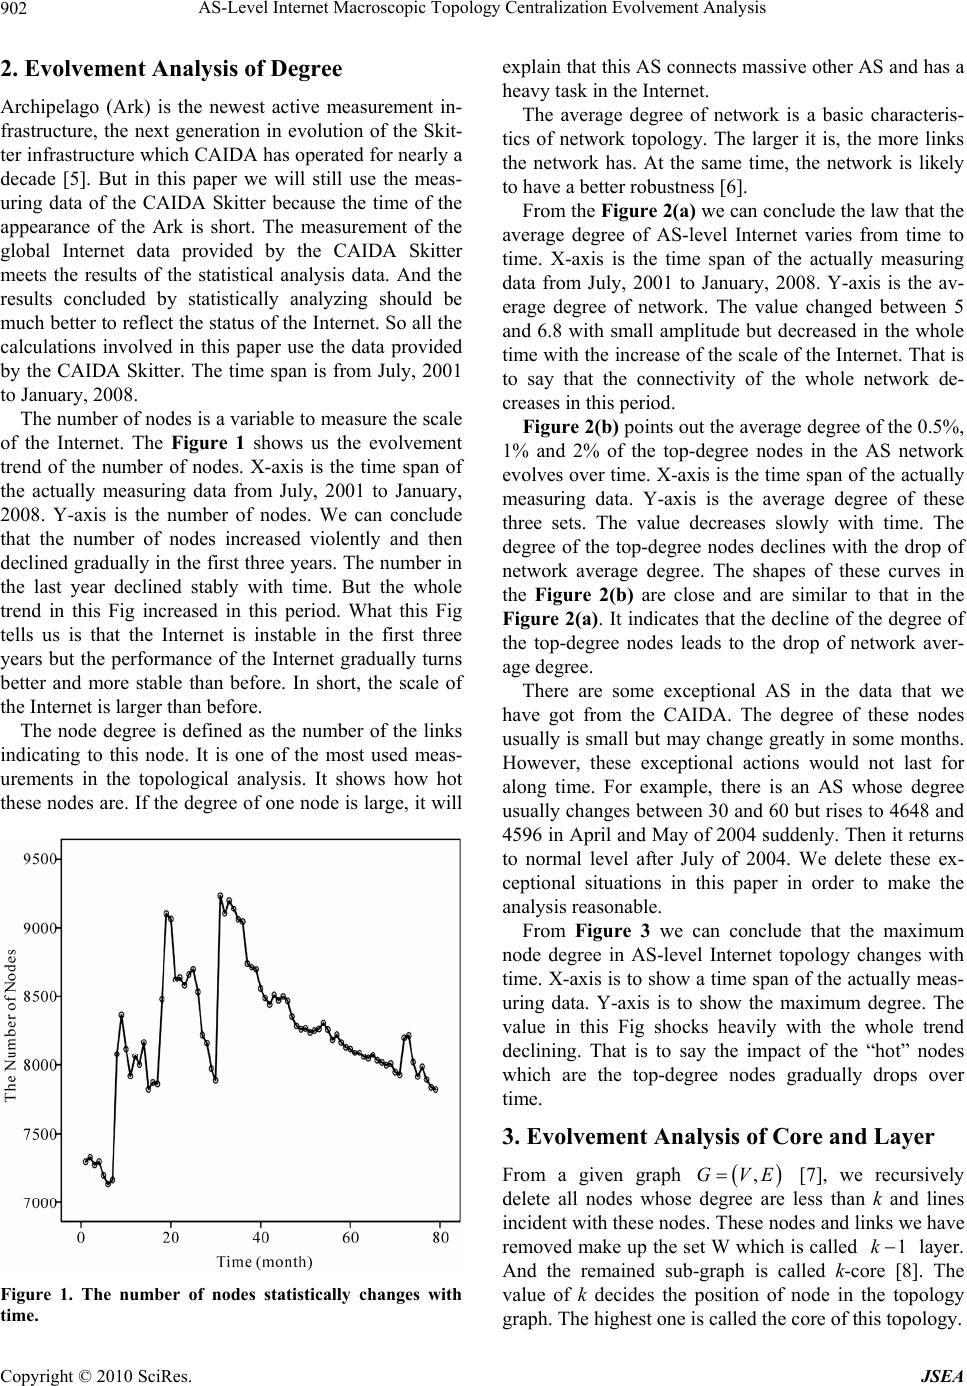 AS-Level Internet Macroscopic Topology Centralization Evolvement Analysis 902 2. Evolvement Analysis of Degree Archipelago (Ark) is the newest active measurement in- frastructure, the next generation in evolution of the Skit- ter infrastructure which CAIDA has operated for nearly a decade [5]. But in this paper we will still use the meas- uring data of the CAIDA Skitter because the time of the appearance of the Ark is short. The measurement of the global Internet data provided by the CAIDA Skitter meets the results of the statistical analysis data. And the results concluded by statistically analyzing should be much better to reflect the status of the Internet. So all th e calculations involved in this paper use the data provided by the CAIDA Skitter. The time span is from July, 2001 to January, 2008. The number of nodes is a variable to measure the scale of the Internet. The Figure 1 shows us the evolvement trend of the number of nodes. X-axis is the time span of the actually measuring data from July, 2001 to January, 2008. Y-axis is the number of nodes. We can conclude that the number of nodes increased violently and then declined gradually in th e first three years. The number in the last year declined stably with time. But the whole trend in this Fig increased in this period. What this Fig tells us is that the Internet is instable in the first three years but the performance of the Internet gradually turns better and more stable than before. In short, the scale of the Internet is larger than before. The node degree is defined as the number of the links indicating to this node. It is one of the most used meas- urements in the topological analysis. It shows how hot these nodes are. If the degree o f one node is large, it will Figure 1. The number of nodes statistically changes with time. explain that this AS connects massive other AS and has a heavy task in the Internet. The average degree of network is a basic characteris- tics of network topology. The larger it is, the more links the network has. At the same time, the network is likely to have a better robustness [6]. From the Figure 2(a) we can conclude the law that the average degree of AS-level Internet varies from time to time. X-axis is the time span of the actually measuring data from July, 2001 to January, 2008. Y-axis is the av- erage degree of network. The value changed between 5 and 6.8 with small amplitude but decreased in the whole time with the increase of the scale of the Internet. That is to say that the connectivity of the whole network de- creases in this period. Figure 2(b) points out the average degree of the 0.5%, 1% and 2% of the top-degree nodes in the AS network evolves over time. X-axis is the time span of the actually measuring data. Y-axis is the average degree of these three sets. The value decreases slowly with time. The degree of the top-degree nodes declines with the drop of network average degree. The shapes of these curves in the Figure 2(b) are close and are similar to that in the Figure 2(a). It indicates that the decline of the degree of the top-degree nodes leads to the drop of network aver- age degree. There are some exceptional AS in the data that we have got from the CAIDA. The degree of these nodes usually is small but may change greatly in some months. However, these exceptional actions would not last for along time. For example, there is an AS whose degree usually changes between 30 and 60 but rises to 4648 and 4596 in April and May of 2004 su ddenly. Then it returns to normal level after July of 2004. We delete these ex- ceptional situations in this paper in order to make the analysis reasonable. From Figure 3 we can conclude that the maximum node degree in AS-level Internet topology changes with time. X-axis is to show a time span of th e actually meas- uring data. Y-axis is to show the maximum degree. The value in this Fig shocks heavily with the whole trend declining. That is to say the impact of the “hot” nodes which are the top-degree nodes gradually drops over time. 3. Evolvement Analysis of Core and Layer From a given graph [7], we recursively delete all nodes whose degree are less than k and lines incident with these nodes. These nodes and links we have removed make up the set W which is called ,GVE 1k layer. And the remained sub-graph is called k-core [8]. The value of k decides the position of node in the topology graph. The highest one is called the core of this topology. Copyright © 2010 SciRes. JSEA 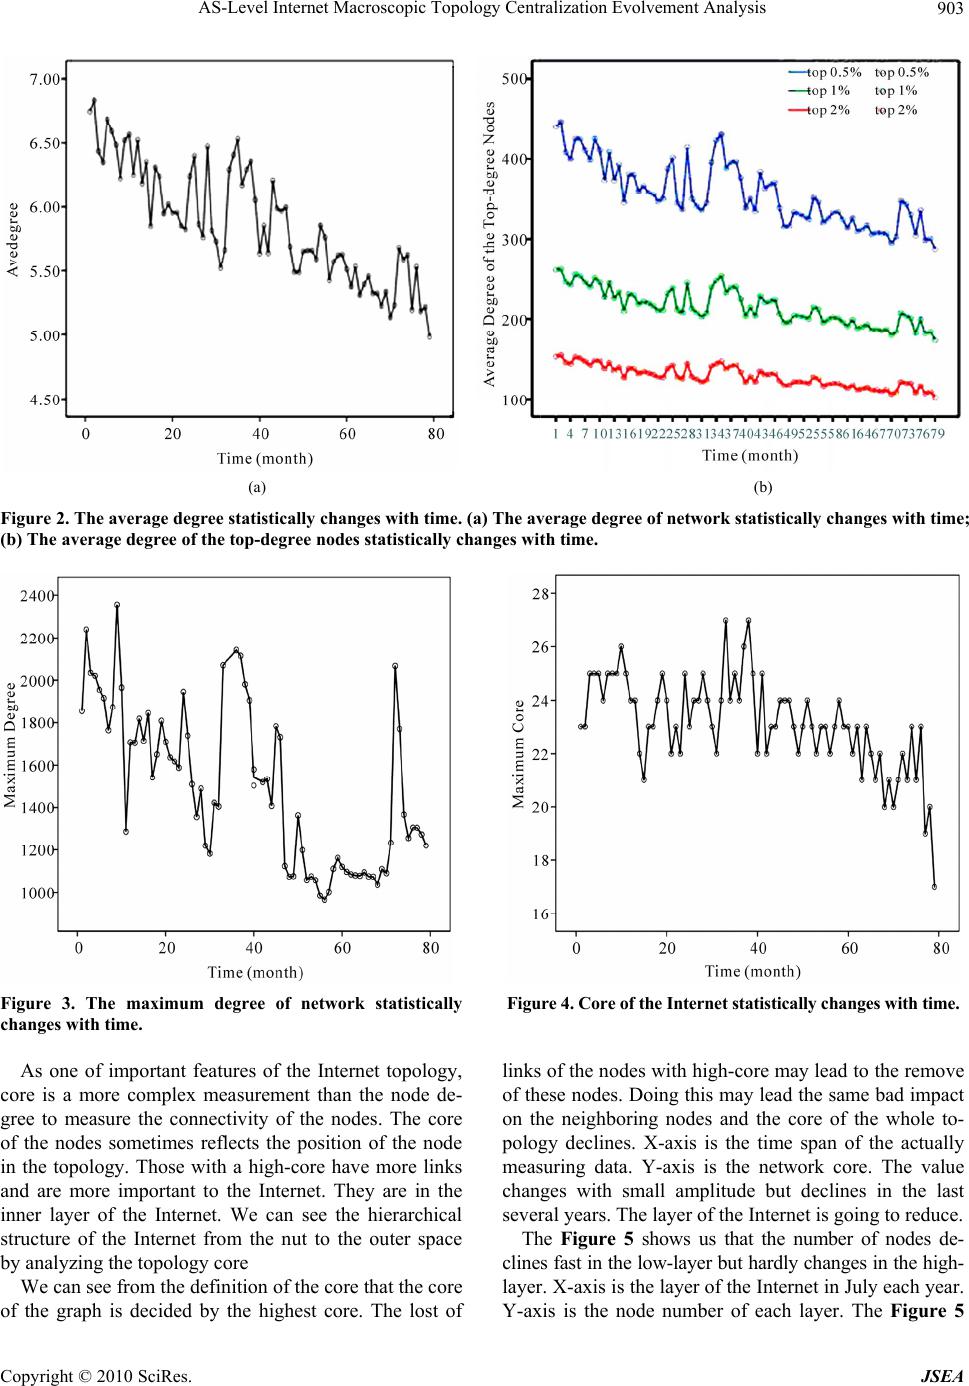 AS-Level Internet Macroscopic Topology Centralization Evolvement Analysis Copyright © 2010 SciRes. JSEA 903 (a) (b) Figure 2. The average degree statistically changes with time. (a) The average degree of network statistically changes with time; (b) The average degree of the top-degree nodes statistically changes with time. Figure 3. The maximum degree of network statistically changes with time. Figure 4. Core of the Internet statistically changes with time. As one of important features of the Internet topology, core is a more complex measurement than the node de- gree to measure the connectivity of the nodes. The core of the nodes sometimes reflects the position of the node in the topology. Those with a high-core have more links and are more important to the Internet. They are in the inner layer of the Internet. We can see the hierarchical structure of the Internet from the nut to the outer space by analyzing the topology core links of the nodes with high-core may lead to the remove of these nodes. Doing this may lead th e same bad impact on the neighboring nodes and the core of the whole to- pology declines. X-axis is the time span of the actually measuring data. Y-axis is the network core. The value changes with small amplitude but declines in the last several years. The layer of the Inter net is going to reduce. The Figure 5 shows us that the number of nodes de- clines fast in th e low-layer but hard ly changes in the h igh- layer. X-axis is the layer of the Internet in July each year. Y-axis is the node number of each layer. The Figure 5 We can see from the definition of the core that the core of the graph is decided by the highest core. The lost of 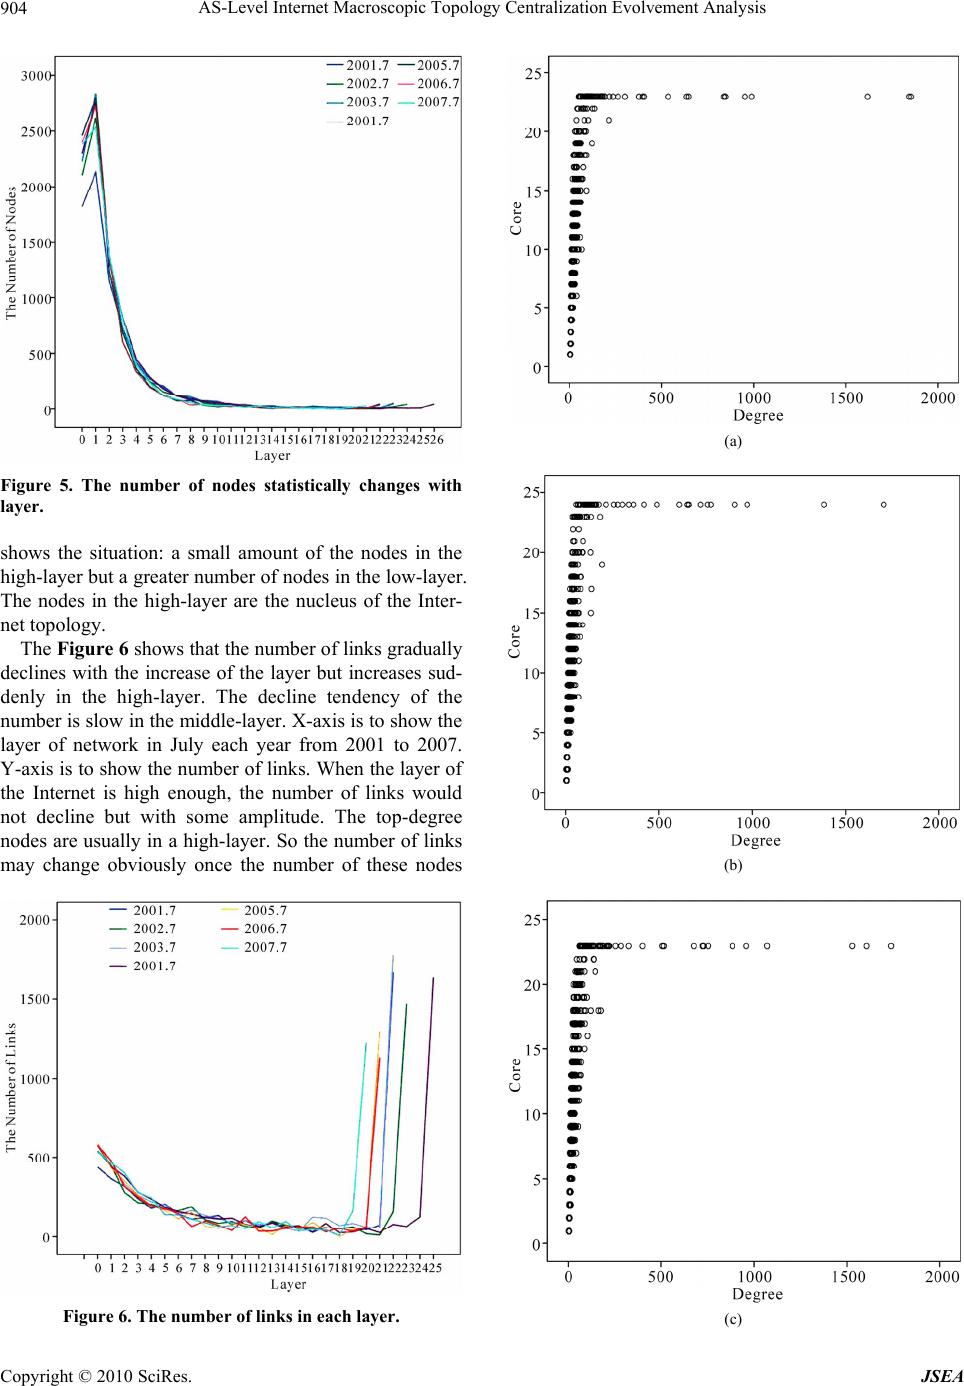 AS-Level Internet Macroscopic Topology Centralization Evolvement Analysis 904 Figure 5. The number of nodes statistically changes with layer. shows the situation: a small amount of the nodes in the high-layer but a greater number of nodes in the low-layer. The nodes in the high-layer are the nucleus of the Inter- net topology. The Figure 6 shows that the number of links gradually declines with the increase of the layer but increases sud- denly in the high-layer. The decline tendency of the number is slow in the middle-layer. X-axis is to show the layer of network in July each year from 2001 to 2007. Y-axis is to show the number of links. When the layer of the Internet is high enough, the number of links would not decline but with some amplitude. The top-degree nodes are usually in a high-layer. So the number of links may change obviously once the number of these nodes Figure 6. The number of links in each layer. (a) (b) (c) Copyright © 2010 SciRes. JSEA  AS-Level Internet Macroscopic Topology Centralization Evolvement Analysis Copyright © 2010 SciRes. JSEA 905 changes. Figure 7 shows the set of degree in each core. X-axis is the set of degree in each core. Y-axis is the core of network in July. Core of the Internet decline with time which corresponds with the conclusion we have known in the Figure 4. The bottom-degree distributes in each core but top-degree only appears in the high-core. The high-core includes the nodes whose degree changes in a large span. So the change of the maximum degree has impact on the high-core in network to a certain extend. The rarefaction in the high-cor e and the denseness in th e low-core tells us that the centralization is going to fall off. 4. Conclusions The data we use in this paper is massive and with a large time span from July, 2001 to January, 2008. They are observed by the partner of Embedded Technology Labo- ratory in Northeastern University, CAIDA. The laws we get by analyzing th ese data are as follows: (d) The influence of the top-degree nodes on the other nodes decreases. The core of the Internet decreases with time. We can also say that the centralization of network is going to fall off. The nucleus status of network de- clines. REFERENCES [1] S. Zhou and R. J. Mondragon, “Structural Constraints in Complex Networks,” New Jou rnal of P hysic s, Vol. 9, No. 172, 2007, pp. 1-11. [2] D. Y. Fu, H. Zhao and X. Ge, “AS-Level Internet Topol- ogy Degree and Connectivity Analysis,” Compute Sci- ence, Vol. 36, No. 10, 2009, pp. 104-105. (e) [3] L. Subramanian, V. N. Padmanabhan and R. H. Katz, “Geographic Properties of Internet Routing,” Proceedings of the USENIX Annual Technical Conference, Monterey, 2002, pp. 243-259. [4] J. Li, M. Sung, J. Xu, et al, “Large-Scale IP Trace Back in High-Speed Internet: Practical Techniques and Theo- retical Foundation,” Proceeding of the IEEE Symposium on Security and Privacy, California, USA, 2004, pp. 115- 129. [5] CAIDA Skitter, [EB/OL], http://www.caida.org/tools/ measurement/skitter/ [6] W. Willinger and J. Doyle, “Robustness and the Interact: Design and Evolution,” [EB/OL]. 2002. http://netlab.altech. edu/Internet/ [7] D. B. West, “Introduction to Graph Theory,” China Ma- chine Press, Beijing, 2006, pp. 339-348. [8] X. F. Wang, X. Li and G. R. Chen, “The Theory and Ap- plication of Complex Network,” TsingHua University Press, Beijing, 2006. (f) Figure 7. The relationship between the degree and the core of the nodes. (a) 2001.7; (b) 2002.7; (c) 2003.7; (d) 2004.7; (e) 2005.7; (f) 2006.7. |